
Journal of Resources and Ecology >
Spatio-temporal Changes and Influencing Factors of the Travel Network on China’s National Day Holiday under COVID-19
|
DONG Yaojia, E-mail: dongyaojia0365@igsnrr.ac.cn |
Received date: 2024-05-13
Accepted date: 2024-09-12
Online published: 2025-01-21
Supported by
National Natural Science Foundation of China(42271252)
National Natural Science Foundation of China(42230510)
National Natural Science Foundation of China(42371253)
Theme Academic Activities of National Social Science Foundation Academic Societies(22STA021)
COVID-19 has tremendously impacted the travel habits of urban residents. This study used the “node- line segment-network” hierarchy and Baidu migration big data to conduct a comparative analysis of the travel network patterns of urban people on China’s National Day holiday before and during the COVID-19 outbreak (i.e., 2019 and 2021). The results revealed four interesting patterns: (1) In 2021, there was an increase in the aggregation coefficient and access to the intra-provincial linkage network, indicating a higher degree of the travel agglomeration of residents under the pandemic. (2) In 2021, the “hub-and-spoke” pattern on the national scale, the “core-edge” pattern of the intra-provincial scale and the “rhomboidal” structure of the extra-provincial scale were more contracted, aggregated, and low-value. (3) The coverage of the urban advantageous association decreased while the total numbers of urban clusters and single provincial clusters increased, reaching 25 and 16, respectively. This indicates that the pandemic intensified the effect of administrative boundaries as a barrier. (4) The primary determinants of movement during the pandemic were urban competition, policy control, administrative boundary barriers, and the travel intentions of residents.
DONG Yaojia , WANG Fuyuan , WANG Kaiyong . Spatio-temporal Changes and Influencing Factors of the Travel Network on China’s National Day Holiday under COVID-19[J]. Journal of Resources and Ecology, 2025 , 16(1) : 265 -282 . DOI: 10.5814/j.issn.1674-764x.2025.01.024
Table 1 Selection of variables and descriptive statistics for the factors influencing intercity travel |
| Variable type | Variable name | Variable description | Average value | Standard error |
|---|---|---|---|---|
| Dependent variable | Intercity travel scale | Intercity inflow scale index (ln) | 12.61 | 0.92 |
| Independent variable | GDP | Regional gross domestic product (ln) | 7.57 | 0.99 |
| GDP per capita | Per capita GDP (ln) | 10.94 | 0.60 | |
| Population | End-of-year resident population (ln) | 447.68 | 387.48 | |
| Practitioners | Total scale of employment (ln) | 12.72 | 0.92 | |
| Urbanization rate | Proportion of urban population to total population (%) | 0.62 | 0.14 | |
| Proportion of tertiary industry | Proportion of the tertiary industry’s output value to the Gross Domestic Product (%) | 49.31 | 8.02 | |
| Abundance of tourism resources | Tourism resource abundance degree (0, 1) based on the natural breaks method for the different levels | 0.38 | 0.24 | |
| Aviation | Division characterization, whether there is a flight (0, 1) | 0.58 | 0.49 | |
| High-speed rail | Whether high-speed rail is available (0, 1) | 0.75 | 0.43 | |
| Highway | Highway passenger traffic volume (ln) | 7.29 | 1.20 | |
| Administrative hierarchy | Administrative level of cities (municipalities directly under the Central Government =5, sub-provincial/ separately planned cities=4, provincial capitals=3, general prefecture-level cities=2, cities/counties directly governed by provinces=1) | 2.14 | 0.55 |
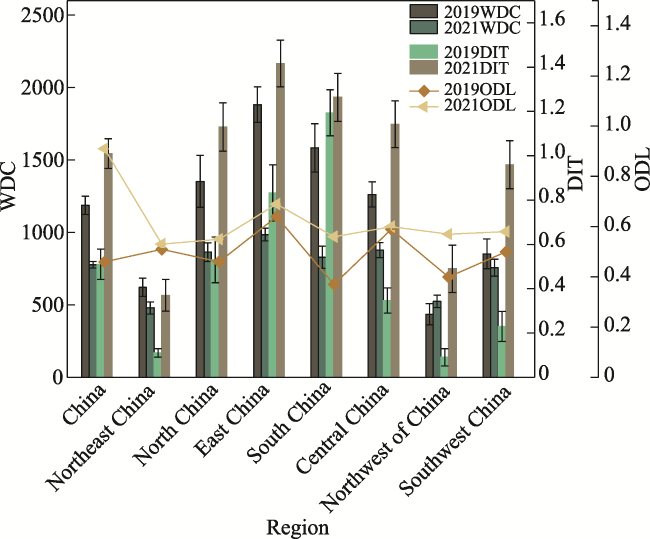
Figure 1 Comparison of the urban resident travel network structure indicators between the six major regions of China on the National Day holidays in 2019 and 2021 |
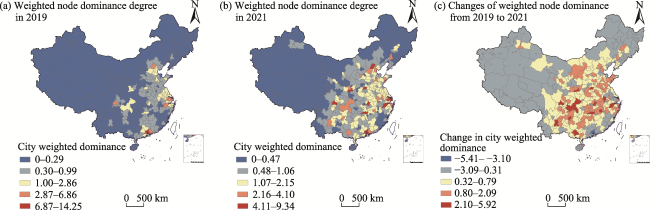
Figure 2 Spatial patterns of weighted node dominance of the urban resident travel networks in ChinaNote: Hong Kong, Taiwan and Macao were excluded from this study due to difficulties in obtaining data. |
Table 2 Dimensional attributes of the urban resident travel network on the National Day holiday |
| Time period | Range | Average travel length | Lines | Network density | Average path length | Average clustering coefficient |
|---|---|---|---|---|---|---|
| 2019 | National | 1973 | 37969 | 0.197 | 1.746 | 0.678 |
| 2021 | National | 1361 | 16504 | 0.152 | 1.807 | 0.752 |
| 2019 | Provincial contact | 10400 | 4847 | 0.141 | 2.023 | 0.736 |
| 2021 | Provincial contact | 6091 | 2345 | 0.108 | 1.924 | 0.844 |
| 2019 | Out-of-Province contact | 727 | 33122 | 0.178 | 1.671 | 0.452 |
| 2021 | Out-of-Province contacts | 452 | 14159 | 0.139 | 1.711 | 0.519 |
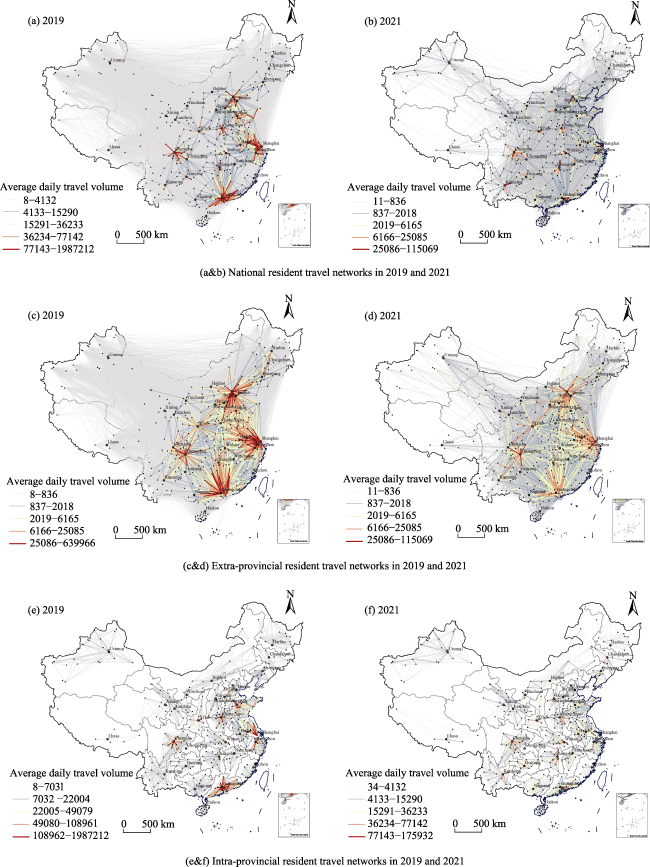
Figure 3 Spatial patterns of China’s National Day holiday travel networks in 2019 and 2021Note: Hong Kong, Taiwan, and Macao were excluded from this study due to difficulties in obtaining data. |
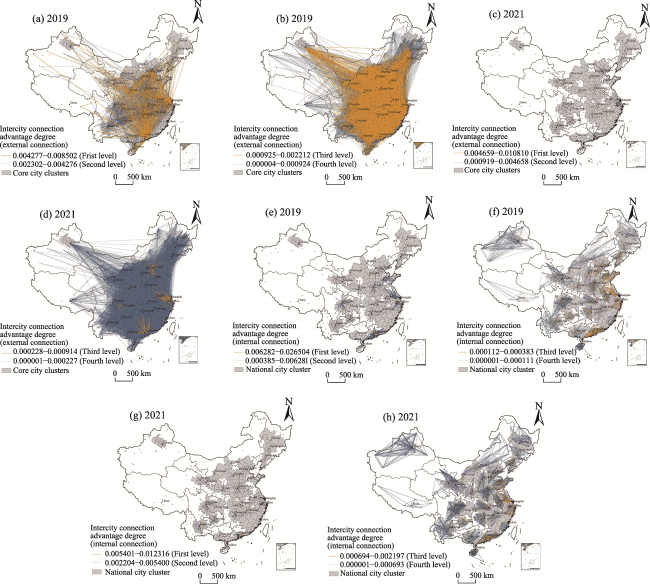
Figure 4 Spatial patterns of the advantageous association of intra- and extra-provincial city linkages during China’s National Day holiday (levels one to four)Note: Hong Kong, Taiwan, and Macao were excluded from this study due to difficulties in obtaining data. |
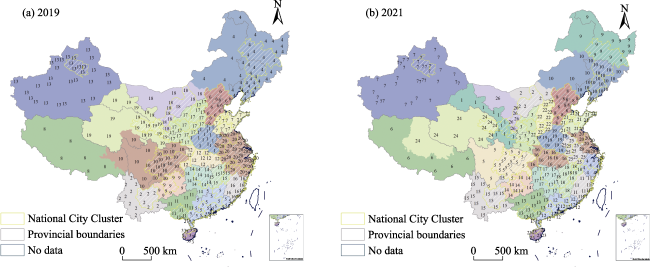
Figure 5 Spatial patterns of city grouping during China’s National Day holidayNote: The numbers in the figure represent the category of the cluster the area belong to. Hong Kong, Taiwan, and Macao were excluded from this study as their data could not be acquired. |
Table 3 SEM and SLM model fitting outcomes for the volume of public traffic during the National Day holiday |
| Explanatory variables | Explained variable: size of inflows | |
|---|---|---|
| SLM model | SEM model | |
| Per capita GDP | 0.191** | 0.192** |
| (0.0897) | (0.0897) | |
| Resident population | 0.000181 | 0.000169 |
| (0.000247) | (0.000249) | |
| Practitioner | 0.325*** | 0.329*** |
| (0.107) | (0.107) | |
| Urbanization rate | -0.718* | -0.725* |
| (0.424) | (0.426) | |
| Tertiary industry share | 0.0110* | 0.0108* |
| (0.00625) | (0.00624) | |
| Abundance of tourism resources | 0.005 70 | 0.045 30 |
| (0.004 58) | (0.004 56) | |
| Airline | -0.186* | -0.188** |
| (0.0956) | (0.0954) | |
| High-speed rail | -0.0133 | -0.0110 |
| (0.119) | (0.119) | |
| Highway | 0.118*** | 0.117*** |
| (0.0450) | (0.0453) | |
| Administrative level | -0.0956 | -0.0919 |
| (0.117) | (0.118) | |
| Constant term | 5.018*** | 4.981*** |
| (1.294) | (1.300) | |
| Spatial lag term | 0.00133*** | |
| (0.000428) | ||
| Spatial error term | 0.00300*** | |
| (0.00102) | ||
| Sample size | 297 | 297 |
Note: *, **, *** mean that the significant levels are 10%, 5%, 1%, respectively. |
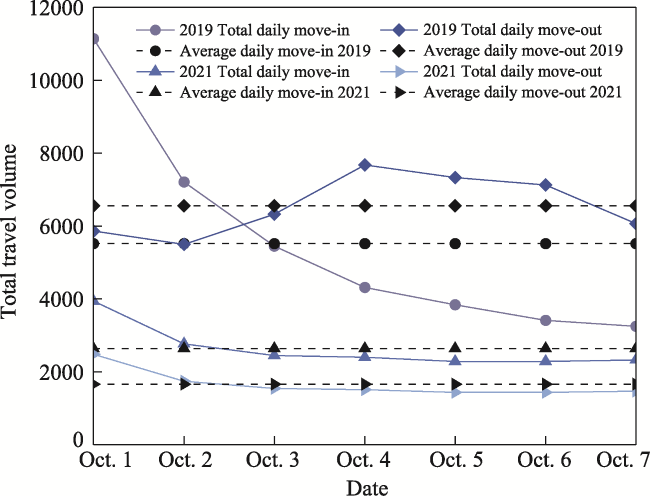
Figure 6 Urban resident travel volume on the National Day holidays in 2019 and 2021 |
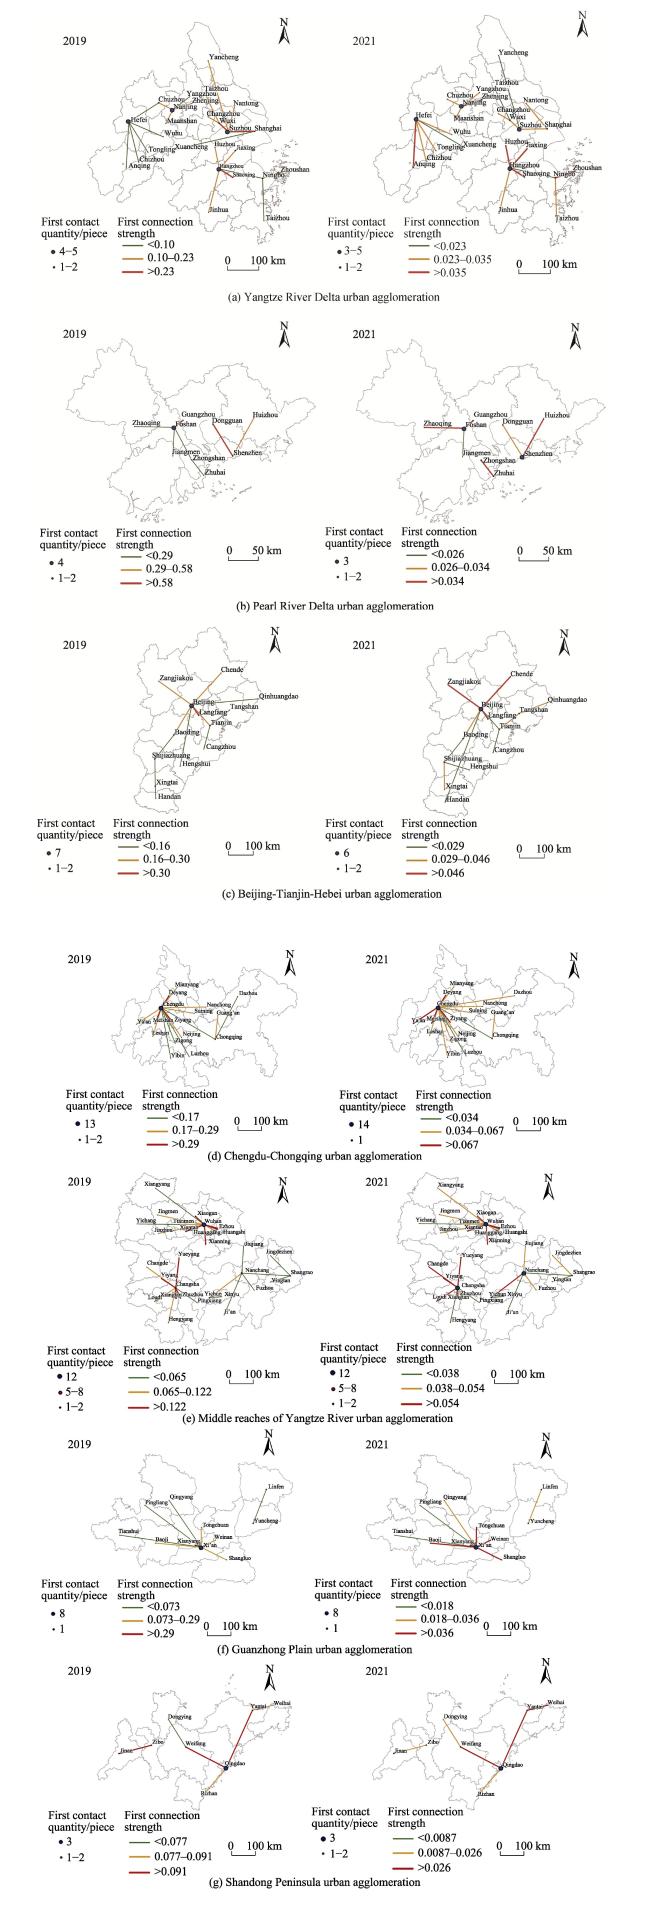
Figure 7 Spatial pattern of top linkages of the urban agglomerations in China in 2019 and 2021 |
| [1] |
|
| [2] |
|
| [3] |
|
| [4] |
|
| [5] |
|
| [6] |
|
| [7] |
|
| [8] |
|
| [9] |
|
| [10] |
|
| [11] |
|
| [12] |
|
| [13] |
|
| [14] |
|
| [15] |
|
| [16] |
|
| [17] |
|
| [18] |
|
| [19] |
|
| [20] |
|
| [21] |
|
| [22] |
|
| [23] |
|
| [24] |
|
| [25] |
|
| [26] |
|
| [27] |
|
| [28] |
|
| [29] |
|
| [30] |
|
| [31] |
TNCPERET (The Novel Coronavirus Pneumonia Emergency Response Epidemiology Team). 2020. The epidemiological characteristics of an outbreak of 2019 Novel Coronavirus Diseases (COVID-19)—China. China CDC Weekly, 2(8): 113-122. (in Chinese)
|
| [32] |
|
| [33] |
|
| [34] |
|
| [35] |
|
| [36] |
|
| [37] |
|
| [38] |
|
| [39] |
|
| [40] |
|
| [41] |
|
| [42] |
|
| [43] |
|
| [44] |
|
| [45] |
|
| [46] |
|
| [47] |
|
/
| 〈 |
|
〉 |