Ecotourism

The Tourist Plastic Footprint: A New Framework to Identify the Contributions of Tourists to Plastic Pollution

  • ZENG Yuxi ,
  • WANG Ling-en , * ,
  • ZHONG Linsheng
Expand
  • Institute of Geographic Sciences and Natural Resources Research, Chinese Academy of Sciences, Beijing 100101, China
*WANG Lingen, E-mail:

ZENG Yuxi, E-mail:

Received date: 2024-04-24

  Accepted date: 2024-09-12

  Online published: 2025-01-21

Supported by

National Natural Science Foundation of China(42171288)

National Natural Science Foundation of China(42201252)

Second Tibetan Plateau Scientific Expedition and Research of MOST of China(2019QZKK0401)

Abstract

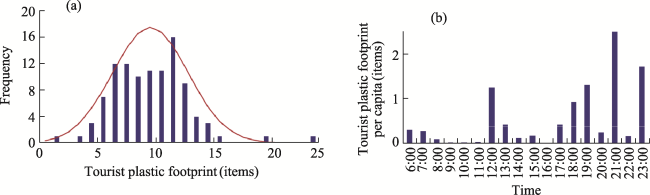
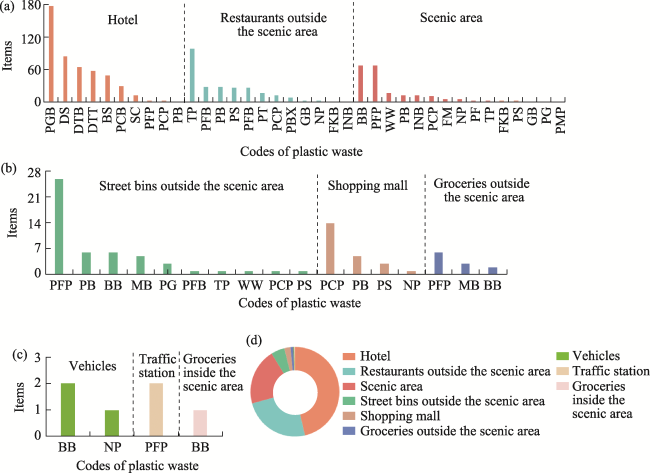
Tourism-related plastic waste poses a significant threat to ecosystems worldwide, underscoring the need for effective tools for measuring its generation and informing decision-making and management. This paper introduces the concept of the tourist plastic footprint through a conceptual framework analysis and proposes a measurement methodology that uses a time-geography approach. Empirical data were collected from Fragrant Hills Park in Beijing and analyzed using statistical methods. The findings reveal that the plastic footprint of tourists at Fragrant Hills Park averages 10.04±0.32 items per capita per day. The waste consists of 27 distinct components, with the key contributors including plastic garbage bags (17.12%), plastic food packaging (12.48%), and tableware packaging (9.96%). Plastic garbage bags are predominantly discarded in hotel settings, while tableware packaging is primarily disposed of in restaurants outside the scenic area. Plastic food packaging is discarded in various locations, including the scenic area, transportation hubs, and hotels. This study enhances the tourism ecological footprint literature by providing deeper insights into the plastic consumption of tourists and offering a structured framework for quantifying plastic waste. For practical application, it offers valuable guidance for decision-makers in tourist destinations who aim to improve their plastic pollution control measures.

Cite this article

ZENG Yuxi , WANG Ling-en , ZHONG Linsheng . The Tourist Plastic Footprint: A New Framework to Identify the Contributions of Tourists to Plastic Pollution[J]. Journal of Resources and Ecology, 2025 , 16(1) : 193 -205 . DOI: 10.5814/j.issn.1674-764x.2025.01.018

1 Introduction

The widespread use of plastic by tourists is a common occurrence during their travels (Zhang et al., 2023; Recabarren et al., 2024). This includes the packaging of food and beverages, the acquisition of souvenirs that are often accompanied by plastic bags, and the use of single-use items such as toothbrushes and toothpaste (Pham et al., 2023; Zhao et al., 2024). For the sake of convenience and hygiene, tourists often dispose of these plastics after a single use, which contributes significantly to the accumulation of plastic waste (Smith and Bernal, 2021; Stegmann et al., 2022).
Plastic waste has low rates of recycling and reuse. Of the 8300 million tons of plastic produced between 1950 and 2015, only 7% has been recycled, while over 50% has ended up in landfills or the environment (Boucher et al., 2019). Despite efforts to follow proper waste disposal practices, such as placing plastic waste in designated bins and landfills, littering remains prevalent in tourist destinations (Markić et al., 2024). Previous studies have highlighted tourists as the primary contributors to plastic litter in scenic areas (Pervez and Lai, 2022), and the volume of litter is positively correlated with visitor density (Santos et al., 2005; Aragaw et al., 2022; Cruz-Salas et al., 2022). The release of pollutants, particularly microplastics, from plastic waste raises concerns about their potential infiltration into the soil, food chain, and water cycle, thereby significantly impacting extensive ecosystems (Wang et al., 2023a; Li et al., 2024). Recognizing that plastic pollution as a major threat to global environments and ecosystems, the reduction of plastic waste has been identified as a key objective in the Post-2020 Global Biodiversity Framework by the International Union for Conservation of Nature (IUCN, 2022).
The plastic footprint has recently been introduced and defined as a metric for addressing the impact of human activities on plastic pollution (Boucher et al., 2019; Klemeš et al., 2021; Amadei et al., 2022). This metric has gained prominence, with significant studies illustrating its application. For instance, Amadei et al. (2022) found that the plastic footprint of European Union citizens ranges from 84 to 129 kilograms per capita annually. Mallick et al. (2021) examined the impact of COVID-19 on India’s plastic waste footprint, and highlighted the urgent need for effective management initiatives. In a comprehensive review, Boucher et al. (2019) outlined 19 different methodologies for calculating the plastic footprint that have been applied across various sectors, including agriculture, automotive, and medicine (Ghayebzadeh et al., 2020; Cabernard et al., 2021).
Nevertheless, few studies have quantified plastic waste in the context of tourism. Previous research on measuring the plastic footprints of individuals has predominantly concentrated on daily life within residential settings (Boucher et al., 2019), with limited attention to the plastic waste generated by individuals as tourists. The activities undertaken during travel differ significantly from everyday life, suggesting potential differences in the characteristics of plastic waste production. Unfortunately, the extent, spatiotemporal patterns, and constituent elements of plastics generated by tourists remain insufficiently explored.
To bridge this research gap, the present study aims to address two primary questions: 1) What is the tourist plastic footprint, and how can it be measured? and 2) What are the scale and composition of the tourist plastic footprint in a tourist destination? This study elucidates the concept of the tourist plastic footprint through a conceptual framework analysis, as outlined by Jabareen (2009), and formulates a measurement framework using a time-geography approach. Fragrant Hills Park in Beijing serves as the empirical study area, where the feasibility of assessing the tourist plastic footprint is demonstrated through an activity diary survey, descriptive statistical methods, and a hierarchical clustering method. This study contributes theoretically to the literature on the environmental impact of tourism by introducing and operationalizing the concept of the tourist plastic footprint, thereby enhancing our understanding of plastic usage and waste generation. For practical applications, it provides tourism managers with tools for assessing the extent of tourists’ contributions to plastic pollution, and offers a managerial framework for controlling plastic pollution.

2 Literature review

2.1 Plastic waste generated by tourists

The issue of plastic waste generated by tourists has attracted scholarly attention in the early 21st century. Kuniyal et al. (2003) found that during treks in the Indian Himalayan region, 26% of the non-biodegradable waste produced by tourists consisted of plastic waste. The identification of plastic pollution attributed to tourist activities in the Himalayan region has raised significant concerns, given the area’s historical status as being minimally impacted by human intervention. Recent studies on Mount Everest underscored the substantial increase in tourist activity, further exacerbating environmental concerns regarding the plastic waste generated by tourists (Napper et al., 2020; Yang et al., 2021).
Prior investigations into tourist plastic waste have predominantly focused on coastal island destinations, particularly in the Mediterranean and Caribbean Seas (Mankou- Haddadi et al., 2021; Mo et al., 2021; Corbau et al., 2022; Mghili et al., 2022; Portz et al., 2022). Other well-known marine island destinations, such as Jericoacoara National Park in Brazil (Brabo et al., 2022), the beaches of Goa in India (Nigam et al., 2022), Cox’s Bazar Coast in the Bay of Bengal (Rakib et al., 2022), the South China Sea Coast (Dou et al., 2021), Qingdao Beach in China (Pervez and Lai, 2022), Zanzibar (Maione, 2021), and Bali (Smith and Bernal, 2021), have also been studied. Additionally, urban tourist destinations, including municipalities in Spain (Delgado-Antequera et al., 2021), Suzhou (Jin et al., 2022), Guilin (Zhang et al., 2021), and Mar del Plata (Becherucci and Pon, 2014), have received scholarly attention. These studies have systematically explored various aspects of the issue, including the scale, spatial distribution, density, seasonal variations, and types of plastic waste found in these tourist destinations. For instance, Corbau et al. (2022) conducted a comprehensive study in North Sardinia, Italy, which involved collecting 7975 items over 12 months from five pocket beaches, and they identified plastics as the predominant waste type. Smith and Bernal (2021) reported varying waste densities in a Balinese coastal village, ranging from 1.633 items m-2 at a local tourist attraction (water wall) to 8.389 items m-2 on the beach at the end of the dry season in September 2018, with plastic food packaging (17.2%) being the most prevalent item. Aragaw et al. (2022) investigated Lake Tana in Ethiopia and found that the onset of the COVID-19 pandemic increased personal protective equipment pollution, with face masks constituting the majority (93.7%) of the observed pollution. In China, Pervez and Lai (2022) observed higher waste density on Qingdao tourist beaches during summer (0.13±0.04 items m-2) compared to winter (0.04±0.01 items m-2), with plastics constituting greater percentages in both summer (23.48%) and winter (24.04%) than other litter categories. Zhao et al. (2024) found a significant amount of plastic bottles on the tourism-intensive artificial coastlines of Dongjiang Port in the Binhai New Area, Tianjin, China. However, the characteristics of tourist plastic waste in mountainous destinations are not well understood. The enclosed terrain of these areas often obscures tourist behaviors, and the ecological environment is relatively fragile. Therefore, the behaviors associated with plastic waste in these settings require further study and understanding.
Previous research has predominantly focused on analyzing the spatial distribution characteristics of tourist plastic waste. However, there is a significant lack of studies that examine plastic waste from the perspective of the tourists themselves. Chatterjee and Barbhuiya (2021) investigated the water usage practices of Indian tourists and found that pro-environmental benefits, attitudes, and adherence to social norms were crucial factors influencing their willingness to reduce plastic use. That study identified the innovation of carrying water and the challenge of habit modification as primary obstacles to reducing plastic consumption. Forleo and Romagnoli (2021) explored the perceptions and opinions of the Italian public regarding marine plastic waste, and categorized the respondents into four distinct groups: the silent majority, the least concerned and involved, a small group of letter writers, and the most severe and committed. Lucrezi and Digun-Aweto (2020) examined the willingness of visitors to participate in litter clean-ups at Elegushi Royal Beach, Nigeria, and found a positive correlation between the visitors’ willingness to participate in clean-ups and their previous involvement in such activities, perceived collective responsibility, and the importance placed on policies and investments aimed at reducing litter. Sun et al. (2024) found that hikers’ awareness of consequences, ascription of responsibility, personal norms, environmental knowledge,
connectedness to nature, and pro-environmental behavior in everyday life significantly influenced their intention to engage in littering behavior at Wuyishan National Park in China. Wang et al. (2023b) discovered that higher tourist satisfaction could reduce litter at park sites in China. These studies primarily focused on the behavioral intentions of tourists rather than conducting empirical analyses of their actual plastic usage and waste generation behavior. Given that tourists contribute to plastic waste, understanding their plastic demand and environmental awareness are essential, as they directly affect plastic waste production. Therefore, this study aims to identify the plastic waste generated by tourists based on their observed plastic usage and waste generation behavior.

2.2 Plastic footprint

The term “footprint” was first introduced in environmental research with the concept of the “ecological footprint” in 1992. This concept, developed by Rees and Wackernagel (1996) and later expanded by Wackernagel and Rees (1998), aimed to quantify the ecological impact of human beings and the amount of bio-productive land required to sustain their activities. Over the ensuing decades, this terminology has broadened to include various dimensions such as carbon, nitrogen, water, and energy footprints (Magnani et al., 2007; Hoekstra and Mekonnen, 2012; Martinez et al., 2022). These conceptual frameworks are designed to represent the measurable impacts of human behavior on the ecological environment, and those impacts are often reflected in material emissions and resource consumption. For example, the carbon footprint delineates the direct and indirect greenhouse gas emissions resulting from human activities (Magnani et al., 2007), while the water footprint captures the total virtual water content consumed by all products and services within a specified area (Hoekstra and Mekonnen, 2012).
Existing studies on tourist footprints predominantly focus on the carbon and water dimensions (Luo et al., 2018; Filimonau et al., 2021; Lee et al., 2021). The assessment of tourist footprints is a valuable tool for identifying and predicting the environmental impacts of their activities on tourist destinations. In general, an increase in a tourist footprint increases the risk of environmental pollution and ecological degradation (Filimonau et al., 2021). Reducing tourist footprints and modifying their associated behaviors are effective strategies that tourism managers can use to prevent ecosystem issues and environmental pollution.
In response to the growing concern over plastic pollution, the concept of a plastic footprint has been introduced. However, a universally accepted definition of the plastic footprint is still lacking, and the existing literature has approached this topic from three principal perspectives (Boucher et al., 2019). First, from a usage perspective, the plastic footprint is defined as the quantifiable amount of plastic used within a system, typically expressed in kilograms per year. Second, from an emission standpoint, the plastic footprint is measured as the volume of plastic released into the environment throughout the entire life cycle of a plastic product, including production, transport, use, and end-of-life stages—a phenomenon commonly referred to as plastic leakage. In this context, the plastic footprint is considered an inventory that is measured in mass units representing the extent of plastic leakage into the environment. This comprehensive quantification of resource consumption and the pollutants, including plastic material and its associated toxins, emitted into the environment throughout the life cycle is designated as “the inventory” within the framework of life cycle assessment. Third, the impact perspective assesses the direct and/or indirect effects of emitted pollutants or leaked plastic on human health or the environment. The impact assessment component that is inherent to more sophisticated footprint methodologies requires delineating one or more impact pathways and employing life-cycle impact assessment methodologies. Typically, impact assessment involves the assessment of three key stages: Fate, exposure, and effect. Based on these perspectives, Boucher et al. (2019) have developed and categorized 19 measurement methods into three levels: 1) Business- or product-level footprint methodologies, tailored for the private sector; 2) National- or regional-level footprint methodologies, designed for the public sector; and 3) Individual-level footprint methodologies, intended for citizens and consumers.
The individual-level plastic footprint serves as a pertinent reference for gauging the plastic waste generated by tourists. However, existing methodologies are not suitable for direct application to tourists, as they primarily focus on the plastic waste generated in daily life, which differs significantly from the activities within a tourism context (Holmes et al., 2021). Common tourist activities such as sightseeing, dining out, and staying in hotels are not typically part of daily life (Bessiere and Tibere, 2013; Mitas and Bastiaansen, 2018). During travel, individuals often prioritize convenience and relaxation, potentially leading to reduced pro-environmental awareness and behavior (Miller et al., 2015; Juvan and Dolnicar, 2016; Holmes et al., 2021). Consequently, the characteristics of plastic waste in tourist destinations, including scale, components, and spatiotemporal distribution, may differ from those observed in residential settings. Given the increasing issue of tourism-related plastic pollution, there is a pressing need for a dedicated tool for measuring plastic waste in tourist destinations.

3 Methodology

3.1 Conceptualizing the tourist plastic footprint

This study used Jabareen’s (2009) conceptual framework analysis to conceptualize plastic footprints. Conceptual framework analysis is a methodological procedure for constructing conceptual frameworks that are applicable to multidisciplinary phenomena, such as sustainable development, and it is grounded in the grounded theory method. This analysis method is widely used in the environmental literature (Jabareen, 2013; Xavier et al., 2017), and it consists of eight distinct phases: 1) Mapping the selected data sources; 2) Conducting an extensive literature survey and categorizing the chosen data; 3) Identifying and naming concepts; 4) Deconstructing and categorizing the concepts; 5) Integrating the identified concepts; 6) Engaging in synthesis, resynthesis, and comprehension; 7) Validating the conceptual framework; and 8) Critically reassessing the framework.
This study systematically conducted a step-by-step analysis in accordance with the conceptual framework. Initially, a comprehensive search was performed on the Web of Science using the keywords “tour*”, “plastic*”, and “waste*”, which yielded 210 articles as of December 19, 2022. The textual and empirical data related to tourist plastic waste were meticulously extracted from this literature, which served as the foundational materials. Subsequently, six primary concepts were identified from the original materials that were collected (Table 1).
Table 1 Conceptual framework of tourist plastic footprint and selected sources of data
Concept Description Selected sources of data
Tourist (or overnight
visitor)
A visitor, whether domestic, inbound, or outbound, is designated as a tourist, or specifically an overnight visitor, if their journey entails an overnight stay (United Nations Statistical Division and World Tourism Organization, 2008) Tourism studies
Tourist destination A location or facility that is expected to draw a substantial influx of visitors originating from outside the economic development region (Macleod, 2005) Tourism, geography studies
Purchasing plastic Purchase of plastic products (Barnes, 2019) Ecology, environmental studies
Plastic waste generation Tourists produce plastic waste following their use of plastic products (Thompson et al., 2009; Wang and Li, 2021) Ecology, environmental studies
The plastic-related
activities of tourists
Tourist activities associated with plastic encompass both purchasing plastic and plastic waste generation. The term “activities” denotes the actions and behaviors undertaken by individuals in anticipation of and during a journey in their role as consumers, as defined by the United Nations Statistical Division and World Tourism Organization (2008). These tourist activities exert substantial influences on resource utilization Tourism, psychology, and
behavioral sciences
Ecological footprint The measure of humanity’s present demand on the Earth’s bio-productive capacity (Wackernagel et al., 2002) Ecology, environmental studies
In the third phase, the identified concepts were systematically integrated, and their interrelationships were delineated, resulting in the formulation of the initial conceptual framework. The fourth stage involved validating this initial framework through a review by an expert panel that consisted of two experts each from the fields of tourism, psychology and behavioral sciences, geography, ecology, and environmental studies. These experts were asked to meticulously examine and, if necessary, refine the relationships between the various concepts. The fifth step involved a careful examination and confirmation of the semantic clarity of the conceptual framework. Through this iterative process, this study successfully established the final conceptual framework of the tourist plastic footprint (Figure 1).
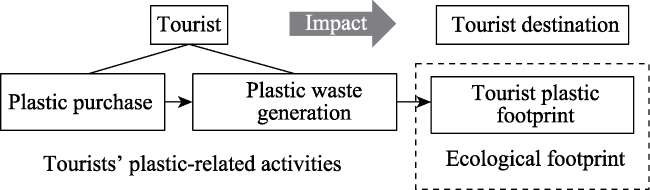
Figure 1 Conceptual framework of the tourist plastic footprint
The term “tourist plastic footprint” refers to the plastic waste generated by tourists through the use of plastic products within a tourist destination. This includes both direct and indirect acquisitions of plastic products. Direct acquisitions involve tourists purchasing products containing plastic directly from businesses. Indirect acquisitions encompass the combination of products and services obtained by tourists that include plastic items, such as disposable toothbrushes provided in hotel services. Tourists may either acquire plastic products within the tourist destination or they may purchase them externally and bring them into the destination. The plastic products obtained by tourists within tourist destinations may become plastic waste, or plastic waste may originate from outside the destination, and both sources contribute to the expansion of the tourist plastic footprint. A tourist's plastic footprint serves as an ecological footprint, and can be used to assess the environmental and ecosystem impacts of plastic generated by tourists. The generation of the tourist plastic footprint may exhibit spatiotemporal dynamics, potentially increasing during specific periods and in particular locations.

3.2 Measuring the tourist plastic footprint

In this study, a time-geography approach was employed to quantify the plastic footprint of tourists. The time-geography approach, rooted in the work of Hägerstrand (1989) and further developed by Shaw and Yu (2009), examines individual activities within a spatio-temporal context. It uses individual trajectories to delineate human behavior, and tracks an individual’s movements both spatially and temporally (Hägerstrand, 1989; Ellegård and Svedin, 2012). This methodology is commonly used in environmental studies. For example, it has previously been applied by Ellegård et al. (2016) to estimate the energy consumption associated with the daily activities of individuals, which identified the activities with high energy consumption and their corresponding temporal occurrences.
The movements of tourists within tourist destinations can be conceptualized as continuous spatio-temporal behavior (Gu et al., 2021). Tourists visit various locations at different times, including hotels, scenic areas, and restaurants, thereby creating individual time-space paths associated with plastic-related activities. The acquisition of specific details regarding these individual paths can be facilitated through activity diary surveys (Ellegård et al., 2016; Gu et al., 2021). Based on the existing literature, this study developed a questionnaire to assess the tourist plastic footprint. The initial questionnaire included two sections: 1) Demographic information, including gender, age, education, and monthly income, and 2) Plastic-related information, covering activities, plastic purchases, items and locations, plastic waste generation, and the corresponding items and locations across 24 periods. Activities were categorized into nine distinct types, plastic purchase locations were classified into seven categories, and plastic waste generation locations were divided into ten classifications. A total of 27 plastic item categories were identified by the consensus of five experts in tourism, ecology, and materials science. Preliminary testing was conducted with 30 tourists, and their feedback was used to refine the final questionnaire. Two adjustments were made to the final version: 1) The addition of the activity “rest”, and 2) The modification of “walking” to “walking traffic”. The comprehensive survey contents are detailed in Table 2.
Table 2 The final contents of the tourist plastic footprint survey
Question Content
Activity Sleeping, visiting, shopping, catering, having snacks, using vehicles, walking traffic, rest, others
Location of plastic purchase Restaurant outside the scenic area, groceries outside the scenic area, traffic station, groceries inside the scenic area, shopping mall, hotel, others
Location of plastic waste generation Restaurant outside the scenic area, groceries outside the scenic area, traffic station, groceries inside the scenic area, street bin outside the scenic area, vehicles, the scenic area, shopping mall, hotel, others
Plastic items Face masks
Disposable raincoats
Gum bottles
Beverage bottles
Milk bottles
Plastic straws
Plastic food packaging
Plastic bags (used for packing goods)
Instant noodle bowls
Plastic food boxes
Plastic tableware
Tableware packaging
Plastic cups
Fresh-keeping bags
Plastic film
Plastic boxes
Napkin packaging
Water wipes
Plastic medicine packaging
Disposable slippers
Disposable toothbrushes
Disposable toothpaste
Bathing supplies
Plastic combs
Shower caps
Plastic garbage bags
Souvenirs (with plastic packaging)

3.3 Study area and data collection

This study selected Fragrant Hills Park in Beijing as the case study location for several reasons. Fragrant Hills is a well-known mountainous tourist destination that attracts a large number of visitors. It provides ample shopping facilities where tourists can purchase plastic products, allowing for the observation of various behaviors related to plastic waste. Located in the northwestern region of Beijing, Fragrant Hills Park spans an area of 188 hectares and reaches a peak elevation of 575 meters above sea level. Visitors typically spend from one-half to a full day exploring the park, while their dining and accommodation needs are generally met outside the boundaries of the scenic area.
Data collection at Fragrant Hills Park was conducted from November 20 to December 15, 2022, using a nonprobabilistic sampling method. Specifically, an accidental or convenience sampling technique was employed, whereby subjects were selected based on their availability and willingness to participate (Atzori et al., 2018). Initial screening questions were used to identify overnight tourists within the target population. Those who expressed interest in participating in the survey provided their contact information via WeChat or email. To minimize disruption to the tourists' plastic-related activities, the questionnaire was sent the following day, and participants were asked to recall their activities and complete the survey before returning it via WeChat or email. Out of 237 tourists approached, 152 agreed to participate, and ultimately, responses were obtained from 103 individuals.
The sample exhibited a slight over-representation of males (50.5%), individuals aged 18-44 years (33.0%), those with a senior high school education (38.8%), and individuals with a monthly income ranging from 1001 to 5000 yuan (33.0%) (Figure 2). Among the 27 types of plastic items considered, tourists reported purchasing 23 types and discarding 26 types. Notably, disposable raincoats were not mentioned by any respondents, likely due to the study area transitioning into the dry season, so no rainy days occurred during the formal investigation.
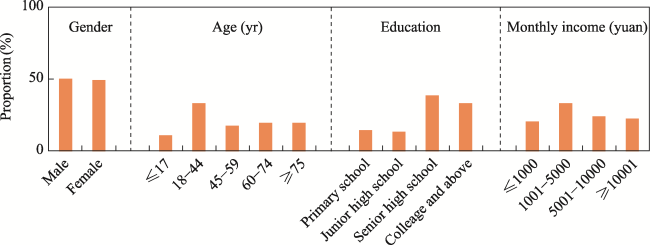
Figure 2 Demographic information of the sample (N=103)
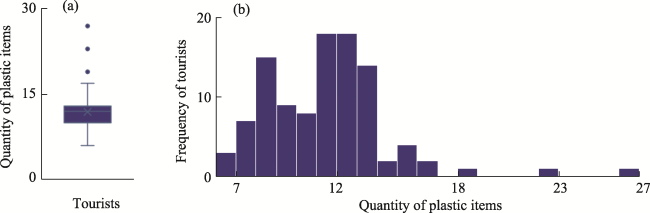
3.4 Data analysis

Descriptive statistical methods were employed to analyze the size and composition characteristics of the plastic footprints of the tourists, using metrics such as average value, standard error, coefficient of variation, extreme value, skewness, and kurtosis. The hierarchical cluster method was applied to categorize the components of the tourist plastic footprints, following the approach outlined by Dudhagara et al. (2016). The between-groups linkage method was used for clustering, with squared Euclidean distance serving as the measure of dissimilarity. The Euclidean distance was calculated as follows:
${{d}_{ij}}=\sqrt{\sum\limits_{k=1}^{m}{{{({{x}_{ik}}-{{x}_{jk}})}^{2}}}}$
where dij is the Euclidean distance of components i and j; and xik is the occurrence frequency of component i in location k; m is the total number of components. All statistical analyses were performed using IBM SPSS 25 software.

4 Results

4.1 Scale and components of the tourist plastic footprint

The plastic footprint of tourists in Fragrant Hills Park was recorded as 10.04±0.32 items per capita per day (Figure 3a). The observed range extends from a minimum of two items per day to a maximum of 24 items per day. There was only minor variation in the plastic footprints among the tourists, as indicated by a low coefficient of variation (0.324). The overall distribution pattern is relatively uniform, exhibiting positive skewness (0.832±0.238) and kurtosis (0.279±0.472). This indicates that the majority of individual tourists generated plastic footprints below the average value, contributing to the positive skewness observed in the distribution.
Figure 3 Plastic footprint of tourists

Note: a, Statistical distribution of the tourist plastic footprint; b, Temporal variation of the tourist plastic footprint during a day.

The peak values of the tourist plastic footprint were observed during four specific intervals in a day (Figure 3b): 21:00-21:59 (2.45±0.17), 23:00-23:59 (1.72±0.04), 19:00- 19:59 (1.31±0.12), and 12:00-12:59 (1.25±0.12). During other time periods, the plastic footprint per capita remained below one item. Analyzing these periods of elevated plastic footprints along with their corresponding locations revealed that the greater values during 21:00-21:59 and 23:00-23:59 were predominantly generated in hotels. The heightened value recorded during 19:00-19:59 was primarily associated with restaurants outside the scenic area, while the increase during 12:00-12:59 was observed within the scenic area itself.
From a spatial perspective, the tourist plastic footprints were concentrated in hotels, restaurants outside the scenic area, and the scenic area itself (Figure 4). Hotels had the highest incidence, with an average of 4.66±0.19 items per capita per day. The distribution of these plastic items was relatively concentrated, as indicated by a coefficient of variation of 2.276. The main contributors were plastic garbage bags (36.88%), disposable slippers (17.50%), and disposable toothbrushes (13.54%). Restaurants outside the scenic area had a significant plastic footprint of 2.45±0.09 items per capita per day, with a concentrated composition (coefficient of variation=2.247). The predominant components included tableware packaging (39.29%), plastic bags (11.11%), and plastic food boxes (11.11%). In the scenic area, the tourist plastic footprints averaged 2.05±0.14 items per capita per day. The components here also showed relative concentration (coefficient of variation=2.333), with beverage bottles (32.55%) and plastic food packaging (31.60%) being the most common. In other locations, the plastic footprints were recorded at levels below one item per capita per day.
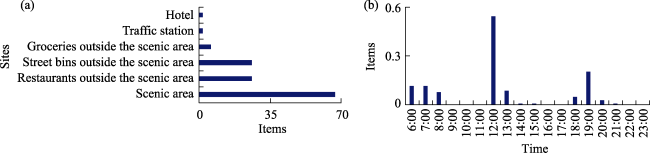
Figure 4 Spatial distribution and components of the tourist plastic footprint

Note: BB: beverage bottles; BS: bathing supplies; DS: disposable slippers; DTB: disposable toothbrushes; DTT: disposable toothpaste; FKB: fresh-keeping bags; FM: face masks; GB: gum bottles; INB: instant noodle bowls; MB: milk bottles; NP: napkin packaging; PB: plastic bags; PBX: plastic boxes; PCB: plastic combs; PCP: plastic cups; PF: plastic film; PFB: plastic food boxes; PFP: plastic food packaging; PG: plastic gloves; PGB: plastic garbage bags; PMP: plastic medicine packaging; PS: plastic straws; PT: plastic tableware; SC: shower caps; TP: tableware packaging; WW: water wipes.

Based on the predominant components of the tourist plastic footprints in each location, these components could be categorized into five distinct categories (Figure 5). The first category includes plastic garbage bags, which are notably abundant in hotels. The second category comprises bathing supplies, disposable toothpaste, toothbrushes, and slippers, which primarily originated from hotels but were present in lower quantities compared to the first category. The third category consists of beverage bottles and plastic food packaging, which were predominantly found in substantial quantities within scenic areas. The fourth category involves tableware packaging, which was prominently produced in restaurants located outside the scenic area. The fifth and final category includes various types of plastic items with smaller proportions that were generated across multiple locations.
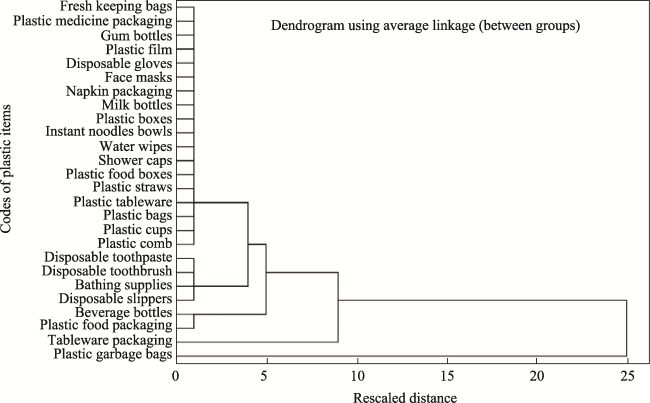
Figure 5 Clusters of plastic footprint components according to generating location
The components of the tourist plastic footprints showed a relatively concentrated distribution (coefficient of variation=1.189), with significant contributions from plastic garbage bags (17.12%), food packaging (12.48%), and tableware packaging (9.96%). The per capita quantities of these three types of plastic waste ranged from 1 to 1.718 items per day, indicating that nearly every individual generated these specific types of plastic waste during travel. Notably, the disposal of plastic garbage bags exhibited a distinct time- space concentration, primarily occurring in hotels around 23:00. In contrast, food packaging waste showed a broader distribution across various times and locations (Figure 6). Elevated quantities of food packaging waste were observed during multiple periods throughout the day, particularly between 12:00-12:59 and 19:00-19:59. A significant amount of food packaging waste was generated in scenic areas (51.94%), restaurants outside scenic areas (20.16%), and traffic stations (1.55%).
Figure 6 The distributions of plastic food packaging waste

Note: a. Spatial distribution; b. Temporal distribution.

4.2 Comparison of the tourist plastic footprint and plastic purchases

The average quantity of plastic items acquired by tourists was 11.95±0.31 items per capita per day, which exceeded the plastic footprint, suggesting an overflow of the tourist plastic footprint beyond the study area (Figure 7). A comparison between the composition of the plastic footprints and the types of plastic items purchased at tourist destinations revealed that souvenirs were the primary component of the excess plastic footprint. These souvenirs were purchased by tourists but did not transition into the waste within the confines of the tourist destinations.
Figure 7 Statistical distribution of plastic items purchased by tourists
Tourist destinations also bear the costs associated with plastic waste originating from external sources. An analysis of the plastic footprint components revealed certain items that were not purchased by tourists within the tourist destination, but were used and subsequently discarded, including masks, fresh-keeping bags, plastic film, and plastic medicine packaging. Although these items constituted only 1.26% of the total footprint, they highlight the need for tourist destinations to manage the burden of plastic waste from external sources.
The locations where tourists procured the plastic products exhibited a relatively concentrated distribution (coefficient of variation=1.052), primarily from hotels (38.91%), groceries within the scenic area (26.40%), and restaurants outside the scenic area (21.28%). The types of plastic items acquired in hotels also showed concentration (coefficient of variation=2.277), predominantly featuring plastic garbage bags (36.95%), disposable slippers (17.54%), and toothbrushes (13.57%). This distribution aligns with the tourist plastic footprints in hotels, suggesting that these plastic items were primarily purchased, used, and discarded within the hotel premises. For groceries within the scenic area, the purchase of plastic products was relatively concentrated (coefficient of variation=2.305), with a predominant focus on beverage bottles (28.31%), plastic food packaging (27.38%), and souvenirs (22.15%). This pattern closely mirrors the plastic footprints left by tourists in the scenic area’s groceries, except for the inclusion of souvenirs. At restaurants outside the scenic area, tourists primarily purchased tableware packaging (38.55%), plastic bags (11.45%), and food boxes (11.45%), which is consistent with the corresponding plastic footprint.

5 Conclusions and discussion

5.1 Findings

Given the limited research on the contributions of tourists to plastic pollution, this study developed a conceptual framework for understanding and measuring the tourist plastic footprint. The study using empirical data from Fragrant Hills Park in Beijing validated the feasibility of this framework, and indicated that the plastic footprint of tourists in Fragrant Hills Park averages 10.04±0.32 items per capita per day. The primary components of these footprints include plastic garbage bags, food packaging, and tableware packaging. The plastic footprints are concentrated in hotels, restaurants outside scenic areas, and scenic spots.
Hotels have the largest plastic footprint, primarily consisting of plastic garbage bags, disposable slippers, toothbrushes, and bathing supplies, with most of these items disposed of between 21:00-21:59. In restaurants outside the scenic areas, the main components of the plastic footprint are tableware packaging, plastic bags, and food boxes. In the scenic areas, beverage bottles and plastic food packaging are the predominant components.
There is an overflow of the tourist plastic footprint beyond the study area, primarily composed of souvenirs. Tourist destinations also bear the burden of plastic waste from external sources, including face masks, fresh-keeping bags, plastic film, and plastic medicine packaging.

5.2 Contributions

Tourist destinations are increasingly challenged by the issue of plastic waste generated by tourists. However, there is a notable lack of understanding regarding the generation and measurement of the plastic waste from tourists. This study introduces the concept of the tourist plastic footprint, which offers both theoretical and practical contributions to the field of plastic waste management.

5.2.1 Theoretical implications

This study represents the inaugural development of the tourist plastic footprint concept, which enhances our understanding of plastic waste generation by tourists and provides a tool for quantitatively assessing this waste. While previous research has focused on examining the plastic waste generated by tourists, it has overlooked the measurement of the tourists' plastic waste (Smith and Bernal, 2021; Corbau et al., 2022; Pervez and Lai, 2022). The introduction of the plastic footprint in this study makes a significant contribution to the literature on the environmental and ecological impacts of tourists. In the field of tourist environmental impacts, various indicators such as the carbon, water, and ecological footprints have been employed (Luo et al., 2018; Filimonau et al., 2021; Lee et al., 2021), but plastic has never been specifically addressed. Given the escalating severity of plastic pollution, incorporating the tourist plastic footprint into the framework of environmental impact analysis has become a pressing necessity. This study was grounded in research on plastic footprints and proposes the concept of the tourist plastic footprint while elaborating on its conceptual framework. This framework includes key elements such as the tourists, tourist destinations, plastic purchases, plastic waste generation, the plastic-related activities of tourists, and ecological footprint. This study developed the measurement of the tourist plastic footprint using a time-geography approach. This approach not only facilitates the determination of the magnitude of tourist plastic footprints but also identifies their spatiotemporal patterns.
Empirical validation using data from Fragrant Hills Park in Beijing supported the practicality of assessing tourist plastic footprints. The empirical findings enhance our understanding of tplastic consumption and waste generation by tourists. This study found that tourists visiting Fragrant Hills Park exhibit a plastic footprint of 10.04±0.32 items per capita per day. This observation suggests a positive correlation between an increasing tourist influx and a corresponding rise in plastic waste, heightening the risk of plastic pollution within tourist destinations. This investigation identified beverage bottles and plastic food packaging as the predominant types of plastic waste generated by tourists in scenic areas. These findings align with the research of Smith and Bernal (2021), which also highlighted plastic food packaging as the primary type of plastic waste in tourist destinations.
This study identified a diverse array of plastic waste materials generated by tourists in tourist destinations, including items such as wet wipes, instant noodle boxes, plastic cups, and plastic medicine packaging. This diversity can aids in pinpointing the origins of plastic litter, and aligns with the concerns highlighted by the European Union over the past decade (Veiga et al., 2016). The results emphasize that hotels play a crucial role in generating substantial plastic waste, particularly through the provision of disposable items like plastic garbage bags, disposable slippers, and toothbrushes. This underscores the importance of effective waste management practices within hotels to mitigate the environmental impact of plastic waste from tourists.
This study highlights the potential overflow of tourist plastic footprints to areas beyond the tourist destinations, including their places of residence. This finding suggests that tourists not only increase the risk of plastic pollution within tourist destinations but also introduce plastic waste to other locations through their travel activities. Moreover, this study identified face masks as components of the tourist plastic footprint, consistent with the observations of Aragaw et al. (2022). This finding indicates that the advent of COVID-19 has introduced new plastic pollution risks to tourist destinations.

5.2.2 Practical implications

This study has several practical implications for effective plastic waste management. First, it provides managers with a valuable tool for gauging plastic waste from tourists. Managers can use this tool to assess the current state of tourist plastic footprints within tourist destinations, which will help them to understand the scale, composition, and spatio-temporal distribution of such footprints. By leveraging information from tourist plastic footprints, managers can identify areas where higher volumes of plastic waste are generated. For example, this study indicated that hotels are a significant source of plastic waste from tourists. Currently, China's efforts to control plastic pollution in the tourism sector focus primarily on scenic spots, with comparatively less attention given to hotels (National Development and Reform Commission of the People’s Republic of China (NDRC) and Ministry of Ecology and Environment of the People’s Republic of China (MEE), 2021). Future initiatives should therefore prioritize improving plastic waste management in hotels, which could include strategies such as reducing the provision of disposable plastic products in hotels and promoting the use of more environmentally friendly materials. Additionally, by using multi-period data, managers can identify fluctuations in tourist plastic footprints across seasons, enabling the development of seasonal strategies to effectively manage and control the plastic waste generated by tourists.
Second, this study can help managers identify the primary components of tourist plastic waste, thereby providing insights into how they can alter the plastic usage habits of tourists. For example, the findings indicated that plastic waste in Fragrant Hills Park predominantly consists of beverage bottles and plastic food packaging. Managers can therefore implement initiatives to encourage tourists to choose non-plastic packaged beverages and food. This could include establishing non-plastic restaurants within the scenic area and providing incentives for tourists to bring their own non-plastic containers. Additionally, this study identified souvenirs as a major component of plastic waste overflowing from Fragrant Hills Park. In response, park managers could introduce initiatives such as “plastic-free gifts” and promote practices that encourage tourists to minimize plastic waste.
Third, this study highlights the need for managers to enhance the tourists’ awareness of reducing plastic product usage. The analysis indicated wide variation in the amount of plastic waste generated by tourists, ranging from two to 24 items per day. Additionally, some tourists produce only minimal amounts of plastic waste, indicating the potential for reducing the overall plastic footprint. Given that tourists primarily acquire plastic products from hotels, groceries within scenic areas, and restaurants outside scenic areas, managers can intensify their awareness campaigns in these locations by emphasizing the harmful effects of plastic pollution. Promoting responsible plastic usage among tourists is imperative, and managers can advocate for practices that aim to minimize plastic consumption.

5.3 Limitations and suggestions for future research

This study has three limitations which should be addressed in future research. First, this investigation focused solely on analyzing the tourists' plastic waste over a single day (24 hours) and did not cover the entire travel trip, which could span multiple days. Future research could examine tourist plastic footprints over longer temporal spans. Second, this study did not account for potential variations in the plastic footprints among tourists. Differences in demographic characteristics, levels of environmental awareness, travel behaviors, and motivations may result in variations in the plastic footprints of different types of tourists. Future research could explore these differences and the factors that influence them. Third, this study relied on self-reported activity diaries to analyze the spatio-temporal trajectories of the tourists’ plastic-related activities, which introduces a subjective element. Combining global positioning system (GPS) techniques with self-reported activity diaries could enhance the objectivity of the data on individual paths, thereby providing valuable insights for future studies.

Acknowledgements

The authors would like to thank the editor and the anonymous reviewers for their helpful and constructive comments which contributed to the improvement of this paper.
[1]
Amadei A M, Sanyé-Mengual E, Sala S. 2022. Modeling the EU plastic footprint: Exploring data sources and littering potential. Resources, Conservation and Recycling, 178: 106086. DOI: 10.1016/j.resconrec.2021.106086.

[2]
Aragaw T A, De-la-Torre G E, Teshager A A. 2022. Personal protective equipment (PPE) pollution driven by the COVID-19 pandemic along the shoreline of Lake Tana, Bahir Dar, Ethiopia. Science of the Total Environment, 820: 153261. DOI: 10.1016/j.scitotenv.2022.153261.

[3]
Atzori R, Fyall A, Miller G. 2018. Tourist responses to climate change: Potential impacts and adaptation in Florida’s coastal destinations. Tourism Management, 69: 12-22.

[4]
Barnes S J. 2019. Out of sight, out of mind: Plastic waste exports, psychological distance and consumer plastic purchasing. Global Environmental Change, 58: 101943. DOI: 10.1016/j.gloenvcha.2019.101943.

[5]
Becherucci M E, Pon J P S. 2014. What is left behind when the lights go off? Comparing the abundance and composition of litter in urban areas with different intensity of nightlife use in Mar del Plata, Argentina. Waste Management, 34: 1351-1355.

DOI PMID

[6]
Bessiere J, Tibere L, 2013. Traditional food and tourism: French tourist experience and food heritage in rural spaces. Journal of the Science of Food and Agriculture, 93: 3420-3425.

DOI PMID

[7]
Boucher J, Dubois C, Kounina A, et al. 2019. Review of plastic footprint methodologies: Laying the foundation for the development of a standardised plastic footprint measurement tool. International Union for Conservation of Nature (IUCN). DOI: 10.2305/IUCN.CH.2019.10.en.

[8]
Brabo L, Andrades R, Franceschini S, et al. 2022. Disentangling beach litter pollution patterns to provide better guidelines for decision-making in coastal management. Marine Pollution Bulletin, 174: 113310. DOI: 10.1016/j.marpolbul.2021.113310.

[9]
Cabernard L, Pfister S, Oberschelp C, et al. 2021. Growing environmental footprint of plastics driven by coal combustion. Nature Sustainability, 5: 139-148.

[10]
Chatterjee D, Barbhuiya M R. 2021. Bottled water usage and willingness to pay among Indian tourists: Visual nudges and the theory of planned behaviour. Scandinavian Journal of Hospitality and Tourism, 21: 531-549.

[11]
Corbau C, Lazarou A, Gazale V, et al. 2022. What can beach litter tell about local management: A comparison of five pocket beaches of the North Sardinia Island (Italy). Marine Pollution Bulletin, 174: 113170. DOI: 10.1016/j.marpolbul.2021.113170.

[12]
Cruz-Salas A A, Alvarez-Zeferino J C, Ojeda-Benitez S, et al. 2022. Solid waste and microplastics on the beaches of Holbox Island, Mexico. Regional Studies in Marine Science, 53: 102423. DOI: 10.1016/j.rsma.2022.102423.

[13]
Delgado-Antequera L, Gémar G, Molinos-Senante M, et al. 2021. Ecoefficiency assessment of municipal solid waste services: Influence of exogenous variables. Waste Management, 130: 136-146.

DOI PMID

[14]
Dou P C, Mai L, Bao L J. et al. 2021. Microplastics on beaches and mangrove sediments along the coast of South China. Marine Pollution Bulletin, 172: 112806. DOI: 10.1016/j.marpolbul.2021.112806.

[15]
Dudhagara D R, Rajpara R K, Bhatt J K, et al. 2016. Distribution, sources and ecological risk assessment of PAHs in historically contaminated surface sediments at Bhavnagar Coast, Gujarat, India. Environmental Pollution, 213: 338-346.

DOI PMID

[16]
Ellegård K, Svedin U. 2012. Torsten Hägerstrand’s time-geography as the cradle of the activity approach in transport geography. Journal of Transport Geography, 23: 17-25.

[17]
Ellegård K, Yan Z, Chen J. 2016. Visualization and applications of daily activities in the complex context. Human Geography, 31(5): 39-46.

[18]
Filimonau V, Rosa M S, Franca L S, et al. 2021. Environmental and carbon footprint of tourist accommodation: A comparative study of popular hotel categories in Brazil and Peru. Journal of Cleaner Production, 328: 129561. DOI: 10.1016/j.jclepro.2021.129561.

[19]
Forleo M B, Romagnoli L. 2021. Marine plastic litter: Public perceptions and opinions in Italy. Marine Pollution Bulletin, 165: 112160. DOI: 10.1016/j.marpolbul.2021.112160.

[20]
Ghayebzadeh M, Taghipour H, Aslani H. 2020. Estimation of plastic waste inputs from land into the Persian Gulf and the Gulf of Oman: An environmental disaster, scientific and social concerns. Science of the Total Environment, 733: 138942. DOI: 10.1016/j.scitotenv.2020.138942.

[21]
Gu Q, Zhang H, Huang S, et al. 2021. Tourists’ spatiotemporal behaviors in an emerging wine region: A time-geography perspective. Journal of Destination Marketing & Management, 19: 100513. DOI: 10.1016/j.jdmm.2020.100513.

[22]
Hägerstrand T. 1989. Reflections on “what about people in regional science?” Papers of the Regional Science Association, 66: 1-6.

[23]
Hoekstra A Y, Mekonnen M M. 2012. The water footprint of humanity. Proceedings of the National Academy of Sciences of the USA, 109: 3232-3237.

[24]
Holmes M R, Dodds R, Frochot I. 2021. At home or abroad, does our behavior change? Examining how everyday behavior influences sustainable travel behavior and tourist clusters. Journal of Travel Research, 60: 102-116.

[25]
International Union for Conservation of Nature (IUCN). 2022. The post-2020 global biodiversity framework (GBF) and environmental human rights defenders. https://www.iucn.org/resources/issues-brief/post-2020-global-biodiversity-framework. Viewed on 2023-10-11.

[26]
Jabareen Y. 2009. Building a conceptual framework: Philosophy, definitions, and procedure. International Journal of Qualitative Methods, 8: 49-62.

[27]
Jabareen Y. 2013. Planning the resilient city: Concepts and strategies for coping with climate change and environmental risk. Cities, 31: 220-229.

[28]
Jin X, Fu X, Lu W, et al. 2022. Fugitive release and influencing factors of microplastics in urbanized watersheds: A case study of the central area of Suzhou City. Science of the Total Environment, 837: 155653. DOI: 10.1016/j.scitotenv.2022.155653.

[29]
Juvan E, Dolnicar S. 2016. Measuring environmentally sustainable tourist behaviour. Annals of Tourism Research, 59: 30-44.

[30]
Klemeš J J, Fan Y V, Jiang P. 2021. Plastics: Friends or foes? The circularity and plastic waste footprint. Energy Sources, Part A: Recovery, Utilization, and Environmental Effects, 43: 1549-1565.

[31]
Kuniyal J C, Jain A P, Shannigrahi A S. 2003. Solid waste management in Indian Himalayan tourists’ treks: A case study in and around the Valley of Flowers and Hemkund Sahib. Waste Management, 23: 807-816.

[32]
Lee L C, Wang Y, Zuo J, et al. 2021. Water footprint of Chinese tourists: Directions and structure. Journal of Hydrolog, 603: 127151. DOI: 10.1016/j.jhydrol.2021.127151.

[33]
Li N Y, Zhong B, Guo Y, et al. 2024. Non-negligible impact of microplastics on wetland ecosystems. Science of the Total Environment, 924: 171252. DOI: 10.1016/j.scitotenv.2024.171252.

[34]
Lucrezi S, Digun-Aweto O. 2020. “Who wants to join?” Visitors’ willingness to participate in beach litter clean-ups in Nigeria. Marine Pollution Bulletin, 155: 111167. DOI: 10.1016/j.marpolbul.2020.111167.

[35]
Luo F, Becken S, Zhong Y. 2018. Changing travel patterns in China and ‘carbon footprint’ implications for a domestic tourist destination. Tourism Management, 65: 1-13.

[36]
Macleod D. 2005. Managing the tourist destination. Tourism Management, 26: 297-299.

[37]
Magnani F, Mencuccini M, Borghetti M, et al. 2007. The human footprint in the carbon cycle of temperate and boreal forests. Nature, 447: 849-851.

[38]
Maione C. 2021. Quantifying plastics waste accumulations on coastal tourism sites in Zanzibar, Tanzania. Marine Pollution Bulletin, 168: 112418. DOI: 10.1016/j.marpolbul.2021.112418.

[39]
Mallick S K, Pramanik M, Maity B, et al. 2021. Plastic waste footprint in the context of COVID-19: Reduction challenges and policy recommendations towards sustainable development goals. Science of the Total Environment, 796: 148951. DOI: 10.1016/j.scitotenv.2021.148951.

[40]
Mankou-Haddadi N, Bachir-bey M, Galgani F, et al. 2021. Benthic marine litter in the coastal zone of Bejaia (Algeria) as indicators of anthropogenic pollution. Marine Pollution Bulletin, 170: 112634. DOI: 10.1016/j.marpolbul.2021.112634.

[41]
Markić A, Iveša N, Budiša A, et al. 2024. Fragmented marine plastics as the prevalent litter type on a small island beach in the Adriatic. Marine Pollution Bulletin, 203: 116467. DOI: 10.2139/ssrn.4758310.

[42]
Martinez S, Gabriel J L, Alvarez S, et al. 2022. Institutional nitrogen footprint: Quantification of the nitrogen footprint of a Spanish Research Center. Science of the Total Environment, 818: 151721. DOI: 10.1016/j.scitotenv.2021.151721.

[43]
Mghili B, Analla M, Aksissou M, 2022. Face masks related to COVID-19 in the beaches of the Moroccan Mediterranean: An emerging source of plastic pollution. Marine Pollution Bulletin, 174: 113181. DOI: 10.1016/j.marpolbul.2021.113181.

[44]
Miller D, Merrilees B, Coghlan A, 2015. Sustainable urban tourism: Understanding and developing visitor pro-environmental behaviours. Journal of Sustainable Tourism, 23: 26-46.

[45]
Mitas O, Bastiaansen M. 2018. Novelty: A mechanism of tourists’ enjoyment. Annals of Tourism Research, 72: 98-108.

[46]
Mo A, D’Antraccoli M, Bedini G, et al. 2021. The role of plants in the face of marine litter invasion: A case study in an Italian protected area. Marine Pollution Bulletin, 169: 112544. DOI: 10.1016/j.marpolbul.2021.112544.

[47]
Napper I E, Davies B F R, Clifford H, et al. 2020. Reaching new heights in plastic pollution—Preliminary findings of microplastics on Mount Everest. One Earth, 3: 621-630.

[48]
National Development and Reform Commission of the People’s Republic of China (NDRC), Ministry of Ecology and Environment of the People’s Republic of China (MEE). 2021. Fourteenth five-year plan for plastic pollution control. http://www.gov.cn/zhengce/zhengceku/2021-09/16/content_5637606.htm. Viewed on 2023-11-28. in Chinese)

[49]
Nigam R, Luis A J, Prasad P, et al. 2022. Spatio-temporal assessment of COVID-19 lockdown impact on beach litter status and composition in Goa, India. Marine Pollution Bulletin, 174: 113293. DOI: 10.1016/j.marpolbul.2021.113293.

[50]
Pervez R, Lai Z. 2022. Spatio-temporal variations of litter on Qingdao tourist beaches in China. Environmental Pollution, 303: 119060. DOI: 10.1016/j.envpol.2022.119060.

[51]
Pham T B N, Vu B P, Huynh T T H, et al. 2023. Factors driving plastic-related behaviours: Towards reducing marine plastic waste in Hoi An, Vietnam. Journal of Cleaner Production, 427: 139179. DOI: 10.1016/j.jclepro.2023.139179.

[52]
Portz L, Manzolli R P, Villate-Daza D A, et al. 2022. Where does marine litter hide? The Providencia and Santa Catalina Island problem, SEAFLOWER Reserve (Colombia). Science of the Total Environment, 813: 151878. DOI: 10.1016/j.scitotenv.2021.151878.

[53]
Rakib Md R J, Ertaş A, Walker T R, et al. 2022. Macro marine litter survey of sandy beaches along the Cox’s Bazar Coast of Bay of Bengal, Bangladesh: Land-based sources of solid litter pollution. Marine Pollution Bulletin, 174: 113246. DOI: 10.1016/j.marpolbul.2021.113246.

[54]
Recabarren T, Torres M, Gómez V, et al. 2024. Occurrence of marine plastic litter and plasticizers from touristic beaches of Arauco Gulf in Central Chile. Marine Pollution Bulletin, 205: 116575. DOI: 10.1016/j.marpolbul.2024.116575.

[55]
Rees W, Wackernagel M. 1996. Urban ecological footprints: Why cities cannot be sustainable—And why they are a key to sustainability. Environmental Impact Assessment Review, 16: 223-248.

[56]
Santos I R, Friedrich A C, Wallner-Kersanach, et al. 2005. Influence of socio-economic characteristics of beach users on litter generation. Ocean & Coastal Management, 48: 742-752.

[57]
Shaw S-L, Yu H. 2009. A GIS-based time-geographic approach of studying individual activities and interactions in a hybrid physical-virtual space. Journal of Transport Geography, 17: 141-149.

[58]
Smith S D A, Bernal E. 2021. Quantifying mismanaged waste in a small Balinese coastal village: Comparisons of standing stock in different habitats. Ocean & Coastal Management, 202: 105433. DOI: 10.1016/j.ocecoaman.2020.105433.

[59]
Stegmann P, Daioglou V, Londo M, et al. 2022. Plastic futures and their CO2 emissions. Nature, 612: 272-276.

[60]
Sun H, Yang F, Guo W. 2024. Factors influencing hikers’ litter behavior in national park in China. Frontiers in Forests and Global Change, 6: 1277323. DOI: 10.3389/ffgc.2023.1277323.

[61]
Thompson R C, Swan S H, Moore C J, et al. 2009. Our plastic age. Philosophical Transactions of the Royal Society B: Biological Sciences, 364: 1973-1976.

[62]
United Nations Statistical Division, World Tourism Organization. 2008. International recommendations for tourism statistics 2008. https://unstats.un.org/unsd/publication/Seriesm/SeriesM_83rev1e.pdf#page=21. Viewed on 2023-11-10.

[63]
Veiga J M, Fleet D, Kinsey S, et al. 2016. Identifying sources of marine litter—TGML report: JRC technical reports of European commission. DOI: 10.2788/018068.

[64]
Wackernagel M, Schulz N B, Deumling D, et al. 2002. Tracking the ecological overshoot of the human economy. Proceedings of the National Academy of Sciences of the USA, 99: 9266-9271.

[65]
Wackernagel M, Rees W. 1998. Our ecological footprint: Reducing human impact on the earth. Philadelphia, USA: New Society Publishers.

[66]
Wang B, Li Y, 2021. Plastic bag usage and the policies: A case study of China. Waste Management, 126: 163-169.

DOI PMID

[67]
Wang Y, Bai J, Liu Z, et al. 2023a. Consequences of microplastics on global ecosystem structure and function. Reviews of Environmental Contamination and Toxicology, 261(1): 22. DOI: 10.5194/bg-2017-160-rc2.

[68]
Wang Z, Wang E, Yu Y. 2023b. Translating tourists’ satisfaction data into economic value of the national forest parks in China. Journal of Forest Research, 28(6): 397-406.

[69]
Xavier A F, Naveiro R M, Aoussat A, et al. 2017. Systematic literature review of eco-innovation models: Opportunities and recommendations for future research. Journal of Cleaner Production, 149: 1278-1302.

[70]
Yang L, Luo W, Zhao P, et al. 2021. Microplastics in the Koshi River, a remote alpine river crossing the Himalayas from China to Nepal. Environmental Pollution, 290: 118121. DOI: 10.1016/j.envpol.2021.118121.

[71]
Zhang J, Quoquab F, Mohammad J, 2023. What do we know about plastic pollution in coastal/marine tourism? Documenting its present research status from 1999 to 2022. SAGE Open, 13(4): 21582440231211706. DOI: 10.1177/21582440231211706.

[72]
Zhang L, Liu J, Xie Y, et al. 2021. Occurrence and removal of microplastics from wastewater treatment plants in a typical tourist city in China. Journal of Cleaner Production, 291: 125968. DOI: 10.1016/j.jclepro.2021.125968.

[73]
Zhao H, Wang X, Yu X, et al. 2024. Application of improved machine learning in large-scale investigation of plastic waste distribution in tourism intensive artificial coastlines. Environmental Pollution, 343: 124292. DOI: 10.1016/j.envpol.2024.124292.

Outlines

/