Impact of Human Activities on Ecosystem

Spatial Variability of Soil Salinization and Alkalization in the Northern Plain Irrigation Area of Yinchuan, Ningxia

  • NIU Zilu , 1 ,
  • SONG Chunling 2 ,
  • WANG Lei 1, 3 ,
  • QI Tuoye , 1, * ,
  • CHEN Maosheng 1 ,
  • JIANG Shuting 1 ,
  • ZHANG Li 1 ,
  • XU Lizhen 4 ,
  • LIU Jia 4
Expand
  • 1. School of Ecology and Environment, Ningxia University, Yinchuan 750021, China
  • 2. Rural Economics Institute, Ningxia Academy of Social Sciences, Yinchuan 750021, China
  • 3. Ningxia Yellow River Wetland Ecosystem National Positioning Observation and Research Station, Yinchuan 750021, China
  • 4. Huaqing Agricultural Co., Ltd, Beijing 100084, China
*QI Tuoye, E-mail:

NIU Zilu, E-mail:

Received date: 2024-05-22

  Accepted date: 2024-11-05

  Online published: 2025-01-21

Supported by

Key Research and Development Program of Ningxia Hui Autonomous Region(2022BEG03053)

National Key Research and Development Program of China(2921YFD1900600)

Innovation and Entrepreneurship Project for Returned Overseas Talents in Ningxia Hui Autonomous Region(Ningxia Human Resources and Social Security Office Notice No. 5, 2023)

Abstract

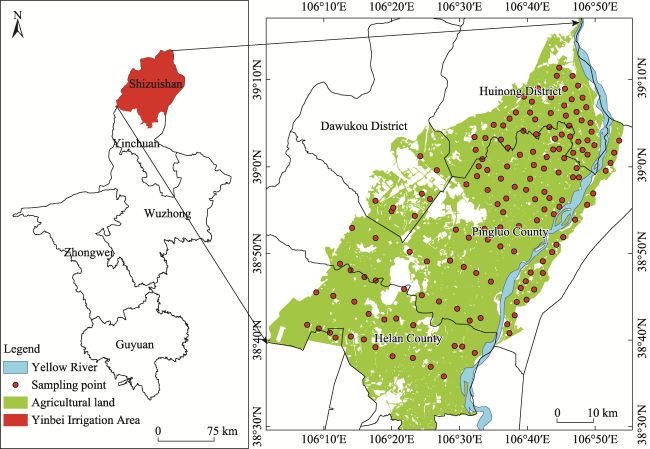
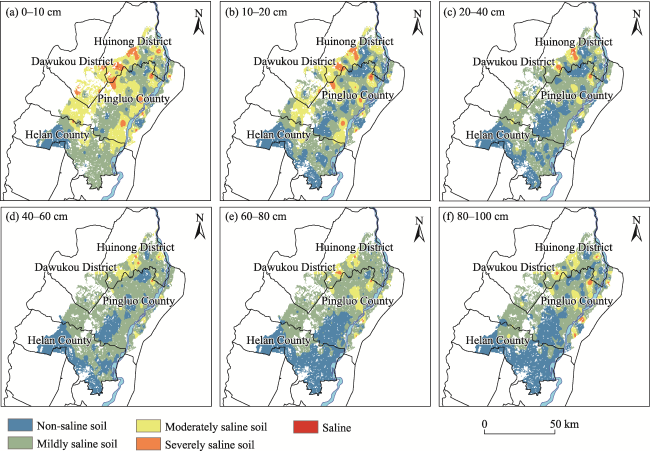
Soil salinization is a type of soil degradation phenomenon caused by the gradual accumulation of salt in soil due to natural processes or improper irrigation practices. Understanding the spatial variations of salinization is the basis for salinized land management and resource utilization. Taking Yinbei Plain irrigation area of Ningxia as the research area, 154 sampling points were set up and soil samples were collected at depths from 0-100 cm in six layers to determine the pH value and total salt content of the soil. Then geostatistics and GIS were used to study the spatial variations of soil pH and total salt content in the irrigation area. The results show three important aspects of this system. (1) The soil in the study area is alkaline soil with pH values ranging from 8.18 to 10.22, and the pH increases with increasing soil depth. The pH values of soil at 0-10 cm are significantly higher than at depths of 10-20 cm and 20-80 cm (P<0.05). The variation coefficients of the soil pH value in each layer are less than 10%, which is characterized as weak variability. The total salt content of soil decreases with increasing soil depth, ranging from 0.24 to 14.95 g kg-1. The total salt content of soil in the surface layer at 0-10 cm was significantly higher than in the lower soil layers (P<0.05). The coefficient of variation of total salt content showed moderate variability except at depths of 10-20 cm and 80-100 cm. Other layers have variabilities of more than 100%, indicating strong variability. (2) The semi-variance function fitting of pH and total salt showed that the soil pH value in each soil layer depth block base ratio ranged from 28.1% to 61.2%, which indicates a medium spatial correlation, and the spatial variability was mainly influenced by the joint action of human activities and natural factors. The total salt block base ratio of each soil layer ranged from 5.5% to 13.3%, which indicates strong spatial autocorrelation. The variation among soil samples is mainly caused by natural structural factors such as parent material, topography, soil and groundwater level. (3) Kriging interpolation was used to obtain the spatial distribution of soil pH values and total salt contents in the study area, and the results showed that the overall pH distribution was high on the eastern and western sides and low in the middle. The total salt distribution was patchy and uneven, and the saline soil was mainly distributed in the surface layer. As the depth increased, the total salt content declined, and the proportions of saline soil and severely salinized soil decreased. In the whole study area, mild salinized soil was the main category, the total salt content increased from south to north, and the profile characteristics of total salt content were mainly surface clustering. This study investigated the distribution and spatial heterogeneity of soil salinization in the Yinbei Irrigation Area, and provides theoretical guidance for the formulation of soil salinization control measures in this area.

Cite this article

NIU Zilu , SONG Chunling , WANG Lei , QI Tuoye , CHEN Maosheng , JIANG Shuting , ZHANG Li , XU Lizhen , LIU Jia . Spatial Variability of Soil Salinization and Alkalization in the Northern Plain Irrigation Area of Yinchuan, Ningxia[J]. Journal of Resources and Ecology, 2025 , 16(1) : 148 -158 . DOI: 10.5814/j.issn.1674-764x.2025.01.014

1 Introduction

Soil salinization is a process of soil degradation characterized by the gradual accumulation of salts, which can result from both natural processes and unsustainable irrigation practices. This phenomenon is prevalent in the inland arid regions of China (Zhang et al., 2020; Li et al., 2022). Soil salinization represents one of the primary drivers of land desertification and poses significant challenges to land resource utilization. Furthermore, elevated levels of soil salinity or alkalinity adversely affect plant growth, crop yields, and overall soil quality (Liu et al., 2021; Liu et al., 2022). Projections indicate that by 2050, approximately 50% of the world’s irrigated areas will be threatened by varying degrees of salinization (Singh et al., 2018). Studying the spatial variations in regional salinization characteristics can provide critical insights for informed decision-making regarding sustainable land development and strategies for preventing and mitigating soil salinization. Such efforts are essential for enhancing land use efficiency, preserving regional ecological security, and achieving sustainable development goals (Wang et al., 2017; Li et al., 2019).
Due to the variability of soil parameters, traditional statistical methods have limitations in analyzing spatial data, and the emergence of geostatistics has effectively addressed this issue. Geostatistics is a method that use the structural characteristics of raw data and semivariance functions to perform unbiased estimations of regionalized variables at future sampling points. Since this method fully considers spatial structural information such as the location, direction, and distance between sampling points, it reveals patterns that are difficult to detect using classical statistical methods, thereby facilitating the integration of patterns, scales, and process relationships and improving ecological theory and methods (Li et al., 2005; Zuo et al., 2022). In recent years, many scholars have conducted extensive research on the spatial variations of soil salinity using geostatistics. For example, Liu et al. (2017) applied geostatistical methods to analyze the semivariance function and spatial interpolation of characteristic soil salinity factors in the Chanan irrigation area of the Yili River Valley. They found that the spatial distributions of soil electrical conductivity and soil salinity content generally showed decreasing trends from northwest to southeast in the irrigation area. The soil salinity factors in the irrigation area had strong spatial correlation, and the spatial variation pattern was mainly the result of structural factors. Kumar et al. (2022) studied the spatial variability of soil salinity and nutrients in apple orchards and agricultural areas in the Kinnaur region of India, and provided an effective approach for sustainable crop production strategies. Wu et al. (2019) used ordinary Kriging and radial basis function methods to explore the spatial distribution characteristics of soil salinity in Alashan Left Banner, and they compared and analyzed the soil salinity spatial distribution and interpolation accuracy to obtain a suitable research method for evaluating the spatial variations of soil salinity in the study area. Hamid et al. (2011) combined geostatistics with GIS to explore the spatial variability of soil ions in the Ili River Valley region, which visually reflected the spatial variations of soil salinity ions in the study area. Wang et al. (2008) uesd the oasis in the Sangong River Basin of Xinjiang as the research object to study the spatial heterogeneity of soil salinity in the study area and found that terrain altitude was a key factor affecting the spatial variation of soil salinity. Zhang et al. (2018) used Kriging to study farmland soil in the Weibei region of Shaanxi Province and found that areas with higher soil salinity and alkalinity were distributed at the intersection of Linwei District, Fuping County, and Pucheng County, as well as in some areas of Dali County, The soil salinity content in the soil layer of Weibei farmland was most significantly affected by groundwater factors, followed by spatial factors and soil factors.
Most studies have focused solely on the distribution of a single soil layer, while neglecting the stratified salt distribution within the soil profile. The total salt content and pH value in the upper soil layer significantly influence its characteristics, thereby irectly affecting crop root development and plant growth. Furthermore, there is a lack of comprehensive research on the spatial variation of soil salinization in the Yinbei Irrigation Area. Consequently, this study employed geostatistics and GIS technology to analyze the spatial variability of soil salinization in Ningxia’s Yinbei Plain at various depths. The aim was to elucidate the current status of soil salinization and salt profile distribution in this region, thereby providing a theoretical foundation for addressing land salinization issues within the Yinbei Irrigation Area.

2 Materials and methods

2.1 Overview of the study area

As affected by regional soil texture, meteorological evaporation, irrigation and drainage conditions and other factors, the total area of saline alkali soil in the Yinchuan plain irrigation area is about 6.5 million mu, and it is the main area of saline alkali soil in China (Wang et al., 2021). The Yinchuan plain irrigation area has a planting history of more than 2000 years. However, the Yinbei Irrigation Area in the north of Yinchuan has flat and low-lying terrain, poor natural drainage capacity, and outdated and aging drainage projects in some areas, resulting in poor drainage in some areas that has led to serious land salinization (Rong et al., 2021), and serious soil salinization. Nearly half of the cultivated land has been affected by salinization to varying degrees. However, Yinbei Irrigation Area is a high-quality reserve cultivated land resource due to its flat terrain and deep soil layer (Zhang et al., 2013). Understanding the distribution and spatial heterogeneity of soil salinization in Yinbei Irrigation Area is of great significance for formulating measures to prevent soil salinization, thereby ensuring soil quality and improving agricultural production.
The Yinbei Irrigation Area is geographically situated from 38°26′45″N to 39°17′58″N, and from 106°01′45″E to 106°54′10″E. This region experiences limited rainfall, features a complex terrain structure, and suffers from inadequate drainage in most areas. In addition, the high groundwater level contributes to salinized farmland comprising over 50% of the total agricultural land. The escalating issues of soil salinization and alkalization pose significant challenges that severely restrict local agricultural production and economic development.
The scope of cultivated land in Yinbei Irrigation Area was extracted, and sampling points wree evenly arranged in the irrigation area, with an interval of 3 km. When the sampling points represented construction land, rivers, lakes and other waters, they were appropriately adjusted to the surrounding farmland. The sampling sites were mainly concentrated in the east of Huinong District, Pingluo County, Helan County and some areas of Dawukou, covering most of the agricultural land in the Yinbei Irrigation Area, including the east of the Yellow River, with a total area of 2585.42 km2 and 154 soil sampling points (Figure 1). Each sampling point was sampled with soil drills in six layers of 0-10 cm, 10-20 cm, 20-40 cm, 40-60 cm, 60-80 cm and 80-100 cm. The soil at each sample point was sampled at equal intervals of 10 m following a diagonal sampling method and three samples for the same layer were mixed. The sampling time was concentrated before the spring irrigation in early April 2022.
Figure 1 Study area and soil sampling sites

2.2 Soil property determination methods

Each collected soil sample was naturally air-dried, ground and sieved to prepare a 1:5 soil-water extract. The soil pH was determined using a Mettler portable multi-parameter tester (SG78). The methods for determining soluble ions refer to Soil Agrochemical Analysis (Bao, 2008) CO32- and HCO3- were determined by standard H2SO4 double neutralization titration. Ca2+, Mg2+, SO42- were determined by EDTA complex titration. Cl- was determined by standard AgNO3 titration. K+ and Na+ were determined by flame photometry. The total soil salt content was calculated as the sum of these eight major ions.

2.3 Data processing and analysis

The geostatistical software GS+9.0 was used for model fitting and semivariance model calculations. Excel and SPSS 25.0 were used for descriptive statistics and analysis of the data characteristics. The Kolmogorov-Smirnov (K-S) test was used to check the normality of the data distribution in SPSS 25.0, and one-way ANOVA was used for variance analysis. ArcGIS 10.6 software was used for distribution mapping and Kriging spatial interpolation methods.

3 Results analysis

3.1 Statistical analysis of soil pH and total salt content

The soil total salt content and pH are important indicators that characterize the degree of soil salinization and alkalization, respectively. The salinity and alkalinity indicators of the six soil layers from 154 sampling points in the northern plain irrigation area of Yinchuan were analyzed statistically (Tables 1 and 2). The soil pH range in the 0-100 cm depth in the northern plain irrigation area of Yinchuan spanned 8.18 to 10.22, indicating alkaline soil. The soil pH in the 0-10 cm layer was significantly lower than in the 10-20 cm layer (P<0.05), and the soil pH in the 10-20 cm layer was significantly lower than in the deeper layers (P<0.05). With increasing depth, the soil pH showed an upward trend that was stabilized below 20 cm. There were no significant differences in soil pH across the depths of 20-100 cm (P<0.05). The coefficient of variation (Cv) reflects the dispersion of the data. When Cv≤10%, it indicates weak variability; when 10%<Cv≤100%, it indicates moderate variability; and when Cv>100%, it indicates strong variability (Lei et al., 1985). The Cv values for soil pH at the various sampling depths were 2.2%, 2.4%, 2.7%, 3.2%, 3.5%, and 3.5%, respectively (Table 1), which were all less than 10%, indicating weak variability. This suggests that the spatial differences in soil pH within the study area are small, with weak dispersion and relatively uniform distribution.
Table 1 Statistical characteristics of soil pH at different depths
Depth (cm) Minimum Maximum Mean±Std Skewness Kurtosis Coefficient of variation (%) Distribution type
0-10 8.31 9.61 8.74±0.19c 0.70 2.33 2.2 N
10-20 8.37 9.62 8.83±0.21b 0.36 0.54 2.4 N
20-40 8.44 9.84 8.99±0.24a 0.90 1.72 2.7 N
40-60 8.34 10.16 9.04±0.29a 1.16 2.31 3.2 N
60-80 8.18 10.16 9.04±0.32a 0.86 2.19 3.5 N
80-100 8.34 10.22 9.04±0.32a 1.26 2.45 3.5 N

Note: The kurtosis and skewness are the logarithmic transformed values; Different letters in the same column indicate significant differences at the 0.05 level; N is normal distribution. The same notation is used in subsequent tables.

Table 2 Statistical characteristics of soil salinity at different depths
Depth (cm) Minimum (g kg-1) Maximum (g kg-1) Mean±Std (g kg-1) Skewness Kurtosis Coefficient of variation (%) Distribution type
0-10 0.42 14.95 2.24±2.46a 2.64 7.66 109.8 LN
10-20 0.38 10.33 1.77±1.72b 2.20 7.33 97.2 LN
20-40 0.30 12.12 1.52±1.78b 3.99 18.39 117.1 LN
40-60 0.31 10.97 1.52±1.69b 3.45 13.13 111.2 LN
60-80 0.24 12.03 1.53±1.60b 3.67 16.80 104.6 LN
80-100 0.32 10.85 1.54±1.50b 3.52 16.27 97.4 LN

Note: LN is logarithmic transformed normal distribution.

The total salt contents in the 0-100 cm soil layer within the Yinbei Irrigation Area range from 0.24 to 14.95 g kg-1, so the maximum value is 62 times the minimum value. There is strong spatial variation in soil salinity, and high salt content areas exist in some regions. In the vertical direction, the total salt content declines as the depth increases, and the salt contents in deep soil layers are lower than that in the surface 0-10 cm soil layer (P<0.05). However, there are no significant differences in soil salt content at depths below 10 cm (P<0.05). The coefficients of variation for the total salt contents in the 0-10, 20-40, 40-60 and 60-80 cm soil layers are 109.8%, 117.1%, 111.2%, and 104.6%, respectively, which are all greater than 100%, indicating high levels of variation. The coefficients of variation for the 10-20 cm and 80-100 cm soil layers are 97.2% and 97.4%, respectively, indicating moderate levels of variation. Overall, there is strong spatial variability in the total salt content, with significant differences in soil salinity among different sampling points.

3.2 Spatial variation of soil pH and total salt content

Satisfying the normal data distribution is a prerequisite for geostatistical spatial analysis, so the soil pH and total salt content data were subjected to K-S normality tests. The pH values of all soil layers met the normal distribution requirements, while the salt contents at different depths did not conform to a normal distribution. However, after logarithmic transformation, the soil salt content data exhibited a normal distribution, satisfying the requirements of geostatistics and eliminating potential proportional effects (Chen et al., 2019).
The spatial distributions of soil pH and salinity in the study area were fitted by selecting the optimal semi-variance function models. The results showed that the best-fitting model for the spatial distribution of the pH in each soil layer was the spherical model (Table 3), with determination coefficients (R2) ranging from 0.809 to 0.933, and all reaching significant levels. The nugget-to-sill ratio (Co/Sill) represents the degree of spatial variation and indicates the proportion of random components in the spatial variation structure. A Co/Sill value less than 25% indicates strong spatial auto-correlation of the variable; values between 25% and 75% indicate moderate spatial auto-correlation; and values greater than 75% indicate weak spatial correlation. A ratio close to 1 indicates constant variation throughout the scale (Zhang et al., 2014; Zhao et al., 2023). The nugget-to-sill ratios of pH in each soil layer were all within the range of 25% to 75%, indicating moderate spatial correlation. This suggests that the spatial variability of soil pH in the northern plain irrigation area of Yinchuan is jointly influenced by anthropogenic activities and natural factors.
Table 3 Semivariogram models for soil pH at different depths
Depth (cm) Model Nugget (C0) Sill (C0+C) C0/Sill (%) R2
0-10 Gaussian 0.026 0.043 60.5 0.900
10-20 Gaussian 0.030 0.049 61.2 0.933
20-40 Exponential 0.015 0.048 31.3 0.809
40-60 Gaussian 0.055 0.113 48.7 0.899
60-80 Spherical 0.060 0.117 51.3 0.886
80-100 Exponential 0.019 0.065 28.1 0.901
The best-fit models for soil total salt at depths of 0-10 cm and 20-40 cm were spherical models, while the best-fit models for depths of 10-20 cm and 80-100 cm were Gaussian models. For depths of 40-60 cm and 60-80 cm, the best-fit models were exponential models (Table 4). The determination coefficients ranged from 0.514 to 0.866, all indicating significant levels. The nugget-to-sill ratios for soil total salt at each depth were 5.6%, 4.9%, 5.5%, 10.7%, 6.5%, and 13.3%, so all were less than 25% indicating strong spatial auto-correlation. This suggests that natural structural factors such as soil parent material, terrain, and groundwater level contribute to the variation in soil total salt.
Table 4 Semivariogram models for soil salinity at different depths
Depth (cm) Model Nugget (C0) Sill (C0+C) C0/Sill (%) R2
0-10 Spherical 0.038 0.675 5.6 0.526
10-20 Gaussian 0.027 0.555 4.9 0.866
20-40 Spherical 0.028 0.513 5.5 0.632
40-60 Exponential 0.053 0.497 10.7 0.514
60-80 Exponential 0.029 0.449 6.5 0.615
80-100 Gaussian 0.059 0.445 13.3 0.556

3.3 Spatial distribution characteristics of soil pH and total salt content

Using the Geostatistical Analyst module in ArcGIS for Kriging spatial interpolation, the spatial distribution characteristics of sampling points within the study area were ana-lyzed to obtain spatial distribution maps of soil pH and total salt content in the study area. The reclassification tool in ArcGIS was then used to categorize the various grading situations. The area and proportion occupied by each layer of soil pH and total salt content were calculated by multiplying the number of pixels in each grade by the pixel size in the attribute table of the reclassification (Tables 5 and 6).
Table 5 Areas and proportions of different classes of soil pH at different depths
Depth
(cm)
pH<8.7 8.7≤pH<8.9 8.9≤pH<9.1 9.1≤pH≤9.3 pH>9.3
Area (km²) Percentage (%) Area (km²) Percentage (%) Area (km²) Percentage (%) Area (km²) Percentage (%) Area (km²) Percentage (%)
0-10 949.52 36.7 1635.90 63.3 0.00 0.0 0.00 0.0 0.00 0.0
10-20 125.21 4.8 2096.65 81.1 363.56 14.1 0.00 0.0 0.00 0.0
20-40 5.11 0.2 757.77 29.3 1418.61 54.9 340.76 13.2 63.17 2.4
40-60 0.00 0.0 426.73 16.5 1584.57 61.3 446.91 17.3 127.21 4.9
60-80 0.00 0.0 144.65 5.6 1735.95 67.1 616.24 23.8 88.58 3.5
80-100 3.49 0.1 413.03 16.0 1331.15 51.5 656.97 25.5 180.78 7.0
Table 6 Areas and proportions of different classes of soil salinity at different depths
Depth
(cm)
Non-saline soil Mildly saline soil Moderately salinized soil Severely-salinized soil Saline
Area (km²) Percentage (%) Area (km²) Percentage (%) Area (km²) Percentage (%) Area (km²) Percentage (%) Area (km²) Percentage (%)
0-10 250.80 14.1 1216.65 41.3 984.41 35.6 132.44 8.8 1.12 0.2
10-20 735.35 28.5 1161.33 44.9 614.86 23.7 73.01 2.8 0.87 0.1
20-40 832.53 32.1 1518.91 58.8 206.82 8.0 26.29 1.0 0.87 0.1
40-60 741.45 28.7 1644.50 63.7 192.62 7.4 6.85 0.2 0.00 0.0
60-80 924.98 42.1 1426.21 43.7 224.77 12.3 9.46 1.9 0.00 0.0
80-100 1050.57 40.6 1267.48 49.0 247.44 9.6 19.94 0.8 0.00 0.0
The soil pH was graded with a 0.2 interval, and the interpolation results are shown in Figure 2. The soil pH distributions in the 0-10 cm and 10-20 cm soil layers are relatively uniform, with pH <8.9 being the dominant value. The 20 cm depth soil layer exhibits higher pH values, primarily concentrated along the Yellow River coast in the eastern part of Pingluo County, the boundary between Dawukou District and Pingluo County, and some areas of Helan County. Overall, the spatial distribution pattern is characterized by higher pH values on the east and west sides and lower values in the middle. In the vertical direction, as the soil depth increases, the soil pH tends to increase, with significantly high values observed in the deep soil layers.
Figure 2 Spatial distribution of soil pH at different depths
The areas and proportions of each pH grade after reclassification are shown in Table 5. The pH values of the upper 0-20 cm soil layer are all below 9.1, with a proportion of 0 for pH >9.1. As the soil depth increases, the proportion of pH >9.3 increases, rising from 0.0% in the upper layer to 7.0% in the 80-100 cm layer. The proportion of pH values ranging from 9.1-9.3 increases to 25.5%, while the proportions of pH <8.7 and 8.7-8.9 decrease from 36.7% and 63.3% in the 0-10 cm layer to 0.1% and 16.0% in the 80-100 cm layer, respectively. In the upper 0-20 cm soil layer, the pH values are mainly between 8.7 and 8.9, while in the lower 20-100 cm soil layer, the pH values are mostly between 8.9 and 9.1. Overall, the main pH range in the northern plain irrigation area of Yinchuan is 8.9-9.1, indicating alkaline soil conditions.
Based on the total salt content, the soil in the study area was classified as follows: non-salinized soil with a total salt content of less than or equal to 1 g kg-1, lightly salinized soil with a total salt content between 1 g kg-1 and 2 g kg-1, moderately salinized soil with a total salt content between 2 g kg-1 and 4 g kg-1, severely salinized soil with a total salt content between 4 g kg-1 and 10 g kg-1, and saline soil with a total salt content of greater than 10 g kg-1 (Wang et al., 1993).
As shown in Figure 3, the distribution of total salt content in the soil exhibits a distinctively patchy pattern, with significantly high-value areas and uneven spatial distribution, indicating strong variability. The high-value areas of soil total salt are mainly distributed in Huinong District and Dawukou District in the northern part of the study area, as well as some areas in Pingluo County. Spatially, there is an increasing trend from south to north. In the vertical profiles, the soil total salt content declines with increasing soil depth.
Figure 3 Spatial distribution of soil salinity at different depths
As shown in Table 6, the proportion of saline soil is highest in the 0-10 cm depth, with an area of 1.12 km² and a proportion of 0.2%. The occurrence of saline soil at other depths is relatively rare, with all proportions below 0.1%. There is no saline soil below the depth of 40 cm. Similarly, severely saline soil has the highest proportion at a depth of 0-10 cm, with an area of 132.44 km² and a proportion of 8.8%. Its distribution is similar to that of saline soil, but it is distributed at all soil depths. The areas occupied by moderately saline soil in the 0-10 cm and 10-20 cm depths are 984.41 km² and 614.86 km², respectively, accounting for 35.6% and 23.7%, respectively. As the depth increases, the area occupied gradually decreases, accounting for only 9.6% in the 80-100 cm soil layer. Mildly saline soil accounts for more than 40% at all depths and is the most widely distributed type of soil in the entire study area. Non-saline soil is mainly distributed in the southern part of the study area and has the smallest proportion at the surface layer, with only 250.80 km² and a proportion of 14.1%. As the depth increases, the total salt content of the soil gradually declines, and the area of non-saline soil also gradually increases, accounting for 42.1% and 40.6% in the 60-80 cm and 80-100 cm soil layers, respectively. In summary, the main types of salinized soil in the study area are mildly salinized soil and moderately salinized soil.

3.4 The total soil salt content profile

The distribution of soil salinity in the profile is known as the soil salinity profile, and its characteristics comprehensively reflect the results of climate, terrain, and anthropogenic factors acting on salt transport (Yao and Yang, 2007). Based on the characteristics of the soil salinity distribution in the vertical profile, the soil profile can be divided into three types: surface soil salt, which has a higher total salt content due to the upward migration of salinity, and other layers that are significantly lower than this layer can be considered as surface-concentrated profiles; profiles where the total salt content of the soil at the bottom depth is significantly higher than that of the surface soil can be considered bottom-concentrated profiles; and average profiles refer to profile types with little difference in soil salinity throughout the profile (Yao et al., 2008).
Referencing the statistical characteristics of soil salinity data used for classification by Zou et al. (2017) and Liu et al. (2019), this study classified profiles with total salt content in the surface layer (0-20 cm) higher than in the bottom layer (80-100 cm) as surface-concentrated profiles; profiles with total salt content in the bottom layer (80-100 cm) higher than in the surface layer (0-20 cm) as bottom-concentrated profiles, and any others as average profiles. Based on the discriminant criteria for these different types of salinity profiles, the spatial interpolation results of salt contents in the different soil layers were superimposed and graded. The results showed that a difference between soil salinity in the 0-20 cm and 80-100 cm soil layers greater than 0.4 g kg-1 indicates a surface-concentrated profile type, while a difference less than -0.2 g kg-1 indicates a bottom-concentrated profile type, and a difference between -0.2 and 0.4 g kg-1 indicates an average profile type. The spatial distribution of soil profile types in the irrigation area of the northern plain irrigation area of Yinchuan is shown in Figure 4.
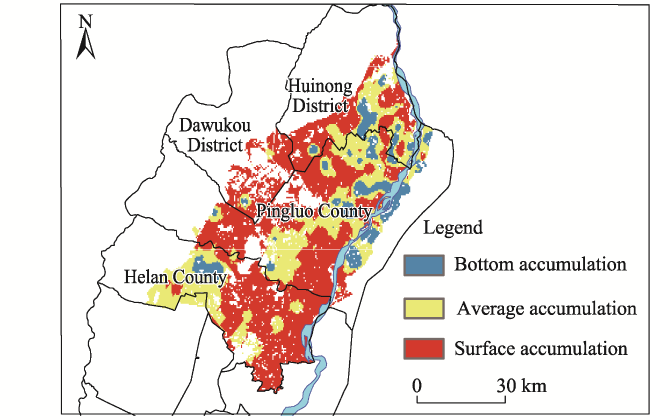
Figure 4 Spatial distribution of different salinity profile types
The salt profiles within the northern plain irrigation area of Yinchuan are mainly of the surface-accumulated type, which is the most widely distributed type in the study area, accounting for 58.7% (Table 7). The average type accounts for 31.9%, while the bottom-accumulated type accounts for the smallest proportion, of only 9.4%. It is mainly distributed along the Yellow River in the eastern part of Pingluo Country. From a spatial perspective, the distribution of surface-accumulated profiles occupies most of the northern plain irrigation area of Yinchuan, and it is distributed from south to north. The bottom-accumulated profiles are mainly distributed along the Yellow River in the eastern part of the northern plain irrigation area of Yinchuan and the northern part of the area. The average type profiles are mainly distributed in the central part of the northern plain irrigation area of Yinchuan.
Table 7 Areas and proportions of the different salinity profiles
Type Surface
accumulation
Bottom
accumulation
Average
accumulation
Area (km²) 1518.17 241.58 825.67
Percentage (%) 58.7 9.4 31.9

4 Discussion

The spatial distribution of soil salinity in the northern plain irrigation area of Yinchuan shows great heterogeneity, and there are varying degrees of salinization in each soil layer. The sampling time of this study was before the spring irrigation in early April, which was during the soil salt return period. Continuous evaporation, coupled with the high groundwater level in most areas of the northern plain irrigation area of Yinchuan, causes salinity to continuously migrate upward through soil capillaries, thus forming a surface-accumulated profile with high salinity at the surface and low salinity at the bottom (Zhang et al., 2011). This type of profile occupies most of the northern plain irrigation area of Yinchuan. However, the upward migration of salinity is slower or does not occur in a few areas, resulting in average and bottom-accumulated profiles. This is consistent with the research of Wang et al. (2022), which indicated that during the soil salt return period, a large amount of salt will migrate upward due to evaporation. Therefore, appropriate increases in irrigation water volume during spring irrigation can enhance the effect of salt washing and drainage. Since the soil surface is infiltrated by air and water, the pH level is relatively low, while the pH of the deep soil is closer to that of the groundwater. As the soil moisture increases, the pH gradually increases, forming a high-value area at the bottom, and resulting in an increase in soil pH with soil depth. Guo et al. (2021) studied the soil salinity and pH in the northern plain irrigation area of Yinchuan and found that soil salinity exhibits strong spatial variability, while pH exhibits weak spatial variability with small differences. Those findings are consistent with the results of this study. The soil salinization in the northern plain irrigation area of Yinchuan is severe, and the high-value areas of soil pH are obvious, so they should be the focus of subsequent management efforts. In contrast, the distribution of high-value soil salinity is relatively scattered and concentrated at the surface, with gradually decreasing variability in the lower soil layers. This may be due to differences in the depth of groundwater in different regions, which should be considered in subsequent management efforts.
Zhang et al. (2009) reported that saline-alkali soil is mainly distributed in low-lying areas that have a shallow groundwater depth, high mineralization, and poor drainage. The low and flat terrain, extensive irrigation with Yellow River water, and poor drainage capacity of the northern plain irrigation area of Yinchuan has led to widespread soil salinization, which is consistent with their research results. This study found that high soil salinity values are mainly distributed in the northern part of the study area, which is also consistent with their research in the Yinchuan Plain. Yong et al. (2024) studied soil salinization in the Ulan Buh Desert along the Yellow River downstream of the Yinbei Plain Irrigation Area, and found that the high and low terrain of the study area, as well as the introduction of Yellow River water for irrigation, led to an increase in soil salt content, which is consistent with the causes of soil salinization in the Yinbei Plain irrigation area. Huang et al. (2008) found that the misguided development of rice cultivation in the early years of the northern plain irrigation area of Yinchuan, coupled with inadequate drainage facilities, resulted in poor drainage and a significant increase in the area of salinization. In addition, the northern plain irrigation area of Yinchuan has long relied on irrigation with Yellow River water, and the TDS (total dissolved solids) concentration of the Yellow River water is about 0.4 g L-1 (Jin et al., 2012). Long-term flooding irrigation has led to the entry of irrigation water but not its exit, so large amounts of salt cannot be discharged. In addition, the groundwater depth in the northern plain irrigation area of Yinchuan is relatively shallow (Zhai et al., 2021), and strong evaporation leads to the widespread accumulation of soluble salts in the soil surface, making the soil salinization problem more severe. Li et al. (2018) suggested that without changing the structure of water resource development, reallocating land use alone cannot solve the problem of soil salinization. The method of irrigation that combines surface water with groundwater can alleviate soil salinization by lowering the groundwater level, reducing the accumulation of salts in the root zone, and thus mitigating local soil salinization. This method has practical significance for the northern plain irrigation area of Yinchuan. Wei et al. (2023) found that the intensity of land use in the irrigation areas of the Yinchuan Plain is the main factor influencing soil salinization in the Yinchuan Plain. The mineralization and depth of groundwater also have significant impacts on soil salinization. Shi et al. (2020) also pointed out that formulating a reasonable irrigation system and controlling the depth of groundwater can effectively reduce soil salt accumulation, prevent plant salt damage, and increase water use efficiency.
This study selected the soil pH and salt content in the Yinbei Irrigation Area to represent the overall situation of soil salinization in the northern plain irrigation area of Yinchuan. The studies discussed above all pointed out that the problem of soil salinization is a water-related issue. Therefore, the fundamental measures for the prevention and control of soil salinization in the Yinbei Irrigation Area should be optimizing the planting structure of crops, controlling the depth of buried groundwater, increasing the amount of irrigation water for salt pressing and salt washing during spring irrigation, and improving the irrigation and drainage system and anti-seepage measures. For areas with serious soil salinization near the Sand Lake, appropriate amounts of organic fertilizer and mineral fertilizer can also be applied to improve the soil structure, increase the soil water conservation and fertilizer supply capacity to reduce the degree of soil salinization, or crops with strong salt and alkali tolerance can be selected for soil quality improvement, which will improve the soil structure and salinization through absorption and secretion by roots (Li et al., 2018). Furthermore, biochar can also be added to increase soil porosity, which can improve soil quality, increase available nutrients in soil while improving saline soil, and improve nutrient absorption and utilization by crops (Zhu et al., 2020). Currently, after years of improvement and governance, the degree of soil salinization in the northern plain irrigation area of Yinchuan has generally declined (Wang et al., 2021; Gao, 2022), but there is still a risk that it could rebound. Therefore, it is necessary to monitor soil salinization and establish a comprehensive and improved early warning system.
Soil salinization is influenced to a certain extent by environmental factors, including climate, topography, geomorphology, and land use types, as well as human activities. These factors contribute to an unclear pattern of variation in the total salt content of the soil (Wang et al., 2018). This study specifically examined the variations in soil salinization in the northern plain irrigation area of Yinchuan prior to spring irrigation. At this stage, soil salinity reaches its annual peak, so it only reflects the maximum value of soil salinity without accounting for seasonal dynamics or the underlying driving factors. Addressing these aspects will be the focus of subsequent research.

5 Conclusions

This study conducted a sampling survey in a typical area of the Yinbei Irrigation Area and drew three main conclusions.
(1) The soil total salt contents in the northern plain irrigation area of Yinchuan range from 0.24 to 14.95 g kg-1, so it spans a large range. The coefficient of variation of soil total salt in each soil layer is greater than 90%, which indicates moderate-to-strong variability. There are high-value areas of total salt in some local areas, and there are significant spatial differences in soil salinity content among different sampling points. In the vertical direction, the total salt content declines with increasing depth, and the total salt content of deep soil is significantly lower than that of the surface layer. The ratio of the total salt block base in each soil layer shows strong spatial auto-correlation, and the variations of soil total salt are mainly caused by structural factors such as terrain and groundwater level.
(2) The soil pH values in the northern plain irrigation area of Yinchuan range from 8.18 to 10.22, and the soil in each layer is alkaline overall. The coefficient of variation is less than 10%, indicating weak variability. The change in the vertical direction is the opposite of the total salt content: as the soil depth increases, the pH value rises, and high values exist in the deep soil. The ratio of the soil pH value block base at each depth is less than 25%, and its spatial variability is mainly affected by both human activities and natural factors.
(3) From the perspective of spatial distribution, the distribution of soil pH values is relatively uniform compared with the distribution of total salt levels. High values are mainly concentrated along the Yellow River coast, near the Shahu Lake, and in some areas of Helan County. The overall spatial distribution of pH values is high on the east and west sides and low in the middle. The high values of total salt content are mainly distributed in the surface soil and concentrated in the northern part of the northern plain irrigation area of Yinchuan. Spatially, the salt content shows a trend of increasing from south to north. The soil salinity profile is mainly surface-concentrated, which occupies most areas of the northern plain irrigation area of Yinchuan. The main type of salinization in the northern plain irrigation area of Yinchuan is mild salinization soil, but soil salinization is still severe in some areas, so research, treatment, and improvement should be strengthened.
[1]
Bao S D. 2008. Agrochemical analysis of soil. Beijing, China: Chinese Agricultural Press. (in Chinese)

[2]
Chen X X, Zhang J H, Cai R J F, et al. 2019. Study on spatial variability of soil salinity in arid area of southern Xinjiang: A case study on 31th Regiment of Korla. Journal of Irrigation and Drainage, 38(9): 108-114. (in Chinese)

[3]
Gao S. 2022. Effects of comprehensive agronomic improvement measures on salinity characteristics of saline-alkali land in northern Yinchuan. Journal of Agricultural Sciences, 43(3): 40-44. (in Chinese)

[4]
Guo J C, Wang M G, Geng R, et al. 2021. Salinity characteristics analysis of saline alkali soil in Yinbei Irrigation Area of Ningxia. Chinese Agricultural Science Bulletin, 37(5): 38-42. (in Chinese)

[5]
Hamid Y, Mihrigul M Gulnar T, et al. 2011. Spatial variability of soil salinity ions in the saline area of the Yili River Basin. Agricultural Research in the Arid Areas, 29(1): 64-69. (in Chinese)

[6]
Huang J C, Chen G D, Li P. 2008. Present situation and improvement of soil salinity in directly Yellow-Irrigated Areas of Ningxia. Research of Soil and Water Conservation, 15(6): 256-258. (in Chinese)

[7]
Jin X M, Vekerdy Z, Zhang Y K, et al. 2012. Soil salt content and its relationship with crops and groundwater depth in the Yinchuan Plain, China, using remote sensing. Arid Land Research and Management, 26(3): 227-235. (in Chinese)

[8]
Kumar P, Kumar P, Sharma M et al. 2022. Spatial variability of soil nutrients in apple orchards and agricultural areas in Kinnaur Region of cold desert, Trans-Himalaya, India. Environmental Monitoring and Assessment, 194(4): 290-290.

DOI PMID

[9]
Lei Z D, Yang S X, Xu Z R, et al. 1985. Preliminary investigation of the spatial variability of soil properties. Journal of Hydraulic Engineering, (9): 10-21.. (in Chinese)

[10]
Li L L, Yi Y L, Ling G X, et al. 2005. Utilization of geostatistics in soil spatial variability. Chinese Journal of Soil Science, 36(2): 265-268. (in Chinese)

[11]
Li P Y, Qian H, Wu J H, et al. 2018. Conjunctive use of groundwater and surface water to reduce soil salinization in the Yinchuan Plain, North-West China. International Journal of Water Resources Development, 34(3): 337-353.

[12]
Li X Y, Wang F, Wang Z. 2022. Present situation and development trend of remote sensing monitoring model for soil salinization. Remote Sensing for Natural Resources, 34(4): 11-21. (in Chinese)

[13]
Li Z, Li Y, Xing A, et al. 2019. Spatial prediction of soil salinity in a semiarid oasis: Environmental sensitive variable selection and model comparison. Chinese Geographical Science, 29(5): 784-797.

[14]
Li P, Hui Q, Wu J H, et al. 2018. Conjunctive use of groundwater and surface water to reduce soil salinization in the Yinchuan Plain, North-West China. International Journal of Water Resources Development. 34(3): 337-353.

[15]
Liu F Q, Du C, Han X, et al. 2022. Spatiotemporal variation in soil salinization in Daqing calculated using the 3S technology. Journal of Irrigation and Drainage, 41(5): 132-138. (in Chinese)

[16]
Liu H B, Ding B X, Bai Y G, et al. 2021. Spatial distribution characteristics of soil salinity in an oasis of typical arid regions in spring. Chinese Journal of Soil Science, 52(2): 279-285. (in Chinese)

[17]
Liu Q Q, Su LT, Liu G G, et al. 2017. Spatial variation of soil salinity in the Chanan irrigated area in the Ili River Valley. Arid Zone Research, 34(5): 980-985. (in Chinese)

[18]
Liu Y Q, Wang L, Zhao X N, et al. 2019. Spatial variability of soil salinization in a typical irrigation district of the Hetao Plain in Ningxia. Chinese Journal of Soil Science, 50(6): 1269-1277. (in Chinese)

[19]
Rong Z, Wang S L, Hao R X, et al. 2021. Permeability and anti-clogging performance of geotextile envelope material around subsurface drainage pipe in Yinbei Irrigation Area in Ningxia. Transactions of the Chinese Society of Agricultural Engineering, 37(8): 68-75. (in Chinese)

[20]
Shi H B, Guo J W, Zhou H, et al. 2020. Effects of irrigation amounts and groundwater regulation on soil water and salt distribution in arid region. Transactions of the Chinese Society of Agricultural Machinery, 51(4): 268-278. (in Chinese)

[21]
Singh V, Singh A P, Bhadoria J, et al. 2018. Differential expression of salt-responsive genes to salinity stress in salt-tolerant and saltsensitive rice (Oryza sativa L.) at seedling stage. Protoplas-ma, 255(6): 1667-1681.

[22]
Wang B, Yang S Q, Yuan H Y, et al. 2022. Spatial variability and seasonal distribution of surface soil salinity in Wulate irrigation area. Soil and Fertilizer Science in China, (4): 29-36.. (in Chinese)

[23]
Wang J T, Chang B H, Li Q K. 2021. The development process and driving mechanism of soil salinization in Hetao Irrigation District. Proceedings of the 2021 academic annual meeting of China Water Conservancy Society. Beijing, China: China Water Conservancy Society. (in Chinese)

[24]
Wang Q H, Lu Y D, Sai J M et al. 2018. Characteristics of soil salinity in arid oasis. Arid Zone Research, 35(3): 503-509. (in Chinese)

[25]
Wang Y G, Li Y, Xiao D N. 2008. Catchment scale spatial variability of soil salt content in agricultural oasis, Northwest China. Environmental Geology, 6(2): 439-446.

[26]
Wang Z Q, Zhu S Q, Yu R P. 1993. Chinese saline soil. Beijing, China: Science Press. (in Chinese)

[27]
Wang Z R, Zhao G X, Gao M X, et al. 2017. Spatial variability of soil salinity in coastal saline soil at different scales in the Yellow River Delta, China. Environmental Monitoring and Assessment, 189(2): 80. DOI: 10.1007/s10661-017-5777-x.

PMID

[28]
Wei H M, Jia K L, Zhang X. 2023. Spatio-temporal characteristics and driving factors of soil salinization in Yinchuan Plain from 2008 to 2020. Journal of Tianjin Normal University (Natural Science Edition), 43(3): 46-52. (in Chinese)

[29]
Wu Y K, Li J B, Gao H C, et al. 2019. Study on spatial variability of soil salinity in Alxa Zuoqi. Soils, 51(5): 1030-1035. (in Chinese)

[30]
Yao R J, Yang J S. 2007. Analysis on salinity characteristics and profile types of saline soils in the Yellow River Delta. Journal of Arid Land Resources and Environment, 21(11): 106-112. (in Chinese)

[31]
Yao R J, Yang J S, Jiang L, et al. 2008. Profile characteristics and spatial distribution of soil salinity based on hierarchical cluster analysis. Acta Pedologica Sinica, 45(1): 56-65. (in Chinese)

[32]
Yong T, Zhang J X, Chen L J, et al. 2024. Characteristics of soil water and salt spatial differentiation along the Yellow River section of Ulan Buh Desert and its causes. Chinese Desert, 44(3): 247-258. (in Chinese)

[33]
Zhai J Q, Cao J P, Liu K, et al. 2021. Evolutionary change in groundwater table in Qingtongxia irrigation district and its determinants. Journal of Irrigation and Drainage, 40(9): 102-110. (in Chinese)

[34]
Zhang C, Chen H S, Zhang W, et al. 2014. Spatial variation characteristics of surface soil water content, bulk density and saturated hydraulic conductivity on Karst. Chinese Journal of Applied Ecology, 25(6): 1585-1591. (in Chinese)

[35]
Zhang J H, Qin J Q, Li M. 2013. Prediction of soil salt content based on spectral characteristics of soil in northern Yinchuan city, Ningxia Hui Autonomous Region. Bulletin of Soil and Water Conservation, 33(5): 123-129, 164. (in Chinese)

[36]
Zhang M M, Su Y P, W P, et al. 2011. Using HJ-I satellite remote sensing data to surveying the Saline soil distribution in Yinchuan Plain of China. African Journal of Agricultural Research, (6): 6592-6597.

[37]
Zhang R R, Fan H M, Guo J Y, et al. 2018. Spatial distribution of farmland soil salinization and its influencing factors in Weibei area of Shaanxi Province. Acta Agriculturae Boreali-Occidentalis Sinica, 27(3): 440-450. (in Chinese)

[38]
Zhang X G Huang B, Liu F. 2020. Information extraction and dynamic evaluation of soil salinization with a remote sensing method in a typical county on the Huang-Huai-Hai Plain of China. Pedosphere, 30(4): 496-507.

[39]
Zhang Y P, Hu K L, Li B G, et al. 2009. Spatial distribution pattern of soil salinity and saline soil in Yinchuan plain of China. Transactions of the Chinese Society of Agricultural Engineering, 25(7): 19-24. (in Chinese)

[40]
Zhao Y, Shi H B, Miao Q F, et al. 2023. Analysis of spatial and temporal variability and coupling relationship of soil water and salt in cultivated and wasteland at branch canal scale in the Hetao Irrigation District. Agronomy, 13(9): 2367. DOI: 10.3390/agronomy13092367.

[41]
Zhu H, Yang J S, Yao R J, et al. 2020. Interactive effects of soil amendments (biochar and gypsum) and salinity on ammonia volatilization in coastal saline soil. Catena, 190: 104527. DOI: 10.1016/j.catena.2020.104527.

[42]
Zou X X, Wang W H, Wang J L, et al. 2017. Time-spatial revolution characteristics of soil salinity in the Yellow River delta under different land cultivation and natural conditions. Journal of Soil and Water Conservation, 31(2): 309-316. (in Chinese)

[43]
Zuo X H, Lai J X, Liu F, et al. 2022. Spatial heterogeneity and zoning of soil organic matter based on geostatistics and spatial autocorrelation: A perspective from land consolidation. Chinese Journal of Agricultural Resources and Regional Planning, 43(3): 240-252. (in Chinese)

Outlines

/