Special Column: Resources and Ecology of the Mongolian Plateau

Spatiotemporal Distribution Characteristics of Actual Evapotranspiration over Long-term Changes on the Mongolian Plateau

  • SU Yuhui , 1, 2 ,
  • WANG Juanle 2, 3 ,
  • HAN Baomin , 1, * ,
  • Ochir ALTANSUKH 4 ,
  • Davaadorj DAVAASUREN 5
Expand
  • 1. School of Civil engineering and geomatics, Shandong University of Technology, Zibo, Shandong 255049, China
  • 2. State Key Laboratory of Resources and Environmental Information System, Institute of Geographic Sciences and Natural Resources Research, Chinese Academy of Sciences, Beijing 100101, China
  • 3. Jiangsu Center for Collaborative Innovation in Geographical Information Resource Development and Application, Nanjing 210023, China
  • 4. Department of Environment and Forest Engineering, School of Engineering and Technology and Environmental engineering laboratory, National University of Mongolia, Ulaanbaatar 14201, Mongolia
  • 5. Department of Geography, School of Art and Sciences, National University of Mongolia, Ulaanbaatar 14201, Mongolia
*HAN Baomin, E-mail:

SU Yuhui, E-mail:

Received date: 2024-01-12

  Accepted date: 2024-05-20

  Online published: 2025-01-21

Supported by

National Natural Science Foundation of China(32161143025)

Science & Technology Fundamental Resources Investigation Program of China(2022FY101905)

National Key R&D Program of China(2022YFE0119200)

Mongolian Foundation for Science and Technology(NSFC_2022/01)

Mongolian Foundation for Science and Technology(CHN2022/276)

Key R&D and Achievement Transformation Plan Project in Inner Mongolia Autonomous Region(2023KJHZ0027)

Key Project of Innovation LREIS(KPI006)

Construction Project of China Knowledge Center for Engineering Sciences and Technology(CKCEST-2023-1-5)

Abstract

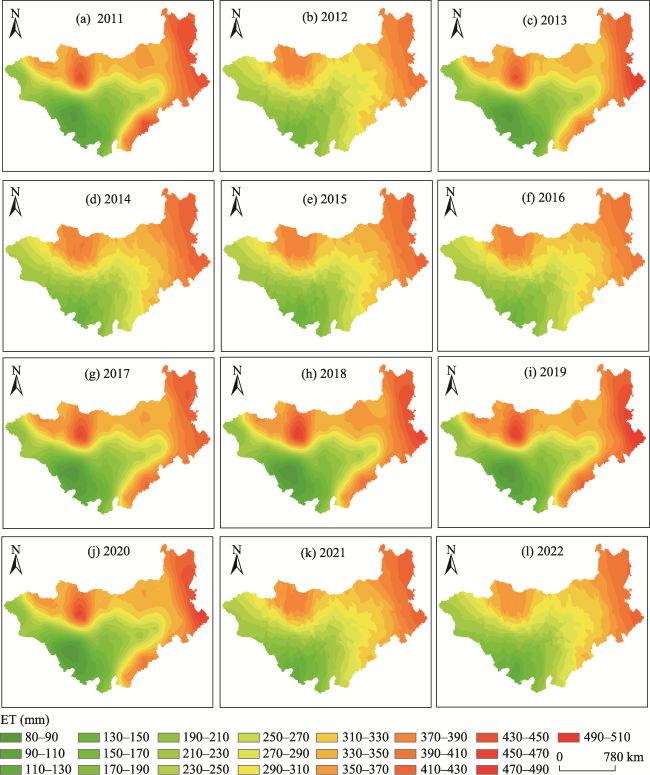
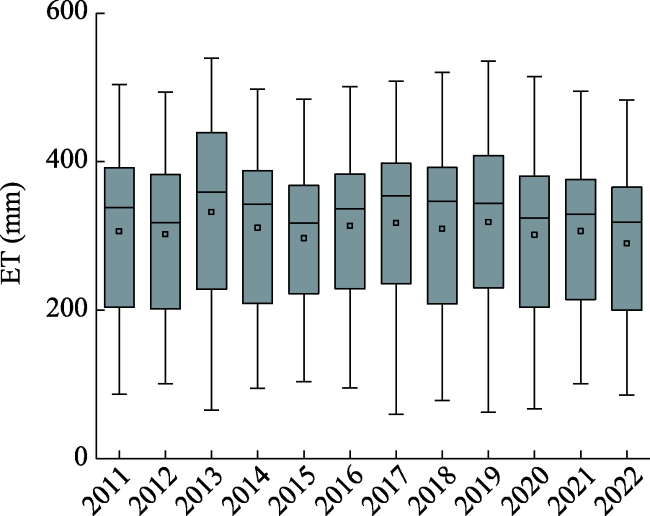
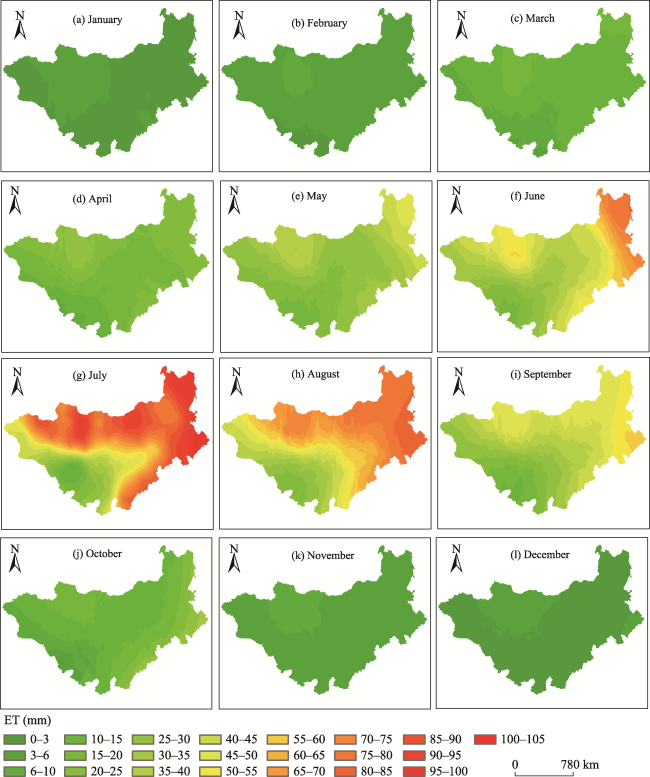
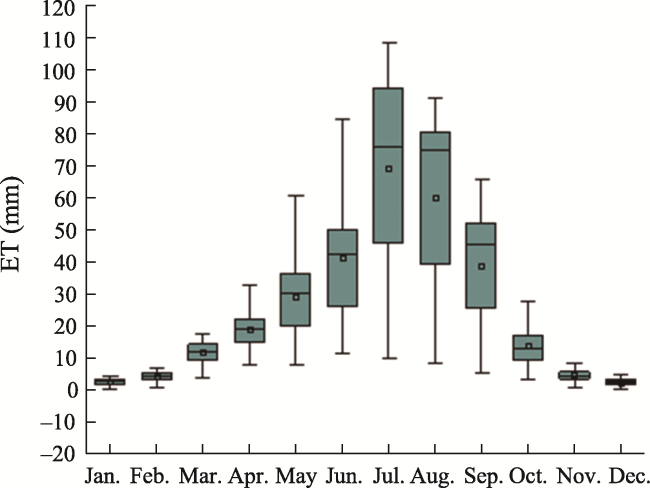
Evapotranspiration (ET) is of great significance for the ecological environment and water resource utilization in arid and semi-arid regions. The Mongolian Plateau, owing to drought, low rainfall, and extremely uneven distribution of water resources, has a typical temperate continental climate. A refined understanding of the spatiotemporal distribution of ET in this region will help in establishing regulatory strategies for climate change responses, regional livestock regulation, and grassland degradation suppression. In this study, meteorological station data, precipitation data, and the Penman-Monteith model were used to study the temporal and spatial distribution characteristics of actual ET over the Mongolian Plateau from 2011 to 2022. Results found that: (1) The spatial distribution of ET in the Mongolian Plateau showed a high trend in the north and east and a low trend in the middle and south. There was a significant difference in the regional annual ET, with the highest ET reaching over 500 mm and the lowest being only approximately 70 mm. (2) The annual ET values in 2013, 2018, and 2019 were relatively large, varying between 80 and 500 mm, and the overall ET of the Mongolian Plateau first decreased, then increased, and then decreased. (3) The temporal distribution exhibits a unimodal trend of increasing and then decreasing, with July being the turning point. May-September was a period of high ET, with the highest ET exceeding 100 mm. When vegetation coverage was high, precipitation was abundant, and the vegetation ET effect was strong. Winter was a period of low ET, with a maximum ET of approximately 10 mm in January and December; the ET for the month with the lowest value was approximately zero. The quantitative inversion method proposed in this study can provide method and data support for north and central Asia, and other large arid and semi-arid areas.

Cite this article

SU Yuhui , WANG Juanle , HAN Baomin , Ochir ALTANSUKH , Davaadorj DAVAASUREN . Spatiotemporal Distribution Characteristics of Actual Evapotranspiration over Long-term Changes on the Mongolian Plateau[J]. Journal of Resources and Ecology, 2025 , 16(1) : 11 -21 . DOI: 10.5814/j.issn.1674-764x.2025.01.002

1 Introduction

Evapotranspiration (ET) refers to the total water vapor flux transported from the surface soil and vegetation to the atmosphere, including soil moisture evaporation and transpiration of water via vegetation (Ersi et al., 2022). As an essential component of the water and heat balances, ET is an important ecological and hydrological process that connects water, energy, and carbon cycling in terrestrial ecosystems, especially in arid and semi-arid regions (Zhang et al., 2012a). It is the most important expenditure item in the water balance of terrestrial ecosystems. Approximately 70% of global surface precipitation returns to the atmosphere through ET, with over 90% occurring in arid regions (Shi et al., 2022). Owing to the scarcity of water resources in arid and semi-arid regions, and often due to terrain, the climate, and other factors, the effect of ET is strong. This not only affects the amount of runoff and replenishment precipitation, but also affects processes such as plant productivity, soil respiration, and biogeochemical cycling (Kurc and Small, 2004).
The main surface cover in arid and semi-arid areas is grassland, which can tolerate limited-water conditions. As an important resource for animal husbandry, grasslands are a significant part of the agricultural sector (Rjili et al., 2023) and are closely related to the livelihoods of residents and sustainable development. ET plays an important role in the grassland water cycle, and is the main factor affecting the water and energy balance of grassland ecosystems (Chang et al., 2016). Calculating the actual ET of grasslands and studying their spatiotemporal distribution characteristics can help us to understand the law of grassland water dissipation and provide an important basis for water resource regulation (Zheng et al., 2013).
The Mongolian Plateau has a temperate continental climate, with most of the area comprising grassland or bare land. Grasslands cover an area of approximately 2.0156×10⁶ km2, including 1.1356×10⁶ km2 in Mongolia and 0.88×10⁶ km2 in the Inner Mongolia Autonomous Region. It is an important component of the global grassland ecosystem (Zhao et al., 2015) and is the largest and most continuous terrestrial ecosystem in Eurasia (Dong et al., 2019). The Mongolian Plateau is one of the three main grazing grassland animal husbandry regions worldwide (Neely et al., 2009). 146.8 million heads of livestock were raised by the end of 2022, of which 71.1204 million heads were raised in Mongolia and 75.7469 million heads were raised in the Inner Mongolian Autonomous Region. Most grazing livestock are horses, cows, camels, sheep, and goats, with total output of 16.7044 million t of dairy products and 9.3219 million t of livestock products, such as beef and mutton, maintaining the livelihoods of approximately 10 million low-income people (Neely et al., 2009). However, available water resources are becoming a critical limiting factor for economic development, and with the increase in population and animal husbandry, the demand for water is rapidly increasing (Vörösmarty et al., 2010). The Mongolian Plateau has a typical arid and semi-arid climate, with an uneven distribution of water and heat, low rainfall, and limited water resources that restrict the development of animal husbandry, agriculture, and socioeconomic development in arid and semi-arid areas.
The ecological environment of the Mongolian Plateau is fragile, and the degree of grassland degradation gradually increases from the northeast to the southwest (Zhang et al., 2018). The vegetation coverage in the southwestern region is low, and desertification is severe (Meng et al., 2020). The Mongolian Plateau is affected by human activities and climatic factors such as rainfall, resulting in a prominent supply-demand contradiction of water resources and poor ecological stability. The fragility of ecosystems makes them particularly sensitive to climate change (Chen et al., 2012). ET is an important component of the surface energy and water balance, as well as a crucial driving force for the groundwater, soil, vegetation, and atmospheric water cycle (Wang, 2022). In water-deficient regions with fragile ecological environments, the ET is sensitive to vegetative dynamics and climate change (Li et al., 2015). Analyzing the trend of ET changes has important reference significance for the optimization of the management of animal husbandry, regional water resources, and the evaluation of grassland ecosystems in the Mongolian Plateau.
Research in this field has developed for over 200 years. Common models for estimating ET include the empirical statistical model, energy balance model, temperature vegetation index feature space method, Penman-Monteith model, and complementary correlation model. The empirical statistical model is only suitable for estimating ET in small areas, relying more on surface observation data, and has poor portability, making it difficult to apply to accurate estimation of ET in large areas (Zhang et al., 2012b); The complementary correlation model can generate significant errors in areas with significant terrain fluctuations (Liu et al., 2004); The temperature vegetation index feature space method is mostly suitable for flat underlying surfaces, and it is difficult for the method to accurately determine the dry and wet edges (Zhang et al., 2012b); The energy balance model requires numerous parameters and is sensitive to surface temperature anomalies. The challenge of more accurately spatializing meteorological data still needs to be overcome (Zhang et al., 2012b). The Penman-Monteith model can better understand how changes in climatic variables affect ET, including solar radiation, relative humidity, maximum and minimum temperatures, and wind speed (Sabino and de Souza, 2023). It has flexible time steps and can mimic continuous-time series ET, making it suitable for studying vegetation ET in arid and semi-arid areas. Li et al. (2023) used the Penman-Monteith model to calculate the global monthly ET from 1982 to 2018. Su et al. (2023) used the Penman-Monteith model to calculate the potential and crop ET of Chinese cotton over a long period and analyzed their spatiotemporal changes. Lan et al. (2023) used the Penman- Monteith model to calculate potential ET in the western Sichuan Plateau and analyzed the spatiotemporal variation characteristics of drought in the western Sichuan Plateau. Aschale et al. (2023) used the Penman-Monteith model to calculate the long-term potential ET in Sicily, providing a foundation for water resource management and improving irrigation efficiency. However, when most scholars use the Penman-Monteith model to estimate ET, the underlying surface conditions of certain vegetation types are relatively complex, and the surface impedance of the Penman-Monteith model is difficult to determine, requiring a large amount of meteorologied data and oversimplifying canopy impedance. There are certain limitations for areas with complex vegetation on the underlying surface; therefore, there is room for further research to improve simulation accuracy.
How applicable is the Penman-Monteith model to the Mongolian Plateau? What are the overall distribution characteristics of actual ET over the Mongolian Plateau? How do the spatiotemporal patterns and changes occur? These issues need to be addressed urgently. This study expects to analyze the spatiotemporal distribution of long-term ET in the Mongolian Plateau using the Penman-Monteith model, targeting the needs of this field and region. This study aims to enrich the ET data products of the Mongolian Plateau; enhance our understanding of the distribution of water resources in the region; help in understanding the changes in hydrology, ecology, animal husbandry, and grassland resources in the Mongolian Plateau; and promote the future regulation and sustainable development of regional water resources and animal husbandry.

2 Research areas and data sources

2.1 Research area

The geographical range of the Mongolian Plateau is shown in Figure 1. It is located in central Asia, within 37°46ʹ- 53°08ʹN, 87°40ʹ-122°15ʹE, covering the entire territory of Mongolia and Inner Mongolia Autonomous Region of China. It has a vast territory and is deeply inland, spanning arid and semi-arid regions; The annual average precipitation is approximately 200 mm, with a minimum air temperature of -45 ℃ and maximum temperature of 35 ℃. The annual average temperature varies greatly, with an average altitude of 1580 m, and the terrain gradually decreases from west to east (Lin et al., 2023); The land cover types include grassland, bare land, and water bodies. Grasslands account for approximately 68.24% of the Mongolian Plateau (Zheng et al., 2023), mainly distributed in its northern and southwestern parts. The grassland types include typical, meadow, and desert grassland. Deserts are another major land cover type in the Mongolian Plateau, in addition to grassland cover, accounting for approximately 26.36% of the Mongolian Plateau (Zheng et al., 2023), and are mainly distributed in the northwest and central regions.
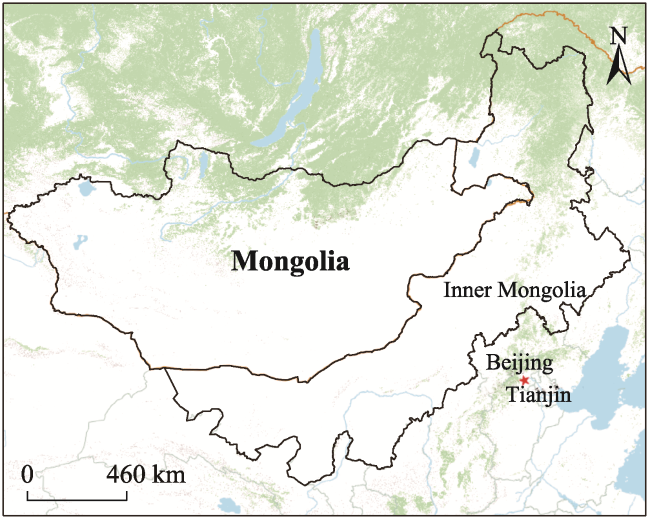
Figure 1 Schematic diagram of the study area

2.2 Data sources

Meteorological data, including wind speed, atmospheric pressure, and sunshine hours, from 2011 to 2022 were sourced from the China Meteorological Administration (http://data.cma.cn). The temporal resolution was monthly.
The average, maximum absolute, and minimum absolute temperature data were sourced from the Google Earth Engine (GEE) platform dataset CFSV2: NCEP Climate Forecast System Version 2, 6-hourly products, with a spatial resolution of 0.02° and monthly temporal resolution, all in K. Subsequent processing of the average temperature was performed in degrees Celsius.
Average relative humidity data were sourced from two websites, one of which was the National Earth System Science Data Center (http://www.geodata.cn). The dataset used was the monthly average relative humidity dataset with a resolution of 1 km in the Chinese region, spatial resolution of 1 km, and temporal resolution of every month. The dataset used covered the period of 2011‒2020, and the other dataset was from the Global Forecast System 384-hour Predicted Atmosphere Data of the GEE platform, with a spatial resolution of 0.02° and monthly temporal resolution, The period covered was 2021 to 2022.
The ET verification data were sourced from the global land actual ET dataset (1980‒2017) of the National Tibetan Plateau/Third Pole Environment Data Center (http://data.tpdc.ac.cn), which was cropped to include ET data from the Mongolian Plateau, with a spatial resolution of 0.25° and temporal resolution of days (Lu et al., 2021). The ET unit was millimeters (mm), and the complete period covered was from January 1, 1980, to December 31, 2017. This study adopted the time range of 2011‒2017.
The surface land cover data were sourced from the global 30 m surface cover fine classification product of the Chinese Academy of Sciences Aerospace Information Innovation Research Institute, with a spatial resolution of 30 m. The Mongolian Plateau area was extracted for land-cover type reclassification.
Rainfall data were sourced from the National Earth System Science Data Center (http://www.geodata.cn). The dataset used was a monthly precipitation dataset with a resolution of 1 km in China, spatial resolution of 1 km, and monthly temporal resolution. The dataset used covered the period of 2011 to 2021.

2.3 Research method

2.3.1 Calculation of potential ET

The Mongolian Plateau is divided into typical grasslands, desert grasslands, and bare land according to the different underlying surfaces. This study used meteorological data such as actual sunshine hours, average relative humidity, atmospheric pressure, and wind speed from 2011 to 2022 to calculate the potential ET using the FAO Penman-Monteith formula for the Mongolian Plateau:
$PET=\frac{0.408\times \Delta \times \left( {{R}_{n}}-G \right)+\gamma \times \frac{900}{T+273}\times {{U}_{2}}\times \left( {{e}_{s}}-{{e}_{a}} \right)}{\Delta +\gamma \times \left( 1+0.34{{U}_{2}} \right)}$
where, PET is the potential ET; es, ea respectively represent the saturated water vapor pressure and actual water vapor pressure (kpa); G is the geothermal flux (MJ m-2 d-1); Rn is the net solar radiation (MJ m-2 d-1); Δ is the slope of the water vapor pressure curve (kpa ℃-1); γ is the dry wet constant (kpa ℃-1); U2 is the wind speed at a height of 2 m (m s-1); and T is the average temperature (℃).

2.3.2 Calculation of actual ET

The actual ET calculation formula is as follows:
$ET=K\times PET$
In the formula, PET is the potential ET ($\text{mm}$); K is the ET coefficient. The land types in the Mongolian Plateau were reclassified according to season (spring, summer, autumn, and winter), and the ET coefficient of the corresponding underlying surface of the Mongolian Plateau was determined. As 94.6% of the underlying surface types on the Mongolian Plateau were grassland and bare land, the land types on the Mongolian Plateau were divided into meadow, typical, and desert grassland, and bare land, the remaining 5.4% was mostly forest grassland, with a small area and scattered distribution mixed with meadow grassland, thus classified as meadow grassland. The grassland and desert ET coefficients calculated by Li and Gao (2004) were used. The values for the meadow, typical, and desert grassland, and bare land were 0.79, 0.4, and 0.3, and 0.21, respectively. The projection coordinate system WGS_1984_UTM_Zone_ 46N is used to transform the result.

2.3.3 Correlation analysis between precipitation and ET

Pearson’s correlation analysis was used to analyze the correlation between ET and precipitation on the Mongolian Plateau. The formula for the correlation analysis is as follows:
$r=\frac{\sum\limits_{i=1}^{n}{\left( {{Y}_{i}}-\bar{Y} \right)\left( E{{T}_{i}}-\overline{ET} \right)}}{\sqrt{\sum\limits_{i=1}^{n}{{{\left( {{Y}_{i}}-\bar{Y} \right)}^{2}}}\sum\limits_{i=1}^{n}{{{\left( E{{T}_{i}}-\overline{ET} \right)}^{2}}}}}$
where r represents the correlation coefficient between ET and precipitation; Yi represents the value of precipitation in the i-th year; $\bar{Y}$ represents the average annual precipitation; ETi represents ET in the i-th year, and $\overline{ET}$ represents the average annual ET in the Mongolian Plateau.
A process diagram of ET research is shown in Figure 2.
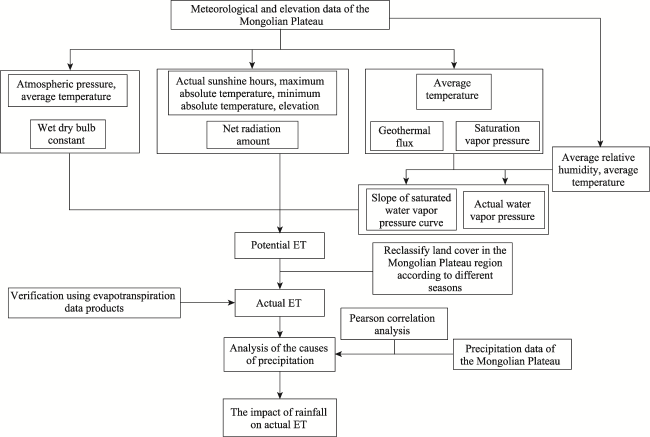
Figure 2 Flow chart of ET research

3 Results

3.1 Interannual spatiotemporal distribution characteristics of ET on the Mongolian Plateau

3.1.1 Spatial interannual distribution characteristics on the Mongolian Plateau

To verify the accuracy of the actual ET data for the Mongolian Plateau obtained using the Penman-Monteith model, we obtained a Mongolian Plateau ET dataset cropped by the National Tibetan Plateau/Third Pole Environment Data Center from 2011 to 2017. The dataset was extracted monthly using ArcGIS and correlation analysis was performed using Excel.
In Figure 3, the actual ET calculated for the Mongolian Plateau is compared with the actual calculated ET, showing a linear relationship with consistent accuracy. The R2 value was 0.94 and the P <0.05, and the result is relative accurate. Thus, it can be used to characterize the spatiotemporal changes in ET on the Mongolian Plateau from 2011 to 2022, and has certain data reference significance for improving the water resource utilization efficiency of the Mongolian Plateau, as well as regulating animal husbandry, combating desertification, and grassland degradation.
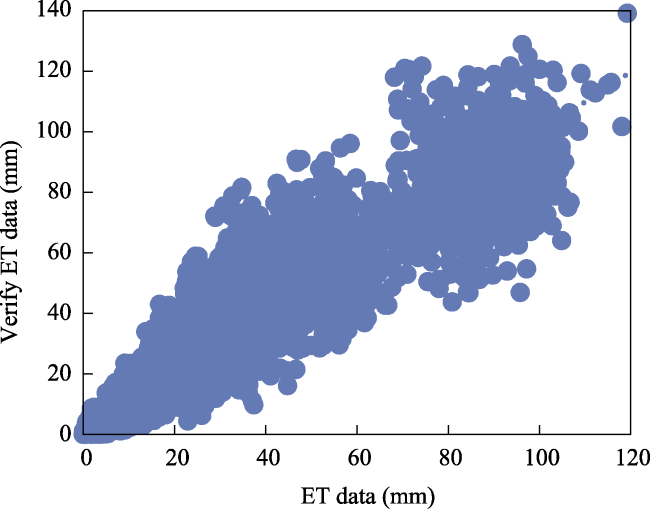
Figure 3 Comparison of evapotranspiration results
The spatial distribution of ET on the Mongolian Plateau from 2011 to 2022 using the Kriging interpolation method is shown in Figure 4. From 2011 to 2022, the annual ET was highly similar in spatial distribution, showing higher values in the north and southeast and lower values in the southwest and central regions.
Figure 4 Spatial distribution of ET from 2011 to 2022
The regions with the highest annual ET were the Selenga River Basin in Mongolia and eastern part of the Inner Mongolia Autonomous Region in China. The land types were mostly grassland and typical grassland, with annual ET exceeding 400 mm and reaching 500 mm, respectively. The southwestern and central regions of the Mongolian Plateau are located in arid areas with sparse precipitation. The vegetation types were mostly deserts and desert grasslands, with an average annual ET of 140 mm.
Figure 4c, 4h, 4i, and 4j show that the annual ET values in 2013, 2018, 2019, and 2020 were relatively high, varying between 80 and 500 mm. Over the past 12 years, the overall ET in the Mongolian Plateau showed a trend of first decreasing, then increasing, and finally decreasing.

3.1.2 Interannual distribution characteristics on the Mongolian Plateau

The interannual variation in ET in the Mongolian Plateau is shown in Figure 5. The annual ET showed a wave-like bimodal trend over time, peaking in 2013 and 2019. The ET in the Mongolian Plateau over the years fluctuated in the range of 100-500 mm, and in most areas, the fluctuation range of ET was 200-400 mm. The average annual ET in 2015 and 2022 was relatively low, with higher values in 2013, 2018, and 2019. In 2013 and 2019, the highest ET values were approximately 520 mm in some areas. For many years, the lowest ET on the Mongolian Plateau was approximately 100 mm, with the minimum value reaching approximately 80 mm.
Figure 5 Schematic diagram of time distribution of interannual ET

3.2 Spatiotemporal distribution characteristics of monthly ET on the Mongolian Plateau

3.2.1 Spatial distribution of monthly ET on the Mongolian Plateau

The spatial variation in the monthly average ET over the Mongolian Plateau from 2011 to 2022 is shown in Figure 6. The spatial distribution of the medium and high ET values over the Mongolian Plateau was highly similar, with higher values in the northern and eastern parts of the plateau, and lower values in the central and southwestern parts. The ET of the Selenga River Basin was highest during these months, followed by the eastern part of the Mongolian Plateau.
Figure 6 Spatial distribution of annual ET
In January, February, November, and December, the average temperature on the Mongolian Plateau is below 0 ℃, with low vegetation coverage and sparse precipitation. Therefore, ET is generally low, ranging from 0.1-18 mm (1.87-4.59 mm in January, 0.63-6.9 mm in February, and 4.05-18.1 mm in March). In areas such as the bare land in the southwest, ET was relatively low, with a maximum value of 4 mm. As the temperature gradually increased and rainfall became more abundant, the soil moisture increased accordingly. Vegetation coverage on the Mongolian Plateau has gradually increased, and vegetation has entered the greening period. The increase in vegetation and precipitation also gradually increased the ET. The ET was highest in July throughout the year. Precipitation on the Mongolian Plateau has increased, and vegetation coverage is high, resulting in lush growth. Therefore, the ET was relatively high, with the highest value reaching 104.33 mm. June, July, and August had relatively high ET values throughout the year (19.08-80.18 mm for June, 10.13-104.33 mm for July, and 19.82-84.1 mm for August). Later, as the temperature and vegetation coverage decreased, precipitation also gradually decreased, leading to a gradual decrease in ET after reaching its peak in July. The lowest ET in December is the month with the lowest ET. The hair volume can reach about 0 mm.

3.2.2 Temporal distribution of monthly ET on the Mongolian Plateau

The monthly ET from 2011 to 2022 is shown in Figure 7, with July as the turning point, following a single peak trend of an initial increase followed by a decrease. The ET in June, July, August, and September was relatively high throughout the year, and most of the annual ET was concentrated during these four months. July had the highest ET, reaching over 100 mm, and the ET in the bare land areas reached approximately 10 mm. The following year, August, had the highest ET in the region, reaching approximately 90 mm. In July and August, the ET in most areas reached 40‒90 mm. Although the ET in some areas reached approximately 90 mm in June, in most areas, it was between 20 and 50 mm. In September, the ET in most areas was approximately 20-50 mm. However, the ET trend in that month began to decrease significantly, followed by March, April, May, and October, with slightly lower ET values. In most areas, ET was between 10 and 35 mm, and the ET was lowest in January, February, November, and December. The ET during these four months was extremely low, and the lowest value was approximately 0 mm. During this period, the temperature was the lowest throughout the year. In these months, the temperature on the Mongolian Plateau is typically below 0 ℃, and the lowest value can reach -30 ℃. The ET was between 0 and 10 mm, with values between 0 and 3 mm in most areas.
Figure 7 Temporal distribution of ET throughout a year

3.3 Correlation analysis of precipitation and ET on the Mongolian Plateau

The spatial and temporal distributions of annual mean precipitation over the Mongolian Plateau are shown in Figure 8. As shown in Figure 8a, the spatial distribution of the annual mean precipitation on the Mongolian Plateau presented a spatial and temporal distribution pattern of higher annual mean precipitation in the north and east and lower annual mean precipitation in the south, with evident regional differences. High-precipitation areas were mainly concentrated in the eastern region of the Inner Mongolia Autonomous Region, with the highest precipitation reaching over 700 mm, followed by the northern region of Mongolia. The low-precipitation areas were mainly in the southwestern region of the Mongolian Plateau, with the lowest being only approximately 20 mm, as shown in Figure 8b, where the annual average annual precipitation over the Mongolian Plateau presented a unimodal change trend with July as the inflection point, precipitation was mainly concentrated from June to September, and precipitation was almost zero in winter.
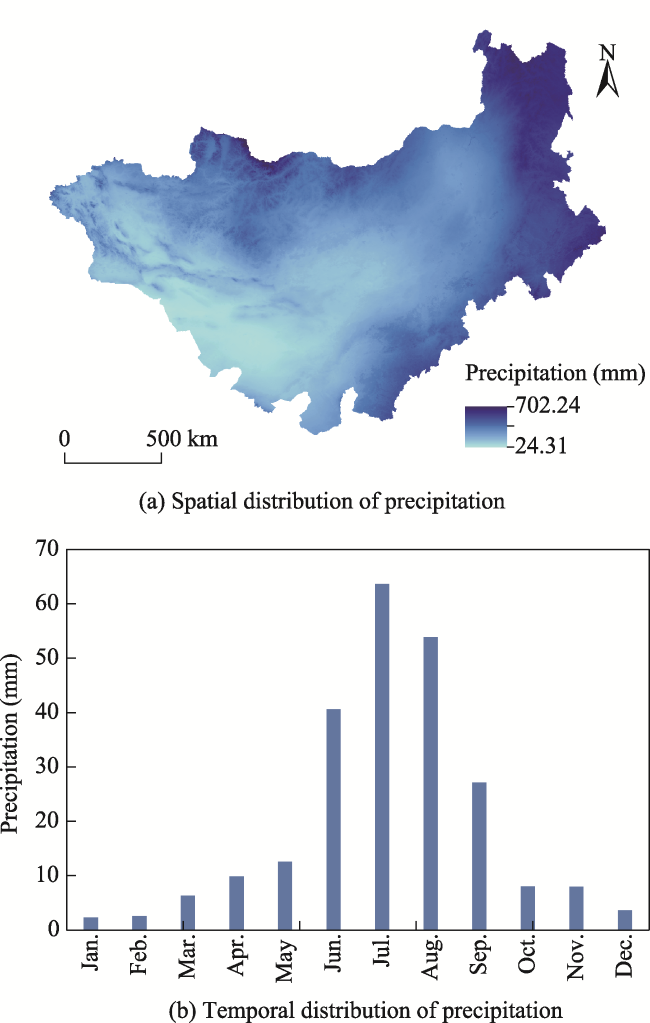
Figure 8 Temporal and spatial distribution of precipitation over the Mongolian Plateau
The spatial correlation between the annual ET and precipitation in the Mongolian Plateau is shown in Figure 9. The correlation coefficient between ET and precipitation was between -0.3 and 1, and the average spatial correlation coefficient is 0.68, showing a positive correlation in the basin overall. Precipitation and ET in most areas showed an evident and extremely strong correlation, with the highest correlation coefficient can reaching 0.98. However, the correlation between precipitation and ET in the Selenga River Basin and the southeastern region was weaker than that in other regions, with a minimum of -0.3.
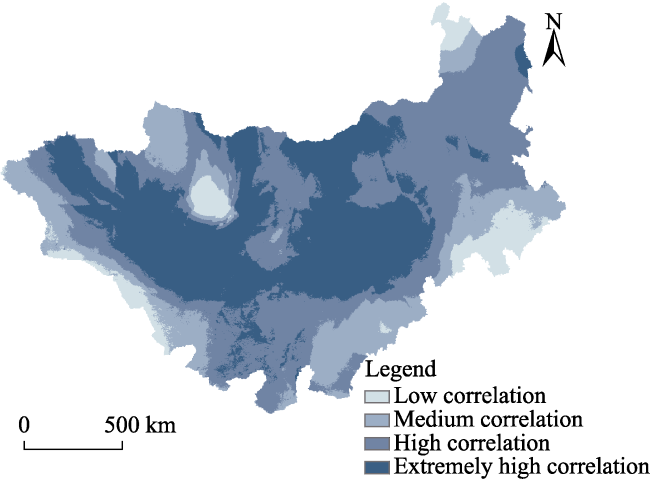
Figure 9 Correlation distribution diagram of precipitation on the Mongolia Plateau

4 Discussion

ET is a key variable in the water cycle that not only reflects the feedback effect of the ecosystem on the climate system, but also provides important reference value for the utilization of water resources (Xue et al., 2023). In this study, the spatiotemporal distribution characteristics of long-term ET on the Mongolian Plateau from 2011 to 2022 were determined based on the Penman-Monteith model and data such as temperature, air pressure, and sunshine hours. The effects of precipitation and vegetation coverage of the underlying surface on ET over the Mongolian Plateau were also analyzed.
The ET is mainly composed of soil evaporation and vegetation transpiration. Transpiration is not only affected by water conditions, but also by vegetation coverage on the underlying surface (Bremer and Ham, 1999). The Mongolian Plateau is located deep inland and is an arid and semi-arid region with a vast territory and rich vegetation. The underlying surface of typical grasslands, desert grasslands, and other grasslands as land cover types accounts for approximately 95% of the Mongolian Plateau. The actual ET is mainly controlled by local water conditions, and the amount of precipitation directly affects the amount of local ET (Kang, 2023). The actual ET of the Mongolian Plateau has clear interannual spatial distribution characteristics and is highly similar, showing high values in the north and east and low values in the central and south bare land areas. The ET continued to increase from southwest to northeast, with the highest ET occurring in the Selenga River Basin in Mongolia and in the eastern part of the Inner Mongolia Autonomous Region, whereas the lowest ET occurred in the southern part of the Mongolian Plateau. As most areas of the underlying surface types in the central and southern parts of the Mongolian Plateau are bare land, and the desertification phenomenon in the southern region of Mongolia is very strong (Meng et al., 2020), precipitation is sparse, vegetation coverage is low, vegetation is sparse, and transpiration is weak. In addition, rainfall in the region is sparse, and the amount of water available for evaporation is limited; therefore, the actual ET is also low. Grasslands, such as meadow and typical grasslands, are mainly distributed in northern Mongolia and the eastern Inner Mongolia Autonomous Region, represented by the Selenga River Basin, with high precipitation, higher vegetation coverage, and vegetation transpiration, supplemented by surface water resources, such as rivers, for ET; therefore, the actual ET is higher. Areas with high vegetation coverage and abundant precipitation can reach maximum depths of >500 mm in suitable years.
The spatial distribution of mid to high annual and interannual ET on the Mongolian Plateau had a high degree of similarity, showing high levels in the north and east and low levels in the middle and southern bare land areas. In May, June, and October, the ET in the eastern part of the Inner Mongolia Autonomous Region was highest. In January, February, November, and December, the ET did not exceed 8 mm in the area with the highest value, and the minimum ET reached 0.03 mm. The area with the lowest ET in the southern desert area had an ET of 0-20 mm throughout the year, and the ET gradually increased from southwest to northeast. In terms of the temporal distribution, there was a parabolic pattern of first increasing and then decreasing, with July as the turning point. The annual ET was concentrated from May to September. During these five months, there was a large gap between the areas with the highest and lowest ET, reaching over 100 mm at the highest point and only approximately 10 mm at the lowest point. In June, the ET at the highest point was significantly different from that in most areas. The ET in most regions was approximately 25-50 mm, but the highest ET reached 90 mm.
From May to September, ET and precipitation were concentrated within the same period. The cumulative average precipitation on the Mongolian Plateau was 198.47 mm, accounting for 82.9% of the annual precipitation at the station. In May, vegetation gradually entered the greening season, with increased vegetation coverage, increased precipitation, improved vegetation and surface water resource conditions, and increased ET, which peaked in July. Subsequently, the temperature and precipitation gradually decreased. The cumulative average precipitation in January, February, October, and December was 24.58 mm, accounting for only 10.3% of the annual average precipitation; during this period, the average temperature on the Mongolian Plateau reached below 0 ℃, with a decrease in vegetation coverage. The ET of vegetation decreased, and the overall ET decreased significantly from its peak. Water, thermal, and vegetation conditions caused decreases in ET. After November, the ET in most areas was less than 2 mm, and in some areas, it was almost 0 mm.
In the research on ET related to the Mongolian Plateau region, many studies on Mongolia or the Inner Mongolia Autonomous Region alone, but much less literature has been published on the entire Mongolian Plateau is far less than on the above two regions. Therefore, studying the temporal and spatial characteristics of ET over the Mongolian Plateau provides data for water resource balance, grassland resource regulation, and animal husbandry development. The spatial distribution characteristics of the ET of Han Dianchen (Han, 2022; Han et al., 2022), and Zhao et al. (2021) on the Inner Mongolian Plateau are consistent with the results of this study, both showing low values in the northwest and high values in the northeast, and also showing a single peak change trend with July as the inflection point. When studying the spatiotemporal variation of ET in Mongolia, Liu et al. (2013) and Ersi et al. (2022) found that the spatiotemporal variation was consistent with that in this paper, with high values in the north and low values in the south. However, in a previous study conducted in southern Mongolia, the minimum annual ET was approximately 60 mm, whereas in the present study, the minimum ET was approximately 70 mm. The specific reason for this is that there are few meteorological stations in southern Mongolia; however, there are many meteorological stations in the northern region, especially in the Selenga River Basin, where ET can reach up to 500 mm. Therefore, when using ArcGIS for Kriging interpolation, the influence of the northern values is reflected in the figure, which shows that the ET in the southern region exceeded the calculated value.
In this study, owing to the sparse distribution of meteorological stations in the desert areas of the southern Mongolian Plateau, the number of stations was much lower than those in the northern and eastern watersheds and grassland areas. Therefore, when using the Penman-Monteith formula to calculate ET in arid areas with sparse stations, the accuracy of ET obtained in areas with low land coverage, such as the bare land in the southern region, is lower than that in areas with high vegetation coverage in the northern and eastern parts. The forest coverage of the Mongolian plateau is only 5%, and it is mostly dispersed in the meadow grassland (Zheng et al., 2023), therefore, in this study, we did not calculate the ET of forests as a single class. The study of actual ET using the Penman-Monteith model will play an important role in the development of animal husbandry, utilization of surface-available water resources, and sustainable development in arid and semi-arid regions, such as North Asia, Central Asia, and the Middle East. In subsequent ET research, further analysis and improvements will be conducted to improve the applicability of the Penman-Monteith model in these regions.

5 Conclusions

Taking the Mongolian Plateau as the research area, the Penman-Monteith model was used to calculate and analyze the temporal and spatial distribution patterns of ET over the Mongolian Plateau and initially reveal the ET change trend of the Mongolian Plateau ecosystem. The specific conclusions are as follows:
(1) The spatial distribution characteristics of ET in the Mongolian Plateau showed high values in the north and east and low values in the middle and south. The ET gradually decreased from the northeast to the southwest, and the regional annual ET varied significantly, which was similar to the spatial distribution pattern of the land cover. The areas with the highest ET were the Selenga River Basin and eastern part of the Mongolian Plateau, with an average annual ET of over 400 mm and the highest value reaching 500 mm each year. Due to their high land vegetation coverage and abundant grassland resources, these areas are mostly meadow grasslands and typical grasslands with abundant precipitation and strong vegetation transpiration, resulting in higher ET. The southern part of the Mongolian Plateau had the lowest ET, with the highest annual ET being approximately 100 mm and the lowest reaching 65 mm. The land cover types in this area are mostly desertified grasslands and bare land, with low vegetation coverage and sparse precipitation. The soil moisture content was low, resulting in a lower ET than that in the other regions. Overall, the ET in the northern region was higher than that in the southern region.
(2) The temporal distribution of the Mongolian Plateau showed a parabolic pattern, first increasing and then decreasing, with July as the turning point. The ET intensity was related to factors such as vegetation coverage, temperature, and precipitation. May-September was a period of high ET on the Mongolian Plateau. During this period, the temperature gradually increased, precipitation was relatively abundant, and the soil moisture content increased. The vegetation was lush, and transpiration from plants was strong. Increases in vegetation transpiration and soil moisture content led to gradual increases in ET. Owing to the large amounts of desertified grasslands and bare land in the southern part of the Mongolian Plateau, sparse vegetation, low vegetation transpiration, and low soil moisture content, the ET in the southern part of the Mongolian Plateau is relatively low, which also impacts the ecological environment. The ecological environment is fragile and the ability to prevent and control desertification is weak.
[1]
Aschale T M, Palazzolo N D J, Peres G, et al. 2023. An assessment of trends of potential evapotranspiration at multiple timescales and locations in Sicily from 2002 to 2022. Water, 15(7): 1273. DOI: 10.3390/w15071273.

[2]
Bremer D J, Ham J M. 1999. Effect of spring burning on the surface energy balance in a tallgrass prairie. Agricultural and Forest Meteorology, 97(1): 43-54.

[3]
Chang H, Sun H L, Liu X C, et al. 2016. Assessment of grassland ecosystem water conservation and its value in Dongwuqi, Inner Mongolia. Animal Husbandry and Feed Science, 37(5): 24-27. (in Chinese)

[4]
Chen Z, Zhang X, Cui M, et al. 2012. Tree-ring based precipitation reconstruction for the forest-steppe ecotone in northern Inner Mongolia, China and its linkages to the Pacific Ocean variability. Global and Planetary Change, 86: 45-56.

[5]
Dong Y, Yan H M, Du W P, et al. 2019. Spatio-temporal analysis of grassland carrying capacity in Mongolian Plateau—Based on supply-consumption relationship. Journal of Natural Resources, 34(5): 1093-1107. (in Chinese)

[6]
Ersi C, Bayaer T, Bao Y H, et al. 2022. Temporal and spatial changes in evapotranspiration and its potential driving factors in Mongolia over the past 20 years. Remote Sensing, 14(8): 1856. DOI: 10.3390/rs14081856.

[7]
Han D C. 2022. Analysis of spatiotemporal variation and attribution of evapotranspiration in semi-arid areas of Inner Mongolia. Diss., Nanjing, China: Nanjing University of Information Science and Technology. (in Chinese)

[8]
Han D C, Zhang F M, Chen J Q, et al. 2022. Evapotranspiration of a semi-arid landscape in Inner Mongolia: Estimation and attribution. Arid Land Geography, 45(4): 1071-1081. (in Chinese)

DOI

[9]
Kang L G. 2023. Study on the spatiotemporal variation characteristics and influencing factors of evapotranspiration in the Qinghai Lake Basin. Diss., Xining, China: Qinghai Normal University. (in Chinese)

[10]
Kurc S A, Small E E. 2004. Dynamics of evapotranspiration in semiarid grassland and shrubland ecosystems during the summer monsoon season, central New Mexico. Water Resources Research, 40(9). DOI: 10.1029/2004WR003068.

[11]
Lan H C, Liu Y Y, Zhang Y F, et al. 2023. Spatiotemporal variation of drought in the Western Sichuan Plateau based on standardized precipitation evapotranspiration index. Chinese Journal of Applied Ecology, 34(6): 1533-1540. (in Chinese)

DOI

[12]
Li C M, Gao S H. 2004. Study on the moisture budget of the grasslandsin the semiarid regions in north China. Arid Zone Research, (4): 338-342. (in Chinese)

[13]
Li S J, Wang G J, Zhu C X, et al. 2023. Spatial patterns and recent temporal trends in global transpiration modelled using eco-evolutionary optimality. Agricultural and Forest Meteorology, 342: 109702. DOI: 10.1016/j.agrformet.2023.109702.

[14]
Li Z Y, Liu X H, Niu T L, et al. 2015. Ecological restoration and its effects on a regional climate: The source region of the Yellow River, China. Environmental Science & Technology, 49(10): 5897-5904.

[15]
Lin X H, He M H, Zeng G X, et al. 2023. The impact of vegetation stability on water storage, temperature and precipitation in the Mongolian Plateau. Journal of Irrigation and Drainage, 42(8): 106-113. (in Chinese)

[16]
Liu S M, Sun R, Sun Z P, et al. 2004. Comparison of different complementary relationship models for regional evapotranspiration estimation. Acta Geographica Sinica, 59(3): 331-340. (in Chinese)

DOI

[17]
Liu Y L, Zhuang Q L, Chen M, et al. 2013. Response of evapotranspiration and water availability to changing climate and land cover on the Mongolian Plateau during the 21st century. Global and Planetary Change, 108: 85-99.

[18]
Lu J, Wang G J, Chen T X, et al. 2021. A harmonized global land evaporation dataset from model-based products covering 1980-2017. Earth System Science Data, 13(12): 5879-5898.

[19]
Meng X Y, Gao X, Li S Y, et al. 2020. Spatial and temporal characteristics of vegetation NDVI changes and the driving forces in Mongolia during 1982-2015. Remote Sensing, 12(4): 603. DOI: 10.3390/rs12040603.

[20]
Neely C, Bunning S, Wilkes A. 2009. Review of evidence on drylands pastoral systems and climate change. Rome, Italy: FAO: 23-123.

[21]
Rjili H, Muñoz-Ulecia E, Bernués A, et al. 2023. Evolution of pastoral livestock farming on arid rangelands in the last 15 years. Animal, 17(4): 100748. DOI: 10.1016/j.animal.2023.100748.

[22]
Sabino M, de Souza A P. 2023. Global sensitivity of penman-monteith reference evapotranspiration to climatic variables in Mato Grosso, Brazil. Earth, 4(3): 714-727.

[23]
Shi G H, Yun W L, Cui S L. 2022. Study on the evapotranspiration variation and the influencing climate factorsin typical steppe of Inner Mongolia. Meteorology Journal of Inner Mongolia, (6): 18-23. (in Chinese)

[24]
Su Y X, Wang J, Li J H, et al. 2023. Spatiotemporal changes and driving factors of reference evapotranspiration and crop evapotranspiration for cotton production in China from 1960 to 2019. Environmental Science, 11: 1251789. DOI: 10.3389/fenvs.2023.1251789.

[25]
Vörösmarty C J, McIntyre P B, Gessner M O, et al. 2010. Global threats to human water security and river biodiversity. Nature, 467(7315): 555-561.

[26]
Wang K L. 2022. Study on the response relationship between evapotranspiration and vegetation change on the Loess Plateau. Diss., Baoding, China: North China University of Water Resources and Electric Power. (in Chinese)

[27]
Xue Y Y, Liang H B, Zhang H B, et al. 2023. Quantifying the policy-driven large scale vegetation restoration effects on evapotranspiration over drylands in China. Journal of Environmental Management, 345: 118723. DOI: 10.1016/j.jenvman.2023.118723.

[28]
Zhang F, Zhou G S, Wang Y, et al. 2012a. Evapotranspiration and crop coefficient for a temperate desert steppe ecosystem using eddy covariance in Inner Mongolia, China. Hydrological Processes, 26(3): 379-386.

[29]
Zhang R H, Du J P, Sun R. 2012b. Review of estimation and validation of regional evapotranspiration based on remote sensing. Advances in Earth Science, 27(12): 1295-1307. (in Chinese)

[30]
Zhang Y Z, Wang Z Q, Yang Y, et al. 2018. Research on the quantitative evaluation of grassland degradation and spatial and tempora distribution on the Mongolia Plateau. Pratacultural Science, 35(2): 233-243. (in Chinese)

[31]
Zhao X, Hu H F, Shen H H, et al. 2015. Satellite-indicated long-term vegetation changes and their drivers on the Mongolian Plateau. Landscape Ecology, 30: 1599-1611.

[32]
Zhao X H, Zhang F M, Han D C, et al. 2021. Evapotranspiration changes and its attribution in semi-arid regions of Inner Mongolia. Arid Zone Research, 38(6): 1614-1623. (in Chinese)

DOI

[33]
Zheng H, Wang Q F, Li Y N, et al. 2013. Characteristics of evapotranspiration in an alpine shrub meadow in Haibei, Qinghai of Northwest China. Journal of Applied Ecology, 24(11): 3221-3228. (in Chinese)

[34]
Zheng X Y, Lv N, Zhang L. 2023. Taking land degradation neutrality from concept to practice: A case study of the Mongolian Plateau. Acta Ecologica Sinica, 43(23): 9925-9937. (in Chinese)

Outlines

/