
Journal of Resources and Ecology >
Does the Digital Economy Optimize Tourism Industry Structure? Effects and Mechanisms Based on Quantile Regression and Threshold Modeling
|
LIU Lei, E-mail: 13515319903@163.com |
Received date: 2023-09-27
Accepted date: 2024-02-06
Online published: 2024-12-09
Supported by
The National Natural Science Foundation of China(42261042)
The Hunan Provincial Natural Science Foundation(2024JJ7410)
The Hunan Provincial Graduate Student Research and Innovation Program(CX20221095)
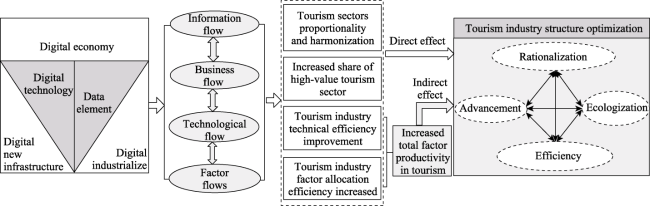
A comprehensive evaluation index system is constructed, and the entropy weight TOPSIS method is used to measure the optimization level of the digital economy and tourism industry structure of 30 provinces in China from 2012 to 2021. Moreover, models such as quantile regression and panel threshold are used to explore the influence of the digital economy (DIG) on the optimization of the tourism industry structure (TIS) as well as its transmission mechanism. The study reveals that DIG significantly promotes TIS, which remains valid after endogeneity and robustness tests; the impact of DIG on TIS exhibited a “U-shape” effect that first decreases and then increases, and its highest significance is at the 90% quartile level. Threshold model tests revealed a nonlinear threshold effect with DIG and tourism total factor productivity (TTFP) as a single threshold and tourism technological progress index (TECH) as a double threshold, and the second threshold has the largest effect of 0.163. Mechanism analysis found that the mediating impact of the DIG on the TIS was mediated by increasing the TTFP, and the TECH accounted for the highest proportion of 12.15%. Regional analysis revealed that the role of DIG on the TIS is Central>East>West>Northeast, and the empowering effect is more significant in the high digital economy level area and the high tourism industry structure optimization area.
LIU Lei , SU Juan , XUE Xuanxuan . Does the Digital Economy Optimize Tourism Industry Structure? Effects and Mechanisms Based on Quantile Regression and Threshold Modeling[J]. Journal of Resources and Ecology, 2024 , 15(6) : 1692 -1706 . DOI: 10.5814/j.issn.1674-764x.2024.06.024
Fig. 1 Effect and mechanism of digital economy on the optimization of tourism industry structure |
Table 1 Evaluation index system of tourism industry structure optimization |
| Target | Subsystems | Indicators | Indicators interpretations |
|---|---|---|---|
| Tourism industry structure optimization | Rationalization | Y1 Harmonization of proportional relationships in the tourism sector | Calculated using the index TRit : where, , (7) |
| Y2 Annual growth rate of tourism industry revenue | Ratio of current gross tourism receipts minus previous year’s gross tourism receipts to previous year’s gross tourism receipts | ||
| Y3 Employment growth rate in tourism industry | Ratio of persons employed in tourism to persons employed in the tertiary sector | ||
| Advancement | Y4 Highly elastic sectoral income in the tourism industry | Revenue from tourism, shopping, and entertainment sectors | |
| Y5 Innovative output capacity of tourism industry | Number of patent applications related to the tourism industry | ||
| Y6 Foreign exchange earning capacity of tourism industry | Ratio of Inbound tourism revenue to total tourism revenue | ||
| Efficiency | Y7 Tourism industry investment output rate | Gross tourism revenue/Investment in fixed assets in tourism industry | |
| Y8 Labor productivity in tourism industry | Ratio of total tourism revenue to total number of employees in tourism | ||
| Ecologization | Y9 Eco-efficiency of tourism industry | Municipal nonhazardous waste disposal rate | |
| Y10 Tourism industry environment investment rate | Amount of environmental protection investment×(Total tourism revenue/GDP) |
Note: In formula (7), TRit denotes the degree of coordination of the tourism industry sector, and Yit and Lit are the tourism output value and the number of employees at different times and sectors, respectively, this paper considered three sectors: tourist agencies, tourist attractions, and the hotel industry. |
Table 2 Evaluation index system of digital economy development level |
| Target | Subtarget | Dimension | Indicator | Unit |
|---|---|---|---|---|
| Digital economy | Digital infrastructure | Hardware facilities | X1 Long distance fiber optic cable line length | 104 km |
| X2 Mobile phone base station | 104 Individuals | |||
| X3 Internet broadband access port | 104 Individuals | |||
| Software facilities | X4 Number of Internet domain names | 104 Individuals | ||
| X5 Number of IPv4 addresses | 104 Individuals | |||
| X6 Number of Internet websites | 104 Individuals | |||
| Digital industry development | Digital industrialization | X7 Total telecommunications business | Billion yuan | |
| X8 Software business revenue | Billion yuan | |||
| X9 Employment in the information transmission, computer services and software industry | People | |||
| Industrial digital | X10 Websites per 100 businesses | Billion yuan | ||
| X11 E-commerce sales | Billion yuan | |||
| X12 Computers per 100 population | People | |||
| Digital economy applications | Digital users | X13 Internet broadband access users | 104 households | |
| X14 Digital telephone users | 104 households | |||
| Digital innovation | X15 R&D investment intensity | % | ||
| X16 Number of R&D organizations X17 Number of patent applications granted | Individual Individual | |||
| Digital financial inclusion | X18 Digital inclusion financial digitization index | - | ||
| X19 Digital financial inclusion coverage breadth index | - | |||
| X20 Depth of use index for digital financial inclusion | - |
Table 3 Total factor productivity measures for the tourism industry |
| Target | Dimensions | Indicators |
|---|---|---|
| Input indicators | Capital factor | Z1 Original value of fixed assets of travel agencies, star-rated hotels and star-rated scenic spots |
| Labor factor | Z2 Number of employees in travel agencies, star-rated hotels and star-rated scenic spots | |
| Resources factor | Z3 Number of scenic spots of Grade 4A and above | |
| Technology factor | Z4 Harmless waste treatment rate of domestic waste | |
| Output indicators | Earnings factor | Z5 Gross international and domestic tourism receipts |
| Scale factor | Z6 Total international and domestic tourism arrivals |
Table 4 Descriptive statistics results of main variables |
| Variables | Name | Sample | Mean | Max | Min | S.D. |
|---|---|---|---|---|---|---|
| Dependent variable | Tourism Industry Structure Optimization (TIS) | 300 | 0.089 | 0.377 | 0.019 | 0.052 |
| Independent variable | Digital Economy (DIG) | 300 | 0.135 | 0.567 | 0.017 | 0.108 |
| Intermediary variables | Tourism Total Factor Productivity (TTFP) | 300 | 1.105 | 4.491 | 0.091 | 0.569 |
| Technological Progress Index (TECH) | 300 | 1.096 | 3.142 | 0.062 | 0.528 | |
| Pure Technical Efficiency (PECH) | 300 | 0.981 | 1.436 | 0.486 | 0.152 | |
| Scale Efficiency (SECH) | 300 | 1.092 | 9.931 | 0.224 | 0.721 | |
| Control variables | Government Support (GOV) | 300 | 0.139 | 0.001 | 0.792 | 0.103 |
| Economic Development Level (ED) | 300 | 0.248 | 0.937 | 0.014 | 0.175 | |
| Tourism Resource Endowment (RES) | 300 | 0.241 | 1.022 | 0.002 | 0.174 | |
| Tourism Human Capital (HUM) | 300 | 0.137 | 0.046 | 1.913 | 0.175 | |
| Tourism Consumption Demand (TD) | 300 | 0.262 | 0.008 | 1.016 | 0.174 |
Table 5 Regression results of the direct impact of the digital economy on the optimization of the tourism industry structure |
| Variables | Model I | Model II | Model III | Model IV | Model V |
|---|---|---|---|---|---|
| DIG | 0.266*** (7.98) | 0.230*** (6.44) | 0.184*** (4.28) | 0.196*** (5.31) | 0.154*** (3.35) |
| GOV | 0.075** (2.22) | 0.066* (1.78) | 0.032 (0.72) | 0.070** (2.17) | 0.035 (0.95) |
| ED | 0.042 (1.47) | 0.092 (2.56) | 0.195*** (3.08) | 0.062 (1.78) | 0.156*** (3.35) |
| RES | ‒0.023 (‒1.22) | ‒0.011 (0.49) | 0.382 (0.03) | 0.002 (0.08) | 0.013 (0.42) |
| HUM | ‒0.010 (‒0.72) | ‒0.009 (‒0.64) | 0.013 (0.87) | ‒0.016 (‒1.30) | ‒0.018 (‒1.36) |
| TD | ‒0.030 (‒1.07) | ‒0.064 (‒2.06) | ‒0.121*** (‒2.99) | 0.015 (0.39) | ‒0.008 (‒0.17) |
| Constant | 0.047*** (8.70) | 0.047*** (6.68) | 0.046*** (4.51) | 0.050*** (6.09) | 0.043*** (4.26) |
| Regional effects | Yes | Yes | No | Yes | |
| Time effects | No | No | Yes | Yes | |
| Samples | 300 | 300 | 300 | 300 | 300 |
Note: ***, **, and * denote significance levels of 1%, 5%, and 10%, respectively. The data in parentheses are the t-statistics, and the same goes for the next tables. |
Table 6 Quantile regression results of the impact of the digital economy on the optimization of the tourism industry structure |
| Variables | Dependent variable (TIS) | ||||
|---|---|---|---|---|---|
| Level = 0.10 | Level = 0.25 | Level = 0.50 | Level = 0.75 | Level = 0.90 | |
| DIG | 0.247*** (3.08) | 0.216*** (6.00) | 0.238 *** (8.03) | 0.278*** (5.13) | 0.350*** (3.51) |
| GOV | 0.037 (1.06) | 0.033 (1.07) | 0.023 (0.74) | 0.083 (1.29) | 0.188 (1.44) |
| ED | 0.051** (2.34) | 0.063** (2.09) | 0.062** (2.51) | 0.000 (0.01) | ‒0.113* (‒1.45) |
| RES | ‒0.035 (‒1.23) | 0.005 (0.26) | 0.009 (0.60) | 0.019 (0.75) | ‒0.064 (‒1.00) |
| HUM | 0.021 (1.42) | 0.027 (1.40) | 0.019 (1.38) | 0.023 (1.43) | ‒0.073*** (‒2.67) |
| TD | ‒0.110*** (‒3.20) | ‒0.069 (‒2.34) | ‒0.056 (‒2.37) | 0.023 (0.79) | 0.113 (1.63) |
| Constant | 0.036*** (7.24) | 0.032*** (5.82) | 0.041*** (13.11) | 0.055*** (8.87) | 0.085*** (4.64) |
| Regional effects | Yes | Yes | No | Yes | |
| Time effects | No | No | Yes | Yes | |
| R2 | 0.2018 | 0.2057 | 0.2742 | 0.2971 | 0.2726 |
| Samples | 300 | 300 | 300 | 300 | 300 |
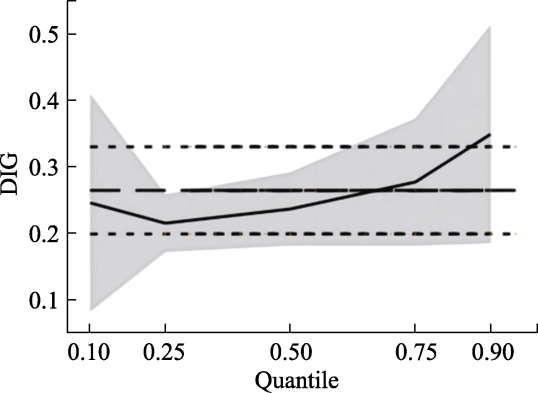
Fig. 2 Quantile regression trend of the impact of the digital economy on tourism industry structure optimizationNote: The horizontal axis of the figure is the number of interquartile points at an interval, the vertical axis is the digital economy regression coefficient, the solid line is the result of the interquartile regression estimation, the dotted line is the digital economy regression estimation, and the two dotted lines between them indicate the confidence interval of the regression value (with a confidence level of 95%), the figure shows the trend of the change in the coefficient of the impact of the digital economy. |
Table 7 Test of the threshold effect results |
| Threshold variables | Type of threshold test | Threshold | P | Crit10 | Crit5 | Crit1 | Confidence interval |
|---|---|---|---|---|---|---|---|
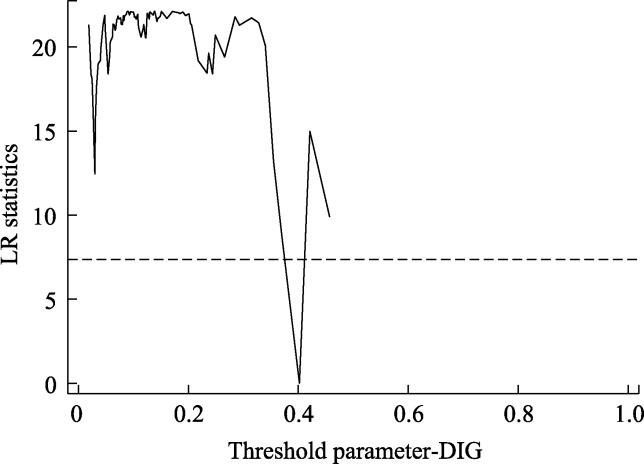
| DIG | Single threshold | 0.402 | <0.001 | 9.877 | 11.809 | 13.383 | [0.370, 0.421] |
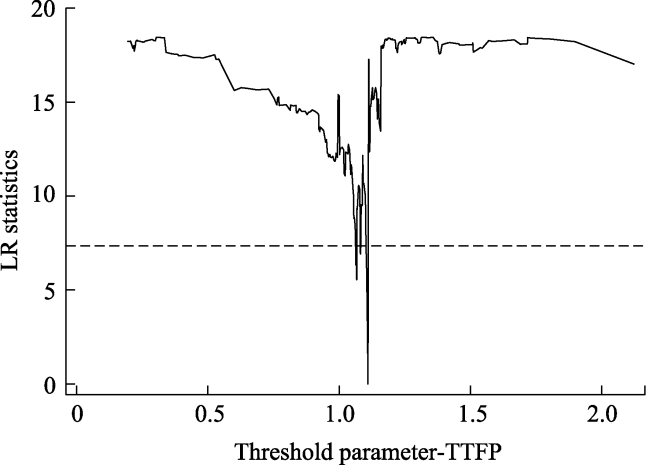
| TTFP | Single threshold | 1.110 | 0.003 | 9.511 | 11.189 | 14.723 | [1.105, 1.111] |
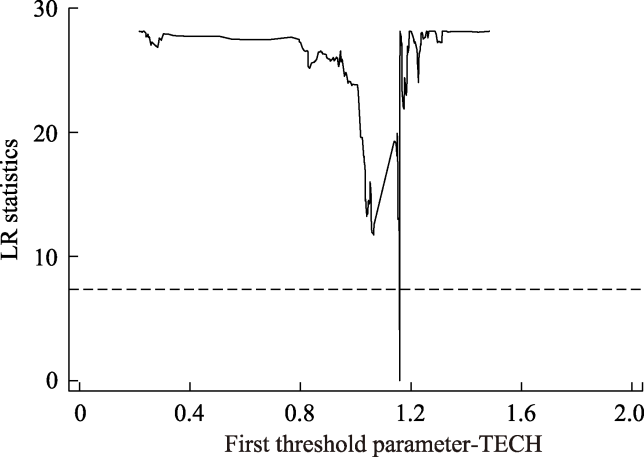
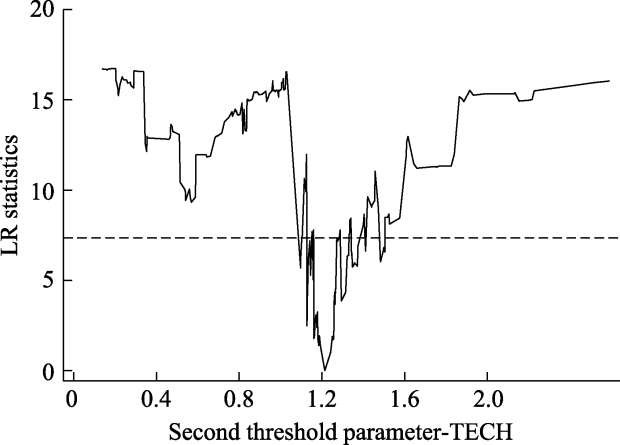
| TECH | Double threshold | 1.105 | 0.030 | 15.789 | 18.558 | 22.462 | [1.063, 1.111] |
| 1.160 | 0.067 | 10.484 | 13.062 | 20.213 | [1.590, 1.162] |
Note: P-values were obtained by repeated sampling 300 times using the Bootstrap method. |
Fig. 3 Threshold identification of DIG |
Fig. 4 Threshold identification of TTFP |
Fig. 5 First threshold identification of TECH |
Fig. 6 Second threshold identification of TECH |
Table 8 Regression results of the threshold effect model |
| Single threshold variable | Estimated value I | Double threshold variable | Estimated value III |
|---|---|---|---|
| 0≤DIG≤0.402 | 0.088 *** (1.8) | 0≤TECH≤1.105 | 0.142** (2.08) |
| DIG>0.402 | 0.263*** (4.58) | 1.105≤TECH> 1.160 | 0.613*** (12.36) |
| Single threshold variable | Estimated value II | TECH≥1.160 | 0.194*** (3.79) |
| 0≤TTFP≤1.110 | 0.098** (2.25) | ||
| TTFP>1.110 | 0.214*** (4.51) | ||
| Controls | Yes | Controls | Yes |
| F-statistic | 6.35 | F-Statistic | 3.52 |
Table 9 Robustness test results |
| Variables | One period behind I | Replacement of core explanatory variables II | Instrumental variable approach | |
|---|---|---|---|---|
| First-stage III | Second phase IV | |||
| L-DIG | 0.231** (2.07) | |||
| Z-DIG | 0.245*** (2.92) | |||
| DX | 0.881** (2.20) | |||
| DIG | 0.781* (1.69) | |||
| Regional effects | Yes | Yes | Yes | Yes |
| Time effects | Yes | Yes | Yes | Yes |
| Controls | Yes | Yes | Yes | Yes |
| Constant | 0.033** (2.67) | 0.050*** (5.09) | ‒0.162* (‒1.70) | ‒0.140 (‒1.30) |
| Samples | 300 | 300 | 300 | 300 |
| R2 | 0.6680 | 0.6500 | 0.4243 | 0.4975 |
Table 10 Test results of indirect transmission mechanism of digital economy on tourism industry structure optimization |
| Variables | Dependent variable (TIS) | |||||||
|---|---|---|---|---|---|---|---|---|
| TTFP | TECH | PECH | SECH | |||||
| I | II | III | IV | V | VI | VII | VIII | |
| DIG | 0.185*** (3.27) | 0.007 (0.11) | 0.209*** (3.02) | 0.014 (0.23) | 0.051** (1.80) | 0.011 (0.18) | ‒0.063* (‒2.01) | ‒0.005 (‒0.07) |
| TTFP | 0.120** (2.30) | |||||||
| TECH | 0.107** (2.24) | |||||||
| PECH | 0.373*** (3.16) | |||||||
| SECH | ‒0.208** (‒2.13) | |||||||
| Controls | Yes | Yes | Yes | Yes | Yes | Yes | Yes | Yes |
| Constant | 1.234*** (5.11) | 1.982* (7.95) | 1.064*** (3.82) | ‒2.000*** (‒8.34) | 0.326 (3.64) | ‒2.008*** (‒8.72) | ‒0.143 (‒1.21) | ‒1.916*** (‒8.13) |
| Intermediary effect | Remain | Remain | Remain | Remain | ||||
| Percentage | 12.06% | 12.15% | 10.33% | 7.12% | ||||
| Sobel-Z | 2.013** | 1.666* | 1.266 | 0.095 | ||||
| R2 | 0.3169 | 0.5538 | 0..3263 | 0.5539 | 0.1230 | 0.5602 | 0.2017 | 0.4955 |
| Samples | 300 | 300 | 300 | 300 | 300 | 300 | 300 | 300 |
Table 11 Regional heterogeneity test results of the digital economy on the optimization of tourism industry structure |
| Variables | I | II | III | IV | V | VI | VII | VIII |
|---|---|---|---|---|---|---|---|---|
| DIG | 0.189** (2.76) | 0.250*** (3.20) | ‒0.196 (‒1.47) | 0.265 (0.88) | 0.146** (2.94) | 0.228 (1.64) | 0.174** (2.50) | 0.144 (1.50) |
| GOV | 0.271 (1.55) | 0.007 (0.75) | 0.391** (2.66) | 0.168 (0.67) | 0.100 (1.11) | 0.010 (0.26) | 0.131 (0.78) | 0.018 (0.65) |
| ED | 0.115 (1.39) | 0.256** (2.55) | 0.125 (1.32) | ‒0.030 (‒0.19) | 0.091 (1.25) | 0.099 (1.16) | 0.183* (1.81) | 0.019 (0.34) |
| RES | ‒0.125 (‒1.96) | ‒0.107 (‒1.25) | 0.057 (0.91) | 0.066 (0.29) | ‒0.070 (‒1.44) | 0.085* (1.94) | ‒0.010 (‒0.16) | 0.014 (0.43) |
| HUM | ‒0.009 (‒0.51) | ‒0.026 (‒1.18) | 0.006 (0.15) | 0.253 (0.99) | ‒0.018 (‒1.06) | ‒0.023 (‒0.88) | ‒0.013 (‒0.68) | ‒0.049 (‒2.19) |
| TD | 0.024 (0.16) | ‒0.126 (1.50) | ‒0.050 (0.84) | 0.399 (1.48) | 0.021 (0.18) | ‒0.024 (‒0.45) | ‒0.012 (‒0.16) | ‒0.003 (‒0.05) |
| Constant | 0.025 (0.88) | 0.020 (0.70) | 0.042** (2.55) | ‒0.066 (‒0.79) | 0.050 (2.55) | 0.051*** (3.42) | 0.032 (1.20) | 0.070*** (5.92) |
| Regional effects | Yes | Yes | Yes | Yes | Yes | Yes | Yes | Yes |
| Time effects | Yes | Yes | Yes | Yes | Yes | Yes | Yes | Yes |
| Samples | 100 | 60 | 110 | 30 | 150 | 150 | 150 | 150 |
| F-Statistic | 6.23 | 6.04 | 6.39 | 7.02 | 9.72 | 5.26 | 7.48 | 7.86 |
Note: According to the regional development policy formulated by the State Council of China, the eastern region comprises 10 provinces, including Beijing and Tianjin; the central region comprises 6 provinces, including Shanxi and Henan; and the western region comprises 11 provinces, including Chongqing and Sichuan. The northeast region includes the provinces of Liaoning, Jilin, and Heilongjiang. Hong Kong, Macao, Taiwan, and Tibet were not considered due to their data being incomplete. The average value of the index of the digital economy development level and the index of tourism industry structure optimization of the 30 provinces from 2012 to 2021 were calculated and ranked. The top 15 provinces were regions with high digital economy development and high optimization of the tourism industry structure; the bottom 15 provinces were regions with low digital economy development and low optimization of the tourism industry structure. |
| [1] |
|
| [2] |
|
| [3] |
|
| [4] |
|
| [5] |
|
| [6] |
|
| [7] |
|
| [8] |
|
| [9] |
|
| [10] |
|
| [11] |
|
| [12] |
|
| [13] |
|
| [14] |
|
| [15] |
|
| [16] |
|
| [17] |
|
| [18] |
|
| [19] |
|
| [20] |
|
| [21] |
|
| [22] |
|
| [23] |
|
| [24] |
|
| [25] |
|
| [26] |
|
| [27] |
|
| [28] |
|
| [29] |
|
| [30] |
|
| [31] |
|
| [32] |
|
| [33] |
|
| [34] |
|
| [35] |
|
| [36] |
|
| [37] |
|
| [38] |
|
| [39] |
|
| [40] |
|
| [41] |
|
| [42] |
|
| [43] |
|
| [44] |
|
| [45] |
|
/
| 〈 |
|
〉 |