
Journal of Resources and Ecology >
How Taobao Village Empowers New Urbanization: Understanding the Mechanisms and Paths
|
PANG Xinsheng, E-mail: pxinsheng@bjfu.edu.cn |
Received date: 2023-12-15
Accepted date: 2024-04-30
Online published: 2024-12-09
Supported by
The Ministry of Agriculture of China Scientific Research Project(08200127)
The proliferation of new digital villages, exemplified by Taobao villages, is profoundly influencing production, livelihoods, urban-rural relations, and overall life within contemporary Chinese villages and catalyzing the process of new urbanization. This study comprehensively examines the intricate interplay among Taobao village, mobile Internet, and the paradigm of new urbanization. It contends that a Taobao village stands as a quintessential emblem of new urbanization, with grassroots entrepreneurs actively engaging in both domestic and global production and consumption networks facilitated by information technologies. This engagement effectively transcends traditional spatial constraints, thereby reshaping the status, scale, and functionality of villages. Moreover, Taobao village emerges as a pragmatic solution to the lingering challenges of conventional urbanization, uniquely positioned to guide China’s transition into the new stage of developmental and facilitate its rural revitalization strategy. Furthermore, employing panel data on 31 provinces and cities from 2013 to 2021, this study systematically investigates the through which Taobao villages influence the trajectory of new urbanization. The results reveal that Taobao villages directly and substantially help elevate urbanization levels. Furthermore, mobile Internet penetration mediates this influence. Intriguingly, the influence of Taobao villages on urbanization exhibits conspicuous regional disparities and spatial diffusion patterns. As such, efforts to enhance integration, interaction, and complementary synergies among regional Taobao villages should be contingent upon the specific contextual nuances and local conditions.
Key words: Taobao village; mobile internet; new urbanization
PANG Xinsheng , ZHUO Wenjun , JI Yuguo . How Taobao Village Empowers New Urbanization: Understanding the Mechanisms and Paths[J]. Journal of Resources and Ecology, 2024 , 15(6) : 1618 -1630 . DOI: 10.5814/j.issn.1674-764x.2024.06.018
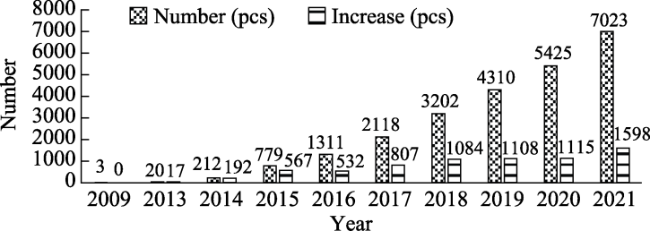
Fig. 1 The number of Taobao villages in China during the 2009-2021 |
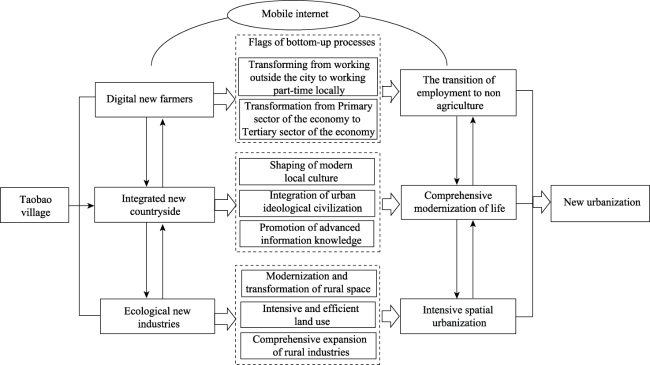
Fig. 2 Development model between Taobao village and new urbanization |
Fig. 3 The regulation mechanism of Mobile Internet between Taobao village and urbanization paths |
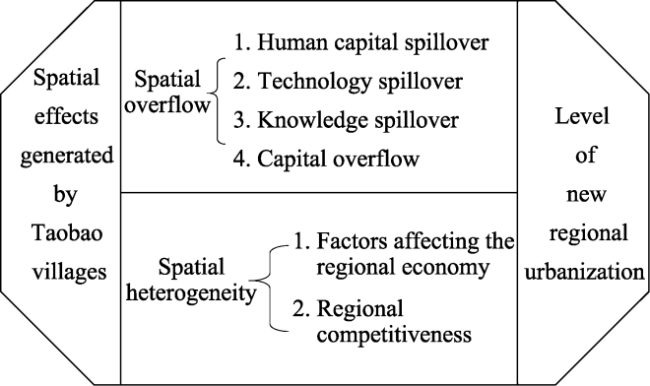
Fig. 4 Spatial effects of Taobao villages on the level of new urbanization |
Table 1 Variable descriptions |
| Indicator type | Variable selection | Specific indicators | Calculation method | Indicator meaning |
|---|---|---|---|---|
| Dependent variable | Urbanization level | Regional urbanization rate | The ratio of urban population to total population | The level of urbanization in various regions |
| Explanatory variable | Development level of Taobao villages | Number of Taobao villages in the region | Number of Taobao villages | The development level of Taobao villages in various regions |
| Moderating variable | Mobile Internet | Mobile Internet penetration rate | Regional mobile internet penetration rate | The development level of the Internet in various regions |
| Control variables | Economic development level | Per capita GDP | Per capita GDP | The impact of economic development level on urbanization |
| Industrial development level | Proportion of output value of the secondary sector of the economy | GDP of the secondary sector of the economy/Gross regional product | The impact of industrial development on urbanization | |
| Proportion of output value of the tertiary sector of the economy | GDP of the tertiary sector of the economy/Gross regional product | |||
| Employment proportion of the secondary industry of the economy | Secondary sector employment /total regional employment | |||
| Employment proportion of the tertiary sector of the economy | Tertiary sector employment/total regional employment | |||
| Population migration | Income gap between urban and rural residents | Per capita disposable income of urban residents - per capita disposable income of rural residents | The impact of population migration on urbanization | |
| Urban registered unemployment rate | Urban registered unemployment/total employment in the region | |||
| Technological education level | Ratio of education, science, culture, and health expenditure to local financial expenditures | Expenditure on education, science, culture, and health/total expenditure of local finance | The impact of technological development and educational foundation on urbanization | |
| Number of college students in the region | Number of degrees awarded to regular undergraduate and vocational students in higher education institutions | |||
| Infrastructure level | Per capita social fixed assets investment | Regional social fixed assets investment/regional total population | The impact of infrastructure construction on urbanization The impact of marketization on urbanization. | |
| Highway mileage | Highway mileage | |||
| Institutional environment | Commercialization rate of agricultural products | Regional agricultural product volume/total regional agricultural product output | The impact of population density on urbanization | |
| Population density situation | The proportion of urban population per unit urban area | Regional urban population/urban area | The impact of infrastructure construction on urbanization |
Table 2 Descriptive statistics |
| Variable name | Symbol | Observations | Mean | Standard deviation | Minimum | Maximum | Unit |
|---|---|---|---|---|---|---|---|
| Urbanization rate | urb | 279 | 61.236 | 12.042 | 26.230 | 89.300 | % |
| Number of Taobao villages | tbc | 279 | 115.265 | 319.421 | 0.000 | 2426.000 | Count |
| Mobile internet | net | 279 | 59.091 | 11.649 | 34.100 | 90.883 | % |
| Per capita GDP | lnC1 | 279 | 10.994 | 0.416 | 10.172 | 12.173 | |
| Proportion of output value of the secondary sector of the economy | C2 | 279 | 39.733 | 7.963 | 15.713 | 54.100 | % |
| Proportion of output value of the tertiary sector of the economy | C3 | 279 | 50.966 | 8.636 | 35.400 | 84.150 | Log of currency unit |
| Employment proportion of the secondary sector of the economy | C4 | 279 | 24.859 | 7.890 | 11.334 | 44.764 | % |
| Employment proportion of the tertiary sector of the economy | C5 | 279 | 48.706 | 8.504 | 33.482 | 81.076 | % |
| Income gap between urban and rural residents | lnC6 | 279 | 9.971 | 0.259 | 9.406 | 10.853 | Log of currency difference |
| Urban registered unemployment rate | C7 | 279 | 0.013 | 0.007 | 0.005 | 0.049 | % |
| Ratio of education, science, culture, and health expenditure to local financial expenditures | C8 | 279 | 0.281 | 0.042 | 0.176 | 0.388 | % |
| Number of college students in the region | lnC9 | 279 | 11.435 | 0.951 | 8.478 | 12.681 | Log of count |
| Per capita social fixed assets investment | C10 | 279 | 5.082 | 1.821 | 1.129 | 9.758 | Currency unit |
| Highway mileage | lnC11 | 279 | 11.730 | 0.840 | 9.466 | 12.898 | Log of kilometers |
| Commercialization rate of agricultural products | C12 | 279 | 0.048 | 0.078 | 0.000 | 0.425 | % |
| Urban population density | C13 | 279 | 0.502 | 0.235 | 0.093 | 1.233 | People per unit area |
Table 3 Benchmark regression results |
| Variables | Model 1 | Model 2 | Model 3 | Model 4 | Variables | Model 1 | Model 2 | Model 3 | Model 4 |
|---|---|---|---|---|---|---|---|---|---|
| tbc | 0.006* | 0.017** | C8 | -5.988 | -3.791 | ||||
| (0.000) | (0.016) | (5.016) | (4.805) | ||||||
| net | 0.301*** | 0.152*** | lnC9 | 10.613*** | 9.160*** | ||||
| (0.028) | (0.033) | (2.448) | (2.393) | ||||||
| lnC1 | 0.297 | -2.104 | C10 | 0.441*** | 0.401*** | ||||
| (2.296) | (2.117) | (0.088) | (0.086) | ||||||
| C2 | -0.132* | 0.043 | lnC11 | 9.885*** | 3.416 | ||||
| (0.079) | (0.080) | (2.625) | (2.735) | ||||||
| C3 | -0.172** | -0.035 | C12 | -3.591 | 0.367 | ||||
| (0.074) | (0.075) | (3.039) | (2.911) | ||||||
| C4 | 78.640*** | 58.443*** | C13 | 0.066 | 1.755 | ||||
| (11.781) | (12.474) | (1.156) | (1.123) | ||||||
| C5 | 98.936*** | 69.615*** | _cons | 50.055*** | 37.924*** | -5.811 | -3.587 | ||
| (10.711) | (9.428) | (0.471) | (1.195) | (6.679) | (6.598) | ||||
| lnC6 | 11.208* | 7.825 | Pro | Yes | Yes | Yes | Yes | ||
| (6.417) | (6.263) | Year | Yes | Yes | Yes | Yes | |||
| C7 | 6.885 | -3.940 | N | 279 | 279 | 279 | 279 | ||
| (19.163) | (18.705) | R2 | 0.991 | 0.994 | 0.996 | 0.996 |
Note: *, **, and *** indicate significance at the 10%, 5%, and 1% levels, respectively. Robust standard errors are in parentheses. |
Table 4 Moderating effect results |
| Variables | Model 5 | Model 6 | Model 7 | Variables | Model 5 | Model 6 | Model 7 |
|---|---|---|---|---|---|---|---|
| tbc×net | 0.007** | 0.021** | 0.042*** | lnC9 | 10.587*** | 10.587*** | |
| (0.000) | (0.014) | (0.033) | (2.462) | (2.462) | |||
| lnC1 | 0.138 | 0.138 | C10 | 0.450*** | 0.450*** | ||
| (2.302) | (2.302) | (0.089) | (0.089) | ||||
| C2 | -0.127 | -0.127 | lnC11 | 9.821*** | 9.821*** | ||
| (0.079) | (0.079) | (2.636) | (2.636) | ||||
| C3 | -0.170** | -0.170** | C12 | -3.237 | -3.237 | ||
| (0.074) | (0.074) | (3.028) | (3.028) | ||||
| C4 | 79.661*** | 79.661*** | C13 | 0.101 | 0.101 | ||
| (11.781) | (11.781) | (1.161) | (1.161) | ||||
| C5 | 98.565*** | 98.565*** | _cons | 50.044*** | -152.934*** | -152.830*** | |
| (10.966) | (10.966) | (0.469) | (30.239) | (30.238) | |||
| lnC6 | 11.001* | 11.001* | Pro | Yes | Yes | Yes | |
| (6.446) | (6.446) | Year | Yes | Yes | Yes | ||
| C7 | 7.098 | 7.098 | N | 279 | 279 | 279 | |
| (19.207) | (19.207) | R2 | 0.991 | 0.996 | 0.996 | ||
| C8 | -6.430 | -6.430 | |||||
| (5.073) | (5.073) |
Note: *, **, and *** indicate significance at the 10%, 5%, and 1% levels, respectively. Robust standard errors are in parentheses. |
Table 5 Endogeneity test results |
| Variables | No control variable | Adding control variables |
|---|---|---|
| tbc×net | 0.016*** | 0.011*** |
| Pro | Yes | Yes |
| Year | Yes | Yes |
| N | 248 | 248 |
| R2 | 0.980 | 1.000 |
| F | 202.52 | 144 |
Note: *, **, and *** indicate significance at the 10%, 5%, and 1% levels, respectively. |
Table 6 Robustness test results |
| Test variable | Winsorizing at 1% for both extremes | Excluding municipalities directly under the central government | ||
|---|---|---|---|---|
| No control variable | Adding control variables | No control variable | Adding control variables | |
| X | 0.017*** | 0.010*** | 0.007*** | 0.004** |
| Pro | Yes | Yes | Yes | Yes |
| Year | Yes | Yes | Yes | Yes |
| N | 247 | 247 | 243 | 243 |
| R2 | 0.992 | 0.997 | 0.980 | 0.985 |
| F | 210.49 | 128.40 | 233.22 | 264.80 |
Note: *, **, and *** indicate significance at the 10%, 5%, and 1% levels, respectively. |
Table 7 Heterogeneity test results by region |
| Variables | Eastern region | Central region | Western region |
|---|---|---|---|
| tbc×net | 0.021*** | 0.015*** | 0.000 |
| (0.033) | (0.027) | (0.000) | |
| lnC1 | 3.180* | -4.036* | 8.679*** |
| (1.844) | (2.193) | (2.714) | |
| C2 | -0.063 | 0.560*** | -0.128 |
| (0.062) | (0.154) | (0.096) | |
| C3 | -0.094 | 0.484*** | -0.145 |
| (0.058) | (0.163) | (0.100) | |
| C4 | 51.949** | -1.761 | -6.827 |
| (19.772) | (20.350) | (20.837) | |
| C5 | 98.301*** | 184.172*** | -47.726*** |
| (15.454) | (19.520) | (17.827) | |
| lnC6 | -11.473* | -10.792 | 24.270*** |
| (6.189) | (11.292) | (5.929) | |
| C7 | 33.530** | -23.429 | 32.637 |
| (12.446) | (15.528) | (38.754) | |
| C8 | -5.983 | 7.963* | 17.410*** |
| (4.651) | (4.255) | (4.995) | |
| lnC9 | 5.333 | -3.899 | 6.676*** |
| (4.331) | (4.977) | (2.066) | |
| C10 | 0.668*** | 0.275** | -0.152 |
| (0.088) | (0.107) | (0.112) | |
| lnC11 | -1.670 | -6.210 | -26.531*** |
| (2.104) | (4.672) | (3.180) | |
| C12 | -2.501 | 4.868** | 6.367 |
| (3.454) | (2.293) | (6.775) | |
| C13 | 2.314** | -2.599 | 0.303 |
| (1.112) | (2.219) | (0.836) | |
| _cons | 14.206 | 0.930 | 30.921 |
| (35.448) | (53.024) | (31.087) | |
| Pro | Yes | Yes | Yes |
| Year | Yes | Yes | Yes |
| N | 72 | 99 | 108 |
| R2 | 0.997 | 0.983 | 0.971 |
Note: *, **, and *** indicate significance at the 10%, 5%, and 1% levels, respectively. Robust standard errors are in parentheses. |
Table 8 Spatial spillover effects of Taobao villages on the level of new urbanization |
| Variables | x | Wx | Direct effect | Indirect effect | Aggregate effect |
|---|---|---|---|---|---|
| tbc | 1.057*** | 1.157*** | 2.052*** | 1.223** | -0.830 |
| (0.0954) | (0.0918) | (0.105) | (0.532) | (0.590) | |
| lnC1 | 0.531*** | 0.514*** | 0.496*** | -0.480*** | 0.0164 |
| (0.0790) | (0.0721) | (0.0713) | (0.104) | (0.0996) | |
| C2 | 0.114 | 0.0989 | 0.0533 | -0.705 | -0.652 |
| (0.0738) | (0.0723) | (0.0854) | (0.432) | (0.482) | |
| C3 | 0.324*** | 0.302*** | 0.273*** | -0.548* | -0.274 |
| (0.0750) | (0.0706) | (0.0743) | (0.317) | (0.343) | |
| C4 | 1.524*** | 1.499*** | 1.575*** | 0.480 | 2.055** |
| (0.247) | (0.233) | (0.241) | (0.867) | (0.938) | |
| C5 | -0.0899 | -0.0847 | 0.0779 | 0.135 | 0.0567 |
| (0.0672) | (0.0742) | (0.108) | (0.642) | (0.734) | |
| lnC6 | 0.219*** | 0.0208 | 0.243*** | -0.255 | 0.498** |
| (0.0591) | (0.0960) | (0.0596) | (0.199) | (0.224) | |
| C7 | -1.161*** | -1.189*** | -1.137*** | -1.212*** | -1.0748* |
| (0.0491) | (0.0486) | (0.0441) | (0.0524) | (0.0429) | |
| C8 | -0.144*** | 0.0921 | 0.141*** | 0.0259 | -0.115 |
| (0.0456) | (0.0798) | (0.0487) | (0.174) | (0.197) | |
| lnC9 | 0.0319 | 0.0714 | 1.0515 | 0.205 | 0.257* |
| (0.0463) | (0.0723) | (0.0434) | (0.136) | (0.143) | |
| C10 | 0.441*** | -0.461** | 0.409*** | -0.437 | -0.0282 |
| (0.154) | (0.183) | (0.148) | (0.315) | (0.347) | |
| lnC11 | 0.0133 | 0.304*** | 0.0731 | 0.683** | 0.756** |
| (0.0420) | (0.107) | (0.0573) | (0.269) | (0.314) | |
| C12 | 0.107*** | 0.0102 | 0.143*** | 0.055 | 0.234** |
| (0.0221) | (0.0060) | (0.0596) | (0.111) | (0.124) | |
| C13 | 0.217 | 0.389 | 0.333 | 0.705 | 0.652** |
| (0.138) | (0.123) | (0.154) | (0.432) | (0.482) | |
| Pro | Yes | Yes | Yes | Yes | Yes |
| Year | Yes | Yes | Yes | Yes | Yes |
| ρ | 0.4195*** | ||||
| (0.0474) | |||||
| N | 651 | ||||
| R2 | 0.175 |
Note: *, **, and *** indicate significance at the 10%, 5%, and 1% levels, respectively. Robust standard errors are in parentheses. x is the original effect of independent variables; Wx is the spatial lag effect of independent variables, representing the impact of spatial spillover effects. |
| [1] |
|
| [2] |
|
| [3] |
|
| [4] |
|
| [5] |
|
| [6] |
|
| [7] |
|
| [8] |
|
| [9] |
|
| [10] |
|
| [11] |
|
| [12] |
|
| [13] |
|
| [14] |
|
| [15] |
|
| [16] |
|
| [17] |
|
| [18] |
|
| [19] |
|
| [20] |
|
| [21] |
|
| [22] |
|
| [23] |
|
| [24] |
|
| [25] |
|
| [26] |
|
| [27] |
|
| [28] |
|
| [29] |
|
| [30] |
|
| [31] |
|
| [32] |
|
| [33] |
|
/
| 〈 |
|
〉 |
