Resource Utilization and Green Development

Evaluation of the Green Development Level and Its Dynamic Changes in Qinghai Province

  • LIU Yexuan , 1, 2 ,
  • ZHEN Lin , 1, 2, * ,
  • XIAO Yu 1, 2
Expand
  • 1. Institute of Geographic Sciences and Natural Resources Research, Chinese Academy of Sciences, Beijing 100101, China
  • 2. School of Resource and Environment, University of Chinese Academy of Sciences, Beijing 100049, China
* ZHEN Lin, E-mail:

LIU Yexuan, E-mail:

Received date: 2023-12-11

  Accepted date: 2024-02-10

  Online published: 2024-12-09

Supported by

The Major Project of the National Social Science Fund of China(20&ZD096)

Abstract

Realizing comprehensive green transformation is the necessary path for high-quality and sustainable development in Qinghai Province. We constructed an indicator system for evaluating the green development in Qinghai from five dimensions: resource utilization, environmental protection, ecological protection, growth quality, and green life based on the national green development indicator system; and comprehensively used the entropy method, comprehensive index method, coupled coordination model, and obstacle degree model to evaluate the green development level of Qinghai from 1998 to 2022. The results showed four important points. (1) The green development comprehensive index of Qinghai increased gradually in the past 25 years, but there is still much room for improvement. (2) The focus of green development changed in the three evaluation stages. The focus in 1998-2004 and 2005-2011 was on improving the ecological environment, and in 2012-2022 the focus was on economic and industrial development and the improvement of residents’ living standards. (3) Since 2001, the coupling degree of the five dimensions of green development has maintained a high-level coupling stage, and the coordinated development degree entered a good coordination stage in 2021. (4) The key obstacles hindering the improvement of green development level shifted from growth quality to resource utilization and ecological protection. Therefore, improving the resource utilization level is the primary task for Qinghai to achieve high-quality green development. The study provides methodological support for green development evaluation, and suggestions for directing the formulation of green development policies in Qinghai Province.

Cite this article

LIU Yexuan , ZHEN Lin , XIAO Yu . Evaluation of the Green Development Level and Its Dynamic Changes in Qinghai Province[J]. Journal of Resources and Ecology, 2024 , 15(6) : 1433 -1447 . DOI: 10.5814/j.issn.1674-764x.2024.06.004

1 Introduction

Green development is a development model characterized by high resource utilization efficiency, low environmental pollution, and a high environmental governance level. Green development was derived from a series of concepts such as green growth, green economy, low-carbon economy, and sustainable development (Bartelmus, 2013). The Nordic countries have achieved a high level of green development, and the governments of these countries played an active role in supporting technological innovation, promoting coopera-tion among social actors, and ensuring social welfare (Khan et al., 2021). Among the Nordic countries, Norway incorporated green GDP accounting into natural resource accounting as early as 1987 (Alfsen and Greaker, 2007). Sweden, Finland, and Denmark achieved green growth in 2018 based on a carbon productivity analysis (Stoknes and Rockström, 2018). In addition, organizations such as the Organization for Economic Co-operation and Development (OECD), United Nations Environment Programme, and World Bank have also conducted evaluations of green development (Stoknes and Rockström, 2018; Wang et al., 2020). The OECD countries have adopted many approaches to promote green development. For example, the “Optimal Method Planning for Sustainable Development of Mining Industry” implemented in Australia aimed to protect biodiversity through participatory decision-making and the establishment of mutually beneficial community partnerships. The scientific management of water resources in Canada from the federal government to grassroots communities was achieved through the policy implementation of water resource utilization and protection. Australia implemented the “Cleaner Production Education and Training Program” to promote the green skills of practitioners (Zhen et al., 2013).
In 2016, the National Development and Reform Commission of China issued the “Green Development Indicator System”, and the evaluation of green development gradually became a research hotspot. Scholars have made progress in the construction of the green development indicator system, and the spatiotemporal analysis of the green development level (Wang, 2018; Rüstemoglu, 2019; Zeng and Gu, 2023). Most of the constructed index-based green development evaluation indicator systems mainly involve ecological, economic, and social indicators (Wang et al., 2018a; Shu et al., 2021; Liu et al., 2022). Indicator weights are often assigned according to the importance of each indicator (Cheng and Ge, 2020; Han et al., 2022; Xu et al., 2022). Some studies have used methods such as principal component analysis (Xiong et al., 2023), analytic hierarchy processes (Chen et al., 2016), and dynamic weighting of indicators to determine indicator weights (Li, 2021). The ultimate goal of green development indicator evaluation is to identify the factors which act as obstacles and propose targeted solutions. However, the existing studies focused on the construction of indicator systems and the selection of evaluation methods (Hu and Zhou, 2014; Fang, 2021; Li et al., 2022) mostly reflect changes in the green development level in only a few years (Liu and Chang, 2016; Ling, 2023), but have not evaluated the changes in the long term, and there are few studies on the factors influencing green development (Wang and Gao, 2016; Sun et al., 2023).
Qinghai Province is an ecologically fragile area and an important ecological security barrier in China, and it officially proposed the “Ecological Province” strategy in 2008. Its unique ecological status determines that ecological priority is the first principle in the development process. Chinese policymakers emphasized the importance of adhering to the ecological priority and pursuing a green development path in Qinghai. As China enters a new development stage, the ecological security and resource security of Qinghai have become more important, necessitating a comprehensive evaluation of its development levels of resources, environment, ecology, economy, and society (Zhao et al., 2011; Zheng et al., 2013). Formulating the green development evaluation standard scientifically and rationally and evaluating the green development level of Qinghai have become urgent issues to be addressed.
Therefore, we proposed four research goals in this study: 1) Constructing a regionally targeted evaluation system for green development indicators; 2) Scientifically evaluating the level of green development in Qinghai; 3) Determining the coupling coordination degree of the green development indicator system in Qinghai; and 4) Identifying the key obstacles that restrict the improvement of the green development level in Qinghai. Here, we adjusted the indicator system based on the “Green Development Indicator System” formulated by the National Development and Reform Commission and the ecological environment and socio-economic development of Qinghai. These adjustments allowed us to make a targeted evaluation of the green development level trends in Qinghai and to explore its coordination and obstacles, thereby providing a basis for the formulation of policies related to promoting green development.

2 Materials and methods

2.1 Study area

Qinghai Province has abundant natural resources and is of great importance for the development of the western region in China. It is the province where the Yangtze River, Yellow River, and Lancang River originate, serving as a vital water source for humans and animals that is known as the “Three Rivers Source” and the “Water Tower of China”. Qinghai is one of the four major pastoral areas in China, with a grassland area accounting for 56.29% (Fig. 1), providing superior conditions for animal husbandry production. Its animal products mainly include wool, cashmere, dairy products, beef, mutton, and others. The cropland area has been continuously decreasing in recent years, only accounting for 1.24%, with crops mainly consisting of spring wheat, barley, and rapeseed. The Tsaidam Basin in the northwestern part of the province is rich in traditional energy sources such as oil, natural gas, and salt lake resources, as well as new energy sources such as solar, photovoltaic, and wind energy. Relying on the advantages of these natural resources, Qinghai has developed four pillar industries, including hydropower, oil and gas, salt, and non-ferrous metals.
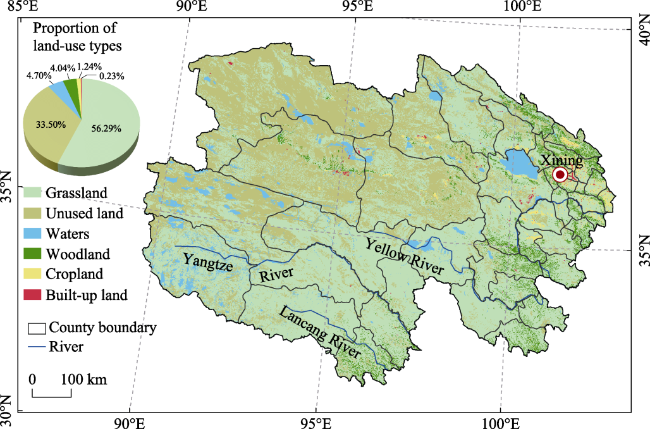
Fig. 1 Land-use types in Qinghai Province
With the implementation of eco-environmental protection policies over the past two decades, the ecological environment of Qinghai has been significantly improved. In 2022, the ecological condition was mainly rated as “good” based on a comprehensive evaluation of biological abundance, vegetation coverage, water network density, land stress, and pollution load index. The water quality and air quality in Qinghai were both better than the national average. The water quality of the national and provincial controlled water quality monitoring sections was excellent, and the proportion of good air quality days was 96.40%. To promote the comprehensive green transformation of economic and social development, the “14th Five-Year Plan for Energy Conservation and Emission Reduction in Qinghai Province” specified that the dual control policy of energy consumption and the control system of total pollutant emission should be strictly implemented, and energy conservation and emission reduction should be integrated into industrial development and the residents’ lives. In addition, the quality of economic development in Qinghai has continuously improved, and people’s living standards are climbing higher and higher. In 2022, the GDP was 361 thousand million yuan and the per capita GDP was 60724 yuan, with the added values of the primary, secondary, and tertiary industries accounting for 10.5%, 43.9%, and 45.6% of GDP, respectively.

2.2 Methods

2.2.1 Indicator system construction

The construction of the green development indicator system was mainly based on the 56 indicators outlined in the “Green Development Indicator System” formulated by the National Development and Reform Commission, the National Bureau of Statistics, the Ministry of Ecology and Environment of the People’s Republic of China, and the Organization Department of the Central Committee of the CPC in 2016 (NDRC, 2016). The selection of indicators followed three principles. Firstly, it must be systematic, that is, indicators should complement each other and fully reflect the integrity and coordination of the ecological environment in Qinghai. Secondly, it must be representative, ensuring that the indicators fully represent the ecological characteristics of Qinghai and reflect the effectiveness of ecological environment protection, and excluding indicators with low relevance to the ecological environment in Qinghai. Thirdly, the data must be available, which requires replacing indicators for which annual data are difficult to obtain and supplementing missing data for a few years using linear interpolation.
The determination of the indicators went through three rounds of expert discussions, during which we fully considered the suggestions of experts from Qinghai in the field of the ecological environment and from relevant institutions in Beijing. The participating institutions included the Ecological Environment Planning and Environmental Protection Technology Center of Qinghai Province, Qinghai Normal University, Chinese Academy of Sciences, Beijing Normal University, and the Forest and Grassland Survey and Planning Institute of the National Forestry and Grassland Administration.
The first round of discussions determined three dimensions of indicators: “resource utilization”, “growth quality” and “green life”. A total of 28 indicators were selected from seven aspects, including energy utilization, water resource utilization, land resource utilization, GDP, household income, energy conservation and emission reduction, and a livable life. The second round of discussions added two dimensions of indicators, namely “environmental protection” and “ecological protection”. This resulted in a total of 40 indicators, including the indicators from the first round. Considering the ecological environment and socio-economic development in Qinghai, eight indicators with low relevance were excluded, including “effective utilization coefficient of farmland irrigation water”, “per capita energy consumption reduction rate of public institutions”, “proportion of green buildings in new urban construction”, and five others. Thus, the number of indicators was reduced from 40 to 32. In the third round of discussions, four indicators with annual data that are difficult to obtain were replaced with similar indicators. Specifically, the indicator “cropland area” was used in place of “cropland retention area”, “proportion of good air quality days in Xining City” was substituted for “proportion of good air quality days in cities at or above the prefecture level”, “wetland area” replaced “wetland protection rate”, and “number of public transportation vehicles per ten thousand urban population” was used instead of “public transportation passenger volume per ten thousand urban population”. Finally, we constructed the green development evaluation indicator system of Qinghai consisting of five dimensions: “resource utilization”, “environmental protection”, “ecological protection”, “quality of growth” and “green life”, encompassing a total of 32 indicators (Table 1).
Table 1 Indicator system for green development evaluation in Qinghai Province
Dimension No. Indicator Unit Type Attribute Weight
1. Resource utilization
(Weight=0.2589)
I1 Total energy consumption 104 tce Negative 0.0450
I2 Reduction rate of energy consumption per GDP % Positive 0.0111
I3 Reduction rate of CO2 emissions per GDP % Positive 0.0092
I4 Total water consumption 108 m3 Negative 0.0161
I5 Reduction rate of water consumption per GDP % Positive 0.0340
I6 Reduction rate of water consumption per industrial value added % Positive 0.0077
I7 Cropland area 103 ha Positive 0.0627
I8 Newly added area of built-up land ha Negative 0.0154
I9 Reduction rate of built-up land area per GDP % Positive 0.0196
I10 Comprehensive utilization rate of general industrial solid waste % ρ Positive 0.0381
2. Environmental protection
(Weight=0.1368)
I11 Proportion of good air quality days in Xining City % Positive 0.0416
I12 Proportion of surface water at or better than Class III % Positive 0.0088
I13 Proportion of surface water of Inferior Class V % Negative 0.0102
I14 Reduction rate of chemical oxygen demand (COD) discharges % Positive 0.0065
I15 Harmless treatment rate of urban household waste % Positive 0.0185
I16 Centralized treatment rate of urban domestic sewage % Positive 0.0513
3. Ecological protection
(Weight=0.2564)
I17 Forest coverage rate % Positive 0.0327
I18 Forest stock volume 104 m3 Positive 0.0643
I19 Newly added area of artificial grass planting 103 ha ρ Positive 0.0654
I20 Wetland area 103 ha ρ Positive 0.0086
I21 Nature reserve area 104 ha ρ Positive 0.0207
I22 Newly added area of soil erosion control 103 ha ρ Positive 0.0646
4. Growth quality
(Weight=0.2599)
I23 Per capita GDP growth rate % Positive 0.0160
I24 Proportion of added value of the tertiary industry to GDP % Positive 0.0329
I25 Per capita disposable income of urban residents yuan person-1 Positive 0.0564
I26 Per capita disposable income of rural residents yuan person-1 Positive 0.0756
I27 Proportion of added value of strategic emerging industries to GDP % Positive 0.0568
I28 Proportion of research and experimental development (R&D)
expenditure to GDP
% Positive 0.0224
5. Green life
(Weight=0.0880)
I29 Number of public transportation vehicles per ten thousand urban
population
vehicles per ten
thousand people
ρ Positive 0.0160
I30 Green land rate in urban built-up areas % ρ Positive 0.0302
I31 Penetration rate of rural tap water % Positive 0.0172
I32 Penetration rate of rural sanitary toilets % ρ Positive 0.0245

Note: ★ represents the resource and environmental constraint indicators determined in the “Outline of the 13th Five-Year Plan for National Economic and Social Development”, ♦ represents the main monitoring and evaluation indicators proposed in the “Outline of the 13th Five-Year Plan for National Economic and Social Development” and the “Opinions of the Central Committee of the CPC and the State Council on Accelerating the Construction of Ecological Civilization”, and △ represents other important monitoring and evaluation indicators for green development. There are 11 (★), 13 (♦), and 8 (△) indicators for these three types of indicators.

2.2.2 Indicator weight setting

The total weight of all the green development evaluation indicators was set to 1, and the weight allocations for each indicator were calculated using the entropy method. This method could eliminate the influences of subjective factors on weight setting, with the weight depending on the degree of dispersion of indicator values. The greater the difference in indicator values, the higher the weight. The weights of the five dimensions of “resource utilization”, “environmental protection”, “ecological protection”, “growth quality”, and “green life” were 0.2589, 0.1368, 0.2564, 0.2599, and 0.0880, respectively (Table 1). The entropy method was calculated in the following steps.
(1) Indicator standardization
This standardization aimed to eliminate differences in units, values, and attributes among the indicators. The indicator attributes were determined based on their functions and effects. Positive indicators are positively correlated with the level of green development, while negative indicators are negatively correlated. Our system included 28 positive indicators and four negative indicators (Table 1).
Standardization of positive indicators:
X i j = x i j M i n x i j M a x x i j M i n x i j
Standardization of negative indicators:
X i j = Max x i j x i j Max x i j Min x i j
where X i j is the standardized value of the j-th indicator in the i-th year, X i j 0 , 1; x i j is the value of the j-th indicator in the i-th year; Min x i j is the minimum value of the j-th indicator in all years; and Max x i j is the maximum value of the j-th indicator in all years.
(2) Entropy calculation
Y i j = X i j i = 1 n X i j
where Y i j is the proportion of the standardized value of the j-th indicator in the i-th year to the standardized value of the j-th indicator in all years; and n is the number of years.
e j = 1 ln n i = 1 n ( Y i j ln Y i j )
where e j is the entropy of the j-th indicator.
(3) Indicator weight calculation
W j = 1 e j j = 1 m ( 1 e j )
where W j is the weight of the j-th indicator; 1-ej is the difference coefficient of the j-th indicator; and m is the number of indicators.

2.2.3 Comprehensive index calculation

The comprehensive index method was used to calculate the green development level in the form of an index. The calculation formula is expressed as follows:
T i = j = 1 n W j X i j
where T i is the comprehensive index of green development of Qinghai in the i-th year.

2.2.4 Green development evaluation stage division

The green development evaluation stages were divided based on the directions of changes in the eco-environment protection policies and projects. According to the changes in the goals, objects, and contents of the formulation and implementation of eco-environment protection policies and projects, as well as the relationship between eco-environment protection and socio-economic development in Qinghai (Shao and Fan, 2012; Guan et al., 2022), three stages were identified for evaluating the changes in the green development level.
(1) Ecological protection and construction stage (1998- 2004): During this stage, the provincial government of Qinghai issued the “Ecological Environment Construction Plan of Qinghai Province” and implemented various ecological protection and construction projects, including the “Natural Forest Protection Project”, “Grazing Forbidden Project”, “Grain for Green Project”, the “Shelter Forest Program in the Yangtze River Watershed”, and “National Wildlife Protection and Nature Reserve Construction”. From 1999 to 2004, a total of 20 million ha of grassland were newly constructed and improved in the southern Qinghai and lakeside areas, and 15 million ha of degraded grassland, sandy grassland, and saline-alkali grassland were restored, effectively reversing the trend of grassland degradation.
(2) Environmental governance and economic transformation stage (2005-2011): Rural environmental governance, rural economic development, and increasing farmer income were the important tasks of ecological environmental protection at this stage. To address the prominent issues in the living environment of rural areas, efforts were made to promote garbage classification and harmless treatment, as well as centralized sewage treatment, while improving the penetration rate of sanitary toilets in rural areas. The “Three-River-Source Ecological Protection and Construction Project”, also known as the new century China ecological No. 1 project (Liu et al., 2013; Shao et al., 2013; Shao et al., 2017), aimed to establish an ecological agricultural system characterized by the production of green, efficient, and energy-saving products, thereby promoting the development of a green economy. Meanwhile, financial, material, and job compensations were provided to farmers and herdsmen who implemented ecological restoration measures which helped to alleviate poverty (Hou et al., 2021).
(3) Ecological civilization construction stage (2012- 2022): In 2012, the 18th National Congress of the CPC initiated a new era of ecological civilization construction, with “green development” becoming an important topic. The following year, the concept of “Mountain-Water-Forest- Farmland-Lake-Grass forming a community of life” was introduced, and ecological environmental protection developed towards the comprehensive restoration of the Mountain- Water-Forest-Farmland-Lake-Grass system (Gu et al., 2013; Wang et al., 2018b; Wang and Zhang, 2020). After the 20th National Congress of the CPC in 2022, Qinghai made great efforts to build an ecological civilization highland, established a national demonstration zone for ecological civilization construction and a practice and innovation base of “green mountains and clear waters are as valuable as mountains of gold and silver”. At the same time, Qinghai promoted the development of four key industries: a world-class salt lake industry base, a national clean energy industry highland, an international ecological tourism destination, and a green and organic agricultural and livestock product export base. These efforts aimed to gradually realize the mutual benefits and win-win results of the high-quality coordinated development between ecological environmental protection and socio-economic development.

2.2.5 Coupling coordination degree analysis

The coupling coordination degree model includes the coupling degree model and the coordinated development degree model. The coupling degree can reflect the extent of interaction and synergy among multiple systems (Liu et al., 2005). The smaller the degree of dispersion among multiple systems, the higher the coupling degree; and conversely, the lower the coupling degree. We analyzed the strengths of the interactions between the five dimensions of resources-environment-ecology-economy-society through coupling degree analysis. The modified coupling degree formula is as follows (Jiang et al., 2017; Wang et al., 2021):
C = i = 1 n U i 1 n i = 1 n U i n 1 n
where C is the coupling degree, C 0 , 1; n is the number of dimensions ( n=5 in this study); and U i is the standardized value of each dimension, obtained by dividing the comprehensive index of each dimension by the weight of each dimension.
Due to the dynamic nature and imbalance of the various dimensions, a coordinated development model was further employed to analyze the degree of interaction and coordination among the multiple dimensions. The calculation formula is expressed as follows:
D = C × T
where D is the coordinated development degree, D 0 , 1.
The coupling degree was divided into six stages: uncoordinated development, low-level coupling, antagonism, adaptation, high-level coupling, and benign resonance coupling, using the thresholds of 0, 0.3, 0.5, 0.8, and 1 (Huang and Fang, 2003; Liu et al., 2005). The coordinated development degree was divided into ten stages (Table 2), each of which was assigned a value of 0.1 (Liao, 1999).
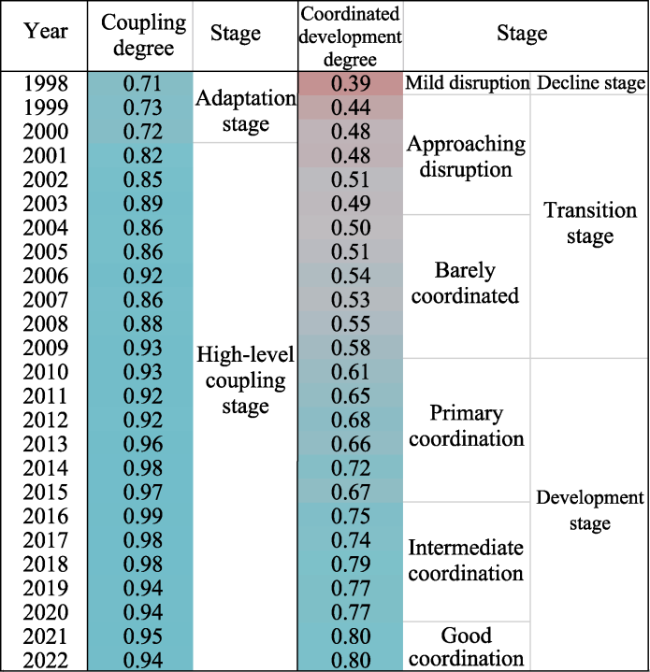
Table 2 Stage divisions of the coupling degree and the coordinated development degree
Model Interval Stage division
Coupling degree 0 Uncoordinated development stage
(0, 0.3] Low-level coupling stage
(0.3, 0.5] Antagonism stage
(0.5, 0.8] Adaptation stage
(0.8, 1) High-level coupling stage
1 Benign resonance coupling stage
Coordinated development degree [0, 0.1) Extreme disruption Decline stage
[0.1, 0.2) Severe disruption
[0.2, 0.3) Moderate disruption
[0.3, 0.4) Mild disruption
[0.4, 0.5) Approaching disruption Transition stage
[0.5, 0.6) Barely coordinated
[0.6, 0.7) Primary coordination Development stage
[0.7, 0.8) Intermediate coordination
[0.8, 0.9) Good coordination
[0.9, 1] High-quality coordination

2.2.6 Obstacle degree analysis

The obstacle degree can reflect the extent to which indicators hinder the improvement of green development level. We used the obstacle degree model to identify the key factors that restrict green development and to explore solutions for reducing their impact on green development. The calculation formula is expressed as follows:
O i j = ( 1 x i j ) × w j j = 1 m ( 1 x i j ) × w j × 100 %
where O i j is the obstacle degree of the j-th indicator in the i-th year.

2.3 Data sources

According to the three stages of green development evaluation in Qinghai Province, the time scale of the data corresponded to the period from 1998 to 2022. The 32 indicators of green development were obtained from the following sources.
(1) Yearbook data, including “Qinghai Statistical Yearbook 1999-2022”, “China Energy Statistical Yearbook 1999-2022”, “China Circular Economy Yearbook 2016”, “China Water Statistical Yearbook 2009-2021”, “China Statistical Yearbook on Environment 2005-2021”, “China Forestry Statistical Yearbook 1999-2019”, “China Animal Industry Yearbook 2000-2008”, “China Statistical Yearbook for Regional Economy 2000-2014”, “China Statistical Yearbook of the Tertiary Industry 2006-2022”, “China Statistical Yearbook on Science and Technology 1999-2022”, “China City Statistical Yearbook 2006-2021”, “China Rural Statistical Yearbook 1999-2022”, and “China Health Statistical Yearbook 2003-2021”. The missing data for a few years were supplemented by linear interpolation.
(2) Bulletin data, including “Statistical Communique of Qinghai on the National Economic and Social Development 1998-2022”, “Qinghai Water Resources Bulletin 1998- 2021”, and “Qinghai Ecological and Environment Conditions Bulletin 1998-2022”.
(3) Databases, including Qinghai carbon dioxide emissions data 1998-2019 in the Carbon Emission Accounts and Datasets (https://www.ceads.net.cn/data/province/) and Qinghai carbon dioxide emissions data 2020-2022 in the Carbon Monitor Data (https://www.carbonmonitor.org.cn/).
(4) Field survey data. In 2023, we conducted two field surveys in Qinghai Province, providing detailed first-hand data for further analysis in this study. We conducted the first field survey in Haibei Tibetan Autonomous Prefecture from August 16th to August 21st, and obtained data on the implementation and supervision of “the Mountain-Water-Forest-Farmland-Lake-Grass Project” in the Qilian Mountains region, the construction of drinking water sources, mining ecological restoration, and comprehensive rural environmental governance. We conducted the second field survey in Yushu Tibetan Autonomous Prefecture from September 20th to September 27th, and gathered data on the implementation and supervision of the ecological environmental protection system in the Three-River-Source National Park.

3 Results

3.1 Green development levels in various dimensions and their changes

3.1.1 Resource utilization level and its changes

The resource utilization level of Qinghai declined over the 25 years from 1998 to 2022, with its index value decreasing from 0.1360 to 0.0946 (Fig. 2a). The main reasons for this reduction were the increase in total energy consumption (I1), the expansion of the built-up land area (I8), the decrease in the reduction rate of water consumption per GDP (I5), and the reduction in cropland area (I7).
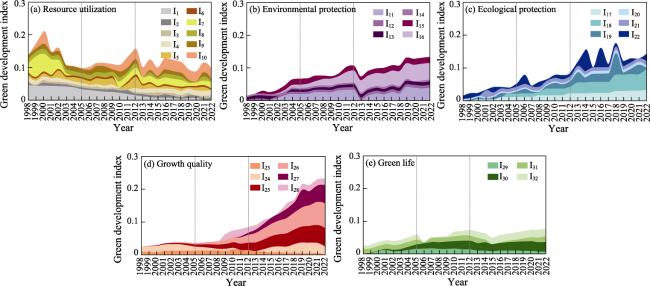
Fig. 2 Green development indexes in the five dimensions
Over the 25 years, the energy demand of Qinghai continued to grow, with total energy consumption increasing from 738.88×10⁴ tce to 4694.47×104 tce, resulting in a decrease in the index value of 0.0450 (I1) (Fig. 3a). Due to rapid GDP growth, the energy consumption per GDP decreased from 3.34 to 1.30 tce per ten thousand yuan, but it was still the highest in China, exceeding the national average by 0.85 tce per ten thousand yuan. In addition, the energy consumption structure was conducive to improving the resource utilization level, because the proportion of non-fossil energy consumption in Qinghai was the highest in China, reaching 47% in 2022, but the control of the total energy consumption and energy consumption intensity still needs to be strengthened.
Fig. 3 Trends of change in the green development indexes in the five dimensions
The total water consumption increased at first and then decreased over the 25 years, with a cumulative reduction of 12.14×10⁸ m3. The reduction in the rate of water consumption per GDP also showed a trend of increasing at first and then decreasing, with an increase of 27.93% in the first two stages. However, with the slowdown of GDP growth in the third stage, the reduction rate of water consumption per GDP decreased by 36.07%, resulting in a decrease in the index value of 0.0340 (I5) (Fig. 3a). In 2022, the water consumption per GDP was 23.30 m3 higher than the national level, indicating that water use efficiency still needed to be improved. According to the water-saving targets of the “13th Five-Year Plan” and the “Opinions on Implementing the Strictest Water Resources Management System” (Qinghai Provincial Government Office [2012] No. 330), the water consumption used for agriculture, industry, and living needs to be strictly controlled. In 2022, the water consumption for production (agriculture and industry), living, and ecology accounted for 81.0%, 11.8%, and 7.2% of the total water consumption, respectively. Although the proportion of agricultural water decreased from 74.5% to 45.4% in the past 25 years, Qinghai had a relatively small cropland area and the average irrigation water use (29.8 m3 ha-1) was still higher than the national level (24.3 m3 ha-1) in 2022. The efficiency of irrigation water use has limited the reduction of total water consumption.
The area of newly added built-up land increased from 59 ha to 2242 ha, while the reduction rate of built-up land area per GDP decreased from 7.62% to -1.86%, resulting in a decrease in their respective index values by 0.0111 (I8) and 0.0064 (I9) (Fig. 3a). One of the main factors for the expansion of built-up land was population growth. In the past 25 years, the urban population of Qinghai increased by 1.92 million, so urban construction was in a rapid development period. The decreasing trend of cropland area was mainly in the first stage from 1998 to 2004, due to the implementation of the “Grain for Green” project starting in 2000. During this stage, the cropland area decreased by 63.04×10³ ha, with a reduction in the index value of 0.0082 (I7).

3.1.2 Environmental protection level and its changes

The environmental protection index of Qinghai showed a gradually increasing trend from 0.0138 in 1998 to 0.1329 in 2022, with increases of 0.0527, 0.0399, and 0.0265 in three stages, respectively (Fig. 2b). Qinghai achieved good results in the governance of the living environment, atmospheric environment, and water environment.
The index with the highest growth was the centralized treatment rate of urban domestic sewage (I16, 0.0513) (Fig. 3b). Since the first sewage treatment plant was put into operation in Xining, Qinghai in 2002, the centralized treatment rate of urban domestic sewage was no longer 0%, and reached 95% after two decades. The second largest increase among the indices was the proportion of good air quality days (I11, 0.0389). However, this index had its lowest value in 2013 (60.60%), with the main pollutants being PM10 and PM2.5, and haze days increasing by 30% compared to the baseline. The rapid development of the heavy chemical industry and the greater number of automobiles in Xining might be the main reasons for the emergence of haze. The third highest increase was the harmless treatment rate of urban household waste (I15, 0.0183). This rate fluctuated upwards towards the goal of 100%, increasing from 42.25% in 1998 to 99.35% in 2022.
The proportion of surface water at or better than Class III achieved growth of 45.95%, and in 2020, Qinghai became the only province in China with surface water from Class I to Class III reaching 100%. Similarly, the surface water of Inferior Class V was eliminated in 2019. For example, Huangshui River was one of the most severely polluted rivers in Qinghai, and over 60% of Qinghai’s population, 52% of Qinghai’s cropland, and over 70% of Qinghai’s industrial and mining enterprises were concentrated in this watershed. The provincial legislative department revised the “Regulations on the Prevention and Treatment of Water Pollution in the Huangshui Watershed of Qinghai Province” four times in 1998, 2005, 2013, and 2018. At the level of local legislation, the government, enterprises, and the public were jointly involved in prevention and treatment, and the water quality of the watershed has fundamentally improved.

3.1.3 Ecological protection level and its changes

The ecological protection index of Qinghai also showed an upward trend, increasing from 0.0143 in 1998 to 0.1424 in 2022 (Fig. 2c), mainly due to the increases in forest stock volume (I18) and forest coverage rate (I17). Since the initiation of the natural forest protection project by the provincial government in 1998, the forest stock volume increased from 3270.36×104 m3 to 5300.00×104 m3 and the forest coverage rate increased from 2.59% to 8.00% over the 25 years, with these two indices increasing by 0.0643 (I18) and 0.0327 (I17), respectively (Fig. 3c). The ecological protection index increased by 0.0370, 0.0326, and 0.0586 in the three stages, respectively. It showed the fastest growth in the third stage, during which Qinghai completed the indicators of forestry development planning for the “12th Five-Year Plan” and “13th Five-Year Plan”. In this stage, the index values of forest stock volume, forest coverage rate, and newly added area of soil erosion increased by 0.0439 (I18), 0.0115 (I17), and 0.0129 (I22), respectively. In addition, in 2000, Qinghai established the Three-River-Source National Nature Reserve with an area of 1523.00×104 ha, and the Tsaidam Haloxylon Ammodendron Forest National Nature Reserve with an area of 31.05×10⁴ ha. As a result, the nature reserve area increased rapidly from 502.25×10⁴ ha to 2092.50×104 ha in the first stage, and its index value increased by 0.0103 (I21) in this stage.

3.1.4 Growth quality level and its changes

The growth quality index of Qinghai showed the largest increase among the five dimensions, growing by 0.2072 from 1998 to 2022, with the greatest growth of 0.1471 in the third stage from 2012 to 2022 (Fig. 2d). The economic development benefits were mainly reflected in the rapid growth of per capita disposable income of urban and rural residents (I25 and I26), as well as the proportion of added value of strategic emerging industries to GDP (I27).
Since 2012, Qinghai has made great efforts to develop ten key agricultural and animal husbandry industries, such as yak, Tibetan sheep, and highland barley, and eight special industries, such as cold-water fish, Chinese wolfberry, and quinoa, which have boosted the employment and income of farmers and herdsmen. In the third stage, the per capita disposable income of rural residents increased by 158%, and its index growth was higher than that of the urban residents, with increases of 0.0514 (I26) and 0.0333 (I25), respectively (Fig. 3d).
Also in the third stage, strategic emerging industries represented by new energy, new materials, and biopharmaceuticals were preliminarily established. The proportion of their added value to GDP increased from 2.34% in 2012 to 5.57% in 2022, with index value growth of 0.0504 (I27) (Fig. 3d). The proportion of added value of the tertiary industry to GDP also grew rapidly in the third stage, from 32.97% to 45.60%, and its index value increased by 0.0224 (I24). In 2021, based on its resource reserves, Qinghai began the construction of four industrial bases, including a world-class salt lake industrial base, a national clean energy industrial highland, an international ecological tourism destination, and a green organic agricultural and livestock product export base. The direction towards green transformation and sustainable development became even more distinct.
However, the per capita GDP growth rate gradually slowed in the third stage, declining from 12.30% to 2.10%, and its index value decreased by 0.0118 (I23) (Fig. 3d). This slowing was due to the continuous growth of the population and the transformation of the government assessment mechanism from a single GDP assessment to comprehensive assessments including high-quality economic development, targeted poverty alleviation, pollution prevention and others.

3.1.5 Green life level and its changes

The green life index of Qinghai showed relatively small changes, increasing from 0.0244 in 1998 to 0.0779 in 2022 with growth in the three stages of 0.0336, 0.0144, and, 0.0056, respectively (Fig. 2e). In the dimension of green life, the index of the green land rate in urban built-up areas (I30) contributed the most (0.0302), with nearly 90% of the increase concentrated in the first two stages (0.0266), and the first and second stages increasing by 9.24% and 9.35%, respectively. In 2022, there were 12.36 public transportation vehicles per ten thousand urban population, reaching the standard of seven public transportation vehicles per ten thousand urban population in the small and medium-sized cities in China. Although the number of public transportation vehicles continued to increase, this index showed a downward trend in the second and third stages (I29), mainly due to the rapid growth of the urban population. From 1998 to 2022, the index of the penetration rate of rural sanitary toilets and the penetration rate of rural tap water increased by 0.0140 (I32) and 0.0033 (I31), respectively (Fig. 3e). In 2022, their penetration rates were 60% and 82%, both lower than the national levels of 73% and 87%, respectively. Therefore, there is still some room for improvement in the construction of urban and rural infrastructure and the comprehensive governance of the living environment in Qinghai.

3.2 Comprehensive green development level and its changes

From 1998 to 2022, the green development level in Qinghai continued to improve, with the comprehensive index increasing from 0.2124 to 0.6790 (Fig. 4). In the three stages of 1998-2004, 2005-2011, and 2012-2022, the comprehensive index increased by 0.0957, 0.1949, and 0.4666, respectively. In terms of the annual average values, the contributions of the five dimensions to the comprehensive index could be ranked from highest to lowest as resource utilization index (12.15%), growth quality index (9.28%), ecological protection index (8.34%), environmental protection index (7.89%), and green life index (5.48%). Qinghai relied on its abundant resources of energy, water, and land in exchange for economic growth, forming a resource- dependent economic development model, while rapid economic development in turn caused pressure on resource utilization, which was reflected in the reduced ranking of the resource utilization index from the top in the first and second stages to fourth in the third stage, while the ranking of the growth quality index increased from fifth in the first and second stages to the top in the third stage.
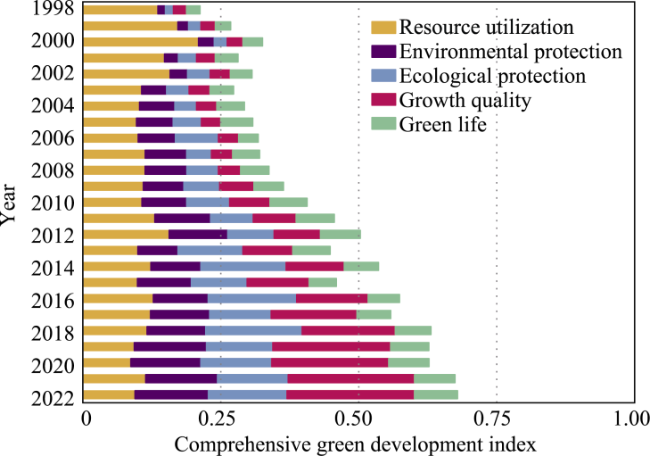
Fig. 4 The composition and changes in the comprehensive green development index
From 1998 to 2004, the environmental protection index increased the most (0.0527), driven by great progress in the treatment of household waste and domestic sewage, and the improvement of air quality. Following that were the ecological protection (0.0370), green life (0.0336), and growth quality (0.0112) indexes, while the resource utilization index showed a negative change (-0.0388) during this stage (Fig. 5a). From 2005 to 2011, all five dimensions showed positive changes, with the resource utilization index having the largest increase (0.0592), followed by the growth quality (0.0489), environmental protection (0.0399), ecological protection (0.0326), and green life (0.0144) indexes (Fig. 5b). From 2012 to 2022, the growth quality index showed the largest increase (0.1471), which was especially reflected in the increase in per capita disposable income of urban and rural residents. Following that were the ecological protection (0.0586), environmental protection (0.0265), and green life (0.0056) indexes, while the resource utilization index showed a negative change (-0.0617) during this stage (Fig. 5c). Overall, resource utilization was the only dimension that showed a decreasing trend (-0.0413) from 1998 to 2022 (Fig. 5d), mainly due to the irrational use of energy, water, and land resources. The indexes for growth quality (0.2072), ecological protection (0.1282), environmental protection (0.1191), and green life (0.0535) all showed increasing trends. In the past 25 years, Qinghai achieved the most significant results in economic development, but its resource utilization was still not ideal. In the future, Qinghai should focus on controlling the total consumption of energy, water, and land resources to improve its efficiency of resource utilization.
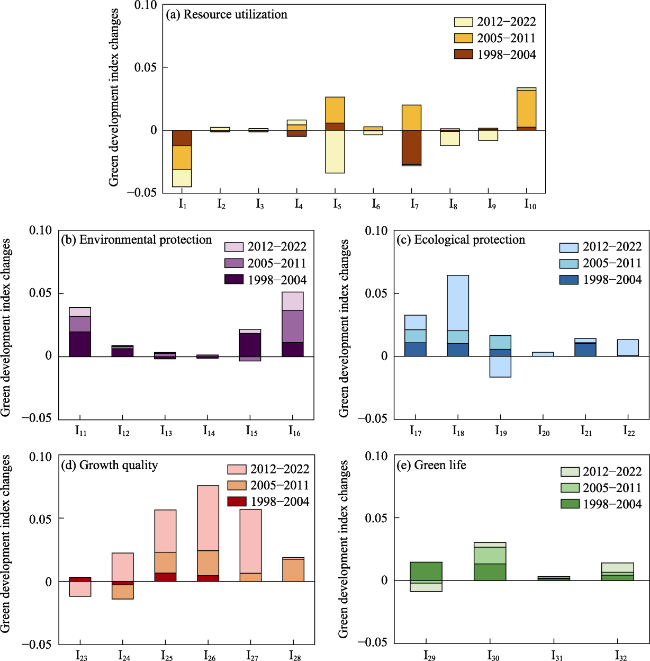
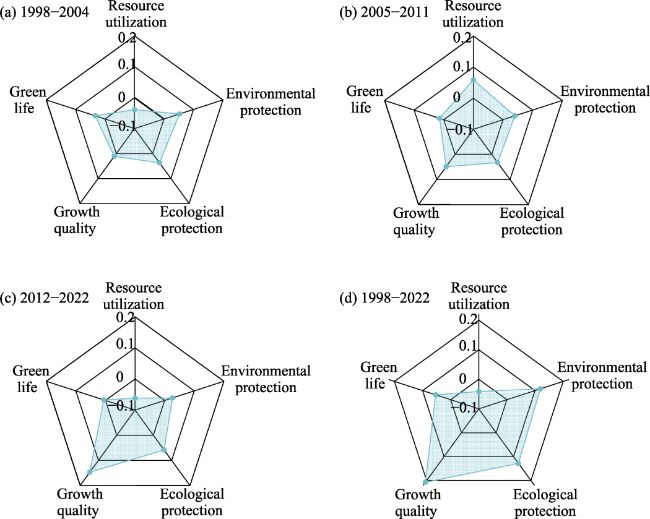
Fig. 5 Index changes in the five dimensions of green development during the different stages

3.3 Coupling coordination degree of green development

From 1998 to 2022, the coupling degree showed an overall increasing trend, from 0.71 in 1998 to 0.94 in 2022, reaching a peak of 0.99 in 2016 (Fig. 6). The coupling degree of the five dimensions of resource utilization, environmental protection, ecological protection, growth quality, and green life was generally at a high-level coupling stage, except for the first three years when it was in an adaptation stage. The coordinated development degree was lower than the coupling degree, but its overall trend was also increasing, from 0.39 to 0.80 over the 25 years. The coordinated development degree among the five dimensions experienced stages from disruption to coordination, and from decline, transition to development. They were specifically characterized by mild disruption in 1998, approaching disruption from 1999 to 2003, barely coordinated from 2004 to 2009, primary coordination from 2010 to 2015, intermediate coordination from 2016 to 2020, and good coordination from 2021 to 2022.
Fig. 6 Coupling degree and coordinated development degree of green development
Based on the previous index analysis, the decline in the resource utilization level evidently hindered the improvements in the coupling degree and coordinated development degree. Therefore, to ensure the coordinated development of the resource-environment-ecology-economy-society dimensions, problems such as improper resource utilization methods and excessive resource utilization intensity should be solved promptly.

3.4 Obstacles to green development

The top five obstacles to Qinghai green development that appeared with the highest frequency from 1998 to 2022 were per capita disposable income of rural residents (I26), newly added area of artificial grass planting (I19), proportion of added value of strategic emerging industries to GDP (I27), newly added area of soil erosion control (I22), and cropland area (I7), which appeared 22, 20, 18, 17, and 17 times, respectively (Table 3). Among these five obstacles, two belonged to the dimension of growth quality, two belonged to ecological protection, and one belonged to resource utilization, reflecting the contradictions between resource utilization, ecological protection, and economic development.
Table 3 Ranking of obstacles to green development
Year 1st obstacle
(obstacle degree, %)
2nd obstacle
(obstacle degree, %)
3rd obstacle
(obstacle degree, %)
4th obstacle
(obstacle degree, %)
5th obstacle
(obstacle degree, %)
1998 I26 (9.5961) I19 (8.2927) I18 (8.1645) I27 (7.2154) I25 (7.1545)
1999 I26 (10.2868) I18 (8.7836) I19 (8.5322) I27 (7.7624) I25 (7.5897)
2000 I26 (11.1455) I18 (9.5377) I19 (8.8412) I27 (8.4289) I25 (8.1233)
2001 I26 (10.3972) I18 (8.9473) I19 (8.7573) I22 (8.6981) I27 (7.9071)
2002 I26 (10.6789) I18 (9.2750) I19 (8.4422) I27 (8.1967) I25 (7.6518)
2003 I26 (10.0812) I18 (8.8480) I22 (8.2941) I7 (7.8438) I27 (7.8194)
2004 I26 (10.2193) I19 (9.2499) I7 (8.8682) I22 (8.6317) I27 (8.0367)
2005 I26 (10.2712) I7 (9.0501) I19 (8.6327) I27 (8.2129) I22 (7.9077)
2006 I26 (10.2324) I7 (9.1871) I27 (8.3315) I18 (7.9306) I19 (7.5595)
2007 I26 (9.9751) I7 (9.2136) I22 (9.1458) I19 (8.7415) I27 (8.3613)
2008 I26 (9.8821) I19 (9.7296) I7 (9.4176) I27 (8.5772) I18 (8.1645)
2009 I26 (10.0109) I7 (9.8067) I22 (9.4741) I27 (8.9315) I19 (8.8462)
2010 I26 (10.1916) I27 (9.5728) I22 (9.3278) I19 (8.1307) I18 (7.3882)
2011 I26 (10.2878) I27 (9.8798) I19 (9.6225) I22 (9.5115) I18 (8.0589)
2012 I22 (10.9064) I26 (10.3439) I27 (10.1396) I19 (9.8072) I18 (8.8237)
2013 I22 (9.4270) I27 (8.4613) I26 (8.4054) I7 (7.7463) I11 (7.4025)
2014 I19 (10.7527) I7 (9.4405) I27 (9.1773) I26 (8.9647) I1 (7.9625)
2015 I22 (11.8474) I7 (7.8911) I19 (7.4458) I1 (7.1185) I27 (7.0492)
2016 I7 (9.9077) I19 (9.3322) I1 (8.9670) I27 (8.4054) I26 (7.8852)
2017 I22 (12.3608) I7 (9.4829) I19 (8.9616) I1 (8.8816) I18 (6.9446)
2018 I22 (14.5494) I7 (11.4019) I1 (11.1613) I5 (7.0597) I27 (7.0345)
2019 I19 (15.9735) I7 (14.2386) I22 (13.0946) I1 (10.6511) I5 (7.9562)
2020 I7 (14.1580) I22 (14.0885) I19 (13.0736) I1 (10.4041) I5 (6.7882)
2021 I22 (19.8387) I7 (14.9294) I1 (13.8114) I19 (11.3565) I5 (6.8587)
2022 I19 (20.2847) I1 (14.0030) I7 (13.5878) I22 (12.8733) I5 (10.5792)
In the past 25 years, the key obstacles for Qinghai shifted from economic factors to resource and ecological factors. From 1998 to 2004, the primary obstacle was the per capita disposable income of rural residents (I26). During this stage, the slow economic development and low living standards were the main hindrances to development. From 2005 to 2011, the primary obstacle was still the per capita disposable income of rural residents (I26), followed by the cropland area (I7). Due to the continuous reduction of cropland areas, food security also constrained the improvement of green development. From 2012 to 2022, the key obstacles were mainly the newly added area of soil erosion control (I22) and the newly added area of artificial grass planting (I19). As most of the soil erosion control and artificial grass planting had been completed in the first two stages, further ecological restoration became more challenging. Therefore, the speed of control and restoration slowed, but the area of soil erosion control and artificial grass planting continued to increase. In addition, cropland area (I7) and total energy consumption (I1) were also major obstacles in the third stage, as the reduction in cropland area and the rapid growth of total energy consumption constrained the improvement of green development.

4 Discussion

4.1 Comparison with other studies

The comprehensive index values for green development of each city (prefecture) from 2016 to 2021 issued by the Qinghai Provincial Bureau of Statistics ranged from 0.75 to 0.85 (Li et al., 2022). In the same years, the provincial comprehensive index values in our study were relatively low, ranging from 0.57 to 0.67. There are several reasons for this difference. Firstly, our study focused on the temporal variations of the provincial-level green development, while the Qinghai Provincial Bureau of Statistics focused on the spatial differences among cities (prefectures). Secondly, the indicator weights in our study were calculated based on the degree of data dispersion to reflect the differentiation of the indicators. The Qinghai Provincial Bureau of Statistics divided the indicators into three types (Table 1) based on their importance, with a fixed weight ratio of 3:2:1. However, a recent study (Xu et al., 2022) using the 3:2:1 weight ratio showed that the comprehensive index of Qinghai green development in 2016 was about 0.48, which was also lower than the index value issued by the Qinghai Provincial Bureau of Statistics. Another study calculated the green development level based on the weighted additive distance model and “Vertical and Horizontal” grading weighted arithmetic average integration method, and found comprehensive index values of 0.31-0.43 from 2018 to 2020 in Qinghai (Zeng and Gu, 2023), which were lower than the 0.6-0.63 range in our study. Therefore, the selection of different indicators to construct an index system and the use of different methods to set indicator weights could lead to relatively large differences in the index values. It is important to establish an indicator system that can be compared between regions and localized.

4.2 Countermeasures and suggestions

The levels of the coupling degree and the coordinated development degree depend on the interaction among the five dimensions of green development. As an underdeveloped province in China, Qinghai had relatively high levels of coupling degree and coordinated development degree, while the developed provinces in eastern China were not characterized by high coupling and coordinated development (Jiang et al., 2017). This is because Qinghai has abundant natural resources and relatively less industrial pollution emissions compared to the eastern region. However, the problem of economic growth at the cost of massive consumption of natural resources in Qinghai had gradually emerged. It is necessary to promote technological innovation in resource-based industries, reduce resource waste, and mitigate the environmental damage caused by pollutants. These measures are essential for promoting coordinated development.
According to the analysis of obstacles, the inter-annual changes of the newly added area of artificial grass planting and newly added area of soil erosion control were unstable in the third stage (2012-2022), which hindered the improvement of the green development level. To consolidate the results of ecological protection, first, it is important to seize the opportunities provided by national policies and strive for major projects such as land greening, grassland purification, and ecological monitoring supported by national financial funds, and then to use these projects to drive the treatment of soil erosion and grassland degradation. Second, it is crucial to maintain a problem-oriented approach and carry out “looking back” actions. The ecological protection work in Qinghai has entered a stage of tackling major difficulties. Therefore, the timely review and rectification of the historical difficulties related to soil erosion and grassland degradation are the key for improving the ecological protection level.

4.3 Limitations and next steps

This study selected quantitative indicators from the five dimensions of resources, environment, ecology, economy, and society. However, qualitative indicators such as the completeness of institutional mechanisms and the realization of fiscal performance goals have not been considered (Zhen et al., 2013; Fu and Geng, 2019), which may limit the comprehensiveness of the evaluation. Therefore, the next step is to add indicators such as the formulation and implementation of laws and regulations, the implementation and supervision of the carbon emission trading system, the implementation and supervision of the ecological redline system, and the implementation and supervision of the ecological protection and restoration projects of Mountain-Water- Forest-Farmland-Lake-Grass to the evaluation framework of green development. These indicators will reflect the role and effectiveness of the government and relevant departments in promoting regional green development.

5 Conclusions

The indicator system for evaluating green development in Qinghai Province was constructed based on the dimensions of resource, environment, ecological function, economic and social development. We evaluated the green development level of Qinghai from 1998 to 2022, and compared the changes in the indexes, coupling coordination degree, and obstacles among the three stages. This analysis led to four main conclusions.
(1) The overall level of green development in Qinghai showed an upward trend from 1998 to 2022, indicating a good development situation. Among the five dimensions, the growth quality index increased the most, followed by the ecological protection index, environmental protection index, and green life index, while the resource utilization index showed a downward trend. Among the 32 indicators, the indicator that contributed the most to the index growth changed from the proportion of good air quality days in the first stage, to the comprehensive utilization rate of general industrial solid waste in the second stage, and then to the per capita disposable income of rural residents in the third stage.
(2) The coupling degree and coordinated development degree among the five dimensions of green development were relatively good. From 1998 to 2022, the coupling degree developed from the adaptation stage to the high-level coupling stage; while the coordinated development degree went through stages of mild disruption, approaching disruption, barely coordinated, primary coordination, intermediate coordination, and good coordination.
(3) The transition of key obstacles hindering the improvement of the green development level from growth quality to resource utilization and ecological protection reflects the contradiction between economic development and resource ecology. Currently, the five key factors are the decrease in the newly added area of soil erosion control, the decrease in the newly added area of artificial grass planting, the decrease in the reduction rate of water consumption per GDP, the decrease in cropland area, and the increase in the total energy consumption.
(4) In the formulation and implementation of Qinghai green development policies, the focus is to control and improve the indicators in the dimensions of resource utilization and ecological protection. The top priority is to control the total consumption and improve the utilization efficiency of energy, water, and land resources. In addition, the government should strictly implement the “Forest and Grass Chief System” to strengthen the long-term monitoring of ecological protection results and punish cases that illegally destroy ecological resources, so as to ensure the high-quality completion of the artificial grass planting indicator and the soil erosion control indicator.
[1]
Alfsen K H, Greaker M. 2007. From natural resources and environmental accounting to construction of indicators for sustainable development. Ecological Economics, 61(4): 600-610.

[2]
Bartelmus P. 2013. The future we want: Green growth or sustainable development? Environmental Development, 7(6): 165-170.

[3]
Chen C F, Han J, Fan P L. 2016. Measuring the level of industrial green development and exploring its influencing factors: Empirical evidence from China’s 30 Provinces. Sustainability, 8(2): 153. DOI: 10.3390/su8020153.

[4]
Cheng C Y, Ge C Z. 2020. Green development assessment for countries along the Belt and Road. Journal of Environmental Management, 263(6): 110344. DOI: 10.1016/j.jenvman.2020.110344.

[5]
Fang Y B. 2021. Review on the evaluation index system of green development in China: Based on bibliometrics and social network analysis. Science and Technology Management Research, 41(18): 73-79. (in Chinese)

[6]
Fu J Y, Geng Y Y. 2019. Public participation, regulatory compliance and green development in China based on provincial panel data. Journal of Cleaner Production, 230(9): 1344-1353.

[7]
Gu S Z, Hu Y J, Zhou H. 2013. Ecological civilization construction: Scientific connotation and basic paths. Resources Science, 35(1): 2-13. (in Chinese)

[8]
Guan Y J, Liu J G, Cui W H, et al. 2022. Research progress in ecological restoration in China based on bibliometrics. Acta Ecologica Sinica, 42(12): 5125-5135. (in Chinese)

[9]
Han M S, Yuan Q, Fahad S, et al. 2022. Dynamic evaluation of green development level of ASEAN region and its spatio-temporal patterns. Journal of Cleaner Production, 362(8): 132402. DOI: 10.1016/j.jclepro.2022.132402.

[10]
Hou L L, Xia F, Chen Q H, et al. 2021. Grassland ecological compensation policy in China improves grassland quality and increases herders’ income. Nature Communications, 12(1): 4683. DOI: 10.1038/s41467-021-24942-8.

[11]
Hu A G, Zhou S J. 2014. Green development: Functional definition, mechanism analysis and development strategy. China Population, Resources and Environment, 24(1): 14-20. (in Chinese)

[12]
Huang J C, Fang C L. 2003. Analysis of coupling mechanism and rules between urbanization and eco-environment. Geographical Research, 22(2): 211-220. (in Chinese)

[13]
Jiang L, Bai L, Wu Y M. 2017. Coupling and coordinating degrees of provincial economy, resources and environment in China. Journal of Natural Resources, 32(5): 788-799. (in Chinese)

DOI

[14]
Khan J, Johansson B, Hildingsson R. 2021. Strategies for greening the economy in three Nordic countries. Environmental Policy and Governance, 31(6): 592-604.

[15]
Li C L. 2021. Research on the construction of regional green development evaluation system and improvement measures. Diss., Hangzhou, China: Zhejiang University. (in Chinese)

[16]
Li J M, Gan X Y, Mao X F. 2022. Evaluation of green development level in six Tibetan related prefectures of Qinghai Province. Qinghai Social Sciences, 43(4): 28-36. (in Chinese)

[17]
Liao C B. 1999. Quantitative judgement and classification system for coordinated development of environment and economy—A case study of the city group in the Pearl River Delta. Tropical Geography, 19(2): 76-82. (in Chinese)

[18]
Ling J. 2023. Evaluation of green development level based on entropy method: Taking Xining, Qinghai Province as an example. Trade Fair Economy, 5(11): 143-146. (in Chinese)

[19]
Liu E Y, Chang M M. 2016. The research summary of domestic green development in recent years. Journal of Guizhou University of Finance and Economics, 34(3): 105-110. (in Chinese)

[20]
Liu J Y, Shao Q Q, Fan J W. 2013. Ecological construction achievements assessment and its revelation of ecological project in Three Rivers Headwaters Region. Chinese Journal of Nature, 35(1): 40-46. (in Chinese)

[21]
Liu Y B, Li R D, Song X F. 2005. Analysis of coupling degrees of urbanization and ecological environment in China. Journal of Natural Resources, 20(1): 105-112. (in Chinese)

DOI

[22]
Liu Y F, Yuan Z H, Guo L X, et al. 2022. Spatio-temporal characteristics of urban green growth level and its influencing factors in Shaanxi Province. Journal of Natural Resources, 37(1): 200-220. (in Chinese)

DOI

[23]
NDRC (National Development and Reform Commission) 2016. Green development indicator system. Beijing, China: NDRC. https://www.ndrc.gov.cn/fggz/hjyzy/stwmjs/201612/t20161222_1161174.html. Viewed on 2023-10-28.

[24]
Rüstemoglu H. 2019. Factors affecting Germany’s green development over 1990-2015: A comprehensive environmental analysis. Environmental Science and Pollution Research, 26(7): 6636-6651.

[25]
Shao Q Q, Cao W, Fan J W, et al. 2017. Effects of an ecological conservation and restoration project in the Three-River Source Region, China. Journal of Geographical Sciences, 27(2): 183-204.

DOI

[26]
Shao Q Q, Fan J W. 2012. Comprehensive monitoring and evaluation of the ecosystem in the Three-River-Source Region. Beijing, China: Science Press. (in Chinese)

[27]
Shao Q Q, Liu J Y, Huang L, et al. 2013. Integrated assessment on the effectiveness of ecological conservation in Sanjiangyuan National Nature Reserve. Geographical Research, 32(9): 1645-1656. (in Chinese)

[28]
Shu C, Zhu P Y, Xu B. 2021. Measurement of green development and its spatial differentiation in Jiangxi Province. Economic Geography, 41(6): 180-186. (in Chinese)

[29]
Stoknes P E, Rockström J. 2018. Redefining green growth within planetary boundaries. Energy Research & Social Science, 44(10): 41-49.

[30]
Sun Y S, Miao C H, Tong L J. 2023. Spatio-temporal pattern and obstacle factors of green development level in Northeast China. Acta Ecologica Sinica, 43(18): 7651-7659. (in Chinese)

[31]
Wang H Q, Gao S J. 2016. Germination, starting and policy evolution of green development in China: Observation of some stage characteristics. Reform, 29(3): 6-26. (in Chinese)

[32]
Wang M X, Zhao H H, Cui J X, et al. 2018a. Evaluating green development level of nine cities within the Pearl River Delta, China. Journal of Cleaner Production, 174(2): 315-323.

[33]
Wang S J, Kong W, Ren L, et al. 2021. Research on misuses and modification of coupling coordination degree model in China. Journal of Natural Resources, 36(3): 793-810. (in Chinese)

[34]
Wang X H, He J, Rao S, et al. 2018b. Design of implementation path of ecological engineering for ecological protection and restoration of multi ecological elements. Environmental Protection, 46(Z1): 17-20. (in Chinese)

[35]
Wang X H, Zhang X. 2020. The overall strategy and major tasks of ecological protection and restoration in the new period in China. Chinese Journal of Environmental Management, 12(6): 82-87. (in Chinese)

[36]
Wang Y, Sun X H, Wang B C, et al. 2020. Energy saving, GHG abatement and industrial growth in OECD countries: A green productivity approach. Energy, 194(3): 116833. DOI: 10.1016/j.energy.2019.116833.

[37]
Wang Y Q. 2018. Dynamic analysis and evaluation of urban green development. Diss., Beijing, China: Research Center for Eco-Environmental Sciences, Chinese Academy of Sciences. (in Chinese)

[38]
Xiong W, Guo X N, Sun Y, et al. 2023. Green standard and green development: Theory and empirical evidence. Journal of Cleaner Production, 414(8): 137768. DOI: 10.1016/j.jclepro.2023.137768.

[39]
Xu G Y, Chang H Y, Meng L Q, et al. 2022. Green development level, resource utilization, and ecological protection across China from 2006 to 2017: Based on the national standard indicator system. Environmental Development, 44(12): 100776. DOI: 10.1016/j.envdev.2022.100776.

[40]
Zeng S Z, Gu J X. 2023. Coordination evaluation and dynamic adjustment mechanism of China’s green development at inter-provincial level. Ecological Indicators, 153(9): 110419. DOI: 10.1016/j.ecolind.2023.110419.

[41]
Zhao Y Y, Lin Y, Chen H. 2011. The experience and reference of developed countries in establishing a green economy development measurement system. Economic Review Journal, 27(1): 34-37. (in Chinese)

[42]
Zhen L, Du B Z, Liu J Y, et al. 2013. The international experience of green development and implications to western China: An overall review of policy and practice. China Population, Resources and Environment, 23(10): 8-16. (in Chinese)

[43]
Zheng H X, Wang Y, Huang B R. 2013. A research review on green development indicator system. Journal of Industrial Technological Economics, 33(2): 142-152. (in Chinese)

Outlines

/