Resource Utilization and Green Development

‘Spatial Vulnerability Trap’ Existence or Not? Spatio-temporal Evolution Characteristics and Influencing Mechanism of Socio-Ecological System Vulnerability in Metropolitan Suburbs

  • REN Guoping , 1, 2 ,
  • DUAN Wenkai 3, 4, 5 ,
  • LI Hongqing 6 ,
  • YIN Gang , 1, 2, *
Expand
  • 1. School of Management, Hunan City University, Yiyang, Hunan 413000, China
  • 2. Hunan New-type Urbanization Institute, Yiyang, Hunan 413000, China
  • 3. China Agricultural University Library, Beijing 100193, China
  • 4. Research Center for Land Use and Management, China Agricultural University, Beijing 100193, China
  • 5. College of Land Science and Technology, China Agricultural University, Beijing 100193, China
  • 6. School of Public Administration, Hohai University, Nanjing 211100, China
* YIN Gang, E-mail:

REN Guoping, E-mail:

Received date: 2023-08-01

  Accepted date: 2024-02-20

  Online published: 2024-12-09

Supported by

The Social Science Foundation of Hunan Province(20JD011)

The Natural Science Foundation of Hunan Province(2022JJ50273)

The National Natural Science Foundation of China(42271105)

The Key Laboratory of Key Technologies of Digital Urban-Rural Spatial Planning of Hunan Province(2018TP1042)

Abstract

Deeply integrated vulnerability and its evaluation framework provide a new perspective for the study of socio-ecological systems in metropolitan suburbs. A new vulnerability evaluation system of ‘exposure-sensitivity- adaptability’ based on the socio-ecological system and vulnerability theory was constructed. Meanwhile, drawing on the concept of ‘spatial trap’, the concept of ‘spatial vulnerability trap’ was tried to put forward. The spatial-temporal interaction characteristics were analyzed, the existence of spatial vulnerability trap was tested and the interaction mechanism of vulnerability dynamic evolution was revealed using spatial-temporal exploration analysis method and geographic detector for socio-ecological system vulnerability of 184 administrative villages in Qingpu District from the year 1998 to 2018. The results showed that: (1) During the study period, the socio-ecological systems vulnerability of Qingpu District increased from 0.518 to 0.621, and the vulnerability level increased from low grade to medium grade. The spatial-temporal pattern showed the dynamic characteristics of first increase and then decrease and high in the East and low in the west. (2) The relative length of the socio-ecological systems vulnerability temporal path movement in Qingpu District from 1998 to 2018 showed a trend of gradual decline from the central region to the surrounding area. The mobility curvature of the vulnerability time path was relatively small, showing the spatial pattern of low in the north and high in south, and the cohesion index of the spatial transition of vulnerability is 0.496. The spatial agglomeration structure had relatively high transfer activity and low path locking. (3) No ‘spatial vulnerability absolute trap’ was detected during the study period, yet the ‘spatial vulnerability relative trap’ highlighted in the 11 administrative villages mainly distributed around the administrative boundary in the north and south of the area. (4) Social capital factor, human capital factor, social factor, economic factor, ecological factor and financial capital factor are the main factors influencing the vulnerability change, but the influence of each factor showed fluctuation and type difference. The main interaction types of socio-ecological system vulnerability differentiation in urban suburbs are the cumulative type of internal and external coupling, the type of endogenous capacity constraint and the external environmental stress type. The results of the study are of great theoretical and practical significance to guide the suburban areas to prevent the vulnerability risk, promote regional coordination to reduce vulnerability and sustainable development.

Cite this article

REN Guoping , DUAN Wenkai , LI Hongqing , YIN Gang . ‘Spatial Vulnerability Trap’ Existence or Not? Spatio-temporal Evolution Characteristics and Influencing Mechanism of Socio-Ecological System Vulnerability in Metropolitan Suburbs[J]. Journal of Resources and Ecology, 2024 , 15(6) : 1393 -1405 . DOI: 10.5814/j.issn.1674-764x.2024.06.001

1 Introduction

Socio-Ecological Systems (SESs) are complex adaptive systems coupled to man and nature, focusing on disturbing chaos on the spatiotemporal scales of complex systems a always been the hotspots and frontiers of regional sustainable development researches (Li et al., 2021; Butt et al., 2022; Damian et al., 2023; Yang et al., 2023). Meanwhile, they were widely used in the dynamic evolution of human-natural-social coupled systems, dilemma identification and their existence detection, and sustainable evaluation. Vulnerability which was originated from natural disasters was the tolerance and resilience of systems or their components to deal with risks, and was an important themes and analysis tools for global environmental change and sustainable development researches, and was also the core attribute and research hotspots of the SESs (Guo et al., 2020; Damian et al., 2023). With development of the SESs theory, the deep fusion vulnerability analysis framework provided a new perspective for the study of regional human-land relationships (Zhang et al., 2022). The vulnerability of the SESs (VSESs) integrated internal and external disturbance factors, risk causal association, system sensitivity and adaptation kernel, paid more attention to system vulnerability monitoring evaluation, dynamic tracking and collaborative brittle mechanism, and had gradually become the scientific research paradigm and the focus of national strategic decision (Phalkey, 2020; Yang et al., 2023).
At present, the researches of the VSESs had shifted from theoretical and conceptual discussion to the empirical analysis. Vulnerability evaluation methods and case areas had expanded from using the index of social, economic, ecological combination of qualitative analysis or simple weighted comprehensive model of poor mountain, ecological lake, coastal to integrated risk, disturbance, exposure, sensitivity and adaptability evaluation system using BP neural network, PCA-DEA model, super DEA model (Cinner et al., 2013; Bai et al., 2021; Rorato et al., 2022), and other models for empirical studies of, rural regions and other more case areas (Lv et al., 2019; Gupta et al., 2020; Dossou et al., 2021; Xie et al., 2021). The researches of the VSESs patterns had extended from static spatial-temporal pattern analysis to long-time heterogeneity, multi-scale spatial dependence, multi-dimensional spatial-temporal imbalance and constant low agglomeration spatial detection (Pandey et al., 2017; Sarkar et al., 2022). The analysis of influencing factors of the VSESs had extended from the first geographical factors (such as climate, nature, resources, etc.) and the second geographical factors (such as location, transportation, economy, society, etc.) to the capital factor of farmers’ livelihood feasibility abilities (Jha et al., 2021; Cao et al., 2022).
In summary, although scholars had made many achievements for the VSESs, there were still the following shortcomings. 1) The existing evaluation of spatiotemporal pattern of the VSESs mainly revealed the pattern characteristics of spatiotemporal vulnerability from the independent temporal or spatial perspective, and it cased the research results had the characteristics of discontinuity and sectional. 2) Spatiality is the basic attribute of geographical phenomena and the basic foothold for the study of geographical problems (Bird and Shepherd, 2003). Geospatial spaces with high incidence of geographical phenomena was regarded as ‘spatial trap’. Such as the ‘spatial poverty trap’ was defined as the region with low geographical capital stock and high incidence of poverty. The identification of spatial trap was an important basis to block the diffusion of regional risks and promote regional coordinated development. It was of great significance to further explore the leading factors and driving mechanism of spatial and temporal differentiation of geographical phenomena to realize the geographical risk targeting and implementation of policies. However, the researches for spatial trap identification and validation were almost based on the hypothesis of the ‘geographical spaces with high value’, and emphasized the geographical spatial fixation and time duration. The essence of this research tests were to identify the local agglomeration of high-value regions, that is, the geographical space located in the ‘high agglomeration’ for a long time. However, in a long time scale, the geographical phenomenon which was born in the geographical spatial system was affected by the openness of the system, resulting in the change and development of the energy flow of the internal and external energy, and it was difficult to form a persistent and fixed geographical spaces of ‘high concentration’. Therefore, this hypothesis ignored the relativity and variability of the spatial trap, and the defined spatial trap was strictly only a ‘spatial absolute trap’. 3) Insufficient researches on the interaction effect of the VSESs influencing factors, leaded to differentiation in the interpretation degree of factors, and then affected the application of vulnerability targeting and precise reduction policies.

2 Study site

The case study area is situated in Qingpu District, a typical suburban district located on the west of Shanghai, bordering Zhejiang Province and Jiangsu Province. It extends over approximately 668 km2 and is divided into three sub-districts and eight towns, consisting of 184 villages in total. In the past 20 years, driven by external forces such as rapid urbanization and industrialization, the economic growth level, social employment degree and ecological and environmental governance of Qingpu District had been significantly improved. At the same time, the predatory industrial development modes, urban expansion, high density population flow driven regional social and economic development and local resources, ecological environment conflict, the ecological resources relying on rural resources allocation, industrial structure and social culture had a deep disturbance, profound influence the SESs sustainable development. The main performances were: 1) From 1998 to 2018, the urbanization rate of the region increased by 1.47% annually, the total population increased by 3.97 times, and the rural labor force was transferred to 1.5887 million people. 2) The total GDP increased from 31.72 billion yuan in 1998 to 107.433 billion yuan in 2018. However, the proportion of agricultural industry decreased by 8.01%. 3) The total areas of agricultural land use decreased by 817.92 ha, the water areas decreased by 824.69 ha, and the construction land increased by 954.29 ha. 4) Under the dual pressures of the population surge and the decreasing agricultural landscape areas, the plaque density increased by 2.57 pieces ha-1 annually, the plaque agglomeration degree decreased by 1.43, and the landscape diversity index decreased by 0.33 (Ren et al., 2019).

3 Methods

3.1 Evaluation of the VSESs

Vulnerability is a property of socio-ecological system, and its subsystems or system components exposed to environmental or socioeconomic changes, sensitivity to perturbations within and outside the system and transforming and impaired system structure and function due to lack of coping capacities (Damian et al., 2023). Among them, exposures subject to environmental interference are important stressors of vulnerability. Sensitivity to environmental interference, responsibility to environmental disturbances and resilience are key elements of vulnerability (Wu et al., 2021). However, the SESs is a human-land coupled system, whose vulnerability includes multiple dimensions of social, economic and ecological environment. Therefore, the ‘Social- Economic-Ecological-Sensitivity-Adaptability (SEE-SA)’ evaluation index system for the VSESs was constructed, which drew on the global vulnerability index of the SDGs and the existed vulnerability evaluation indicators, also combined the sensitivity with adaptability of the SESs. It not only covered social, economic, ecological and other environmental elements, but also can effectively represented the sensitive perception caused by the SESs to multi source disturbance factors in the suburbs of the city (Table 1). 1) Socio-ecological system sensitivity depended on the stability of the structure. Therefore, from the 3 dimensions of regional economic structure, social structure and ecological structure, 12 indicators were selected to represent the structure of industry, income, investment, employment, population, resources and habitat. 2) Socio-ecological system adaptability depended on the physical response mode and artificial consciousness. Therefore, 12 indicators were selected to represent the SESs adaptability from the aspects of regional economic development capacity, industrial production efficiency, coverage of social service guarantee, pollution control.
Table 1 Index of the socio-ecological system vulnerability in Qingpu District
Target Criterion Index Implication and attribute Weight
Sensibility Economic sensitivity Added value of agriculture The agricultural industrial structure (yuan) 0.0456
Added value The industrial and services industry structure (yuan) 0.0469
Rural-urban gap The urban-rural inequality (yuan) 0.0403
Foreign direct investment The regional investment structure (dollar) 0.0358
Social
sensitivity
Unemployment rate The regional employment structure (%) 0.0395
Net outflow of population The regional population flow structure (person) 0.0411
Abandoned construction land The construction land resources idle (ha) 0.0337
Abandoned farmland The farmland resources idle (ha) 0.0375
Ecological sensitivity Agricultural patch density The land fragmentation (piece ha-1) 0.0396
Agricultural fractal dimension The complexity of land use types (/) 0.0368
Vegetation coverage The ecological structure (%) 0.0587
Water area The habitat structure (ha) 0.0495
Adaptability Economic adaptability Annual gross output value The economic development (yuan) 0.0415
Proportion of agricultural industry The agricultural development (%) 0.0589
Commercial rate Production efficiency of agricultural industry (%) 0.0412
Diversification Stability and equilibrium of regional industries (/) 0.0445
Social
adaptability
Agricultural machinery gross power The degree of agricultural modernization (kW ha-1) 0.0469
Amount of rural employment The social stability (person) 0.0413
Total population The human development potential (person) 0.0454
Public service coverage The abilities of the social services (%) 0.0456
Ecological adaptability Annual sewage capacity The abilities of the environmental resilience (t) 0.0268
Ratio up to the water quality The abilities of environmental governance (%) 0.0266
Environment protection investment The abilities of environmental protection (yuan) 0.0351
Average amount of fertilizer applied The environmental awareness (t km-2) 0.0412
The sequential polygon area and polyhedral volume method were used to evaluate the vulnerability subsystem and the SESs vulnerability, respectively. 1) Evaluation of the vulnerability. The comprehensive hierarchy method and entropy weight method were used to determine the weight of each index, and corrected according to the variance decomposition results, and finally generate the VSESs concept formula. The calculation process was shown in literature (Jin et al., 2020). 2) Evaluation of the vulnerability subsystem. The methods of the sequential polygon area method to characterize the vulnerability subsystem index, and the polygon area value composed by polyhedral volume projection were used. The calculation process was also shown in reference (Jin et al., 2020). 3) Classification of vulnerability grades. As the classification of VSESs had not formed a unified standard, according the researches of the urban vulnerability (Fang et al., 2016), rural vulnerability (Li et al., 2020) and so on, 5 grades for the vulnerability were divided: low vulnerability [0,0.398], below average vulnerability (0.398, 0.597], average vulnerability (0.597, 0.698], above average vulnerability (0.698, 0.764] and top vulnerability (0.764, 1.000].

3.2 Dynamic interaction analysis of the VSESs

The method of the ESDA analysis was used to analyze the VSESs in 184 administrative villages in Qingpu District to reveal their spatial association and agglomeration characteristics. As this method was relatively mature, the detailed analysis steps were shown in reference (Ren, et al., 2019). Time dimension was added to the LISA based on the ESDA analysis, so that the static LISA enabled the continuous dynamic expression (Ye and Rey, 2013). The geometric features of the LISA temporal path trajectory were characterized by the relative length and curvature degree. The formulas were as follows.
N i = n × t = 1 T 1 d L i , t , L i , t + 1 i = 1 n t = 1 T 1 d L i , t , L i , t + 1
D i = t = 1 T 1 d L i , t , L i , t + 1 d L i , t , L i , T
where Ni is the relative length; Di is the curvature degree; n is the number of administrative villages; T is the time interval; Li,t is the LISA coordinates (yi,t , yLi,t) in the Moran’s I scatter plots of the i-th village in year t; d(Li,t , Li,t+1) is the moving distance of the i-th village from year t year to t+1; d(Li,t , Li,T) is the moving distance of the i-th administrative village from year t year to the last year. Ni expresses the dynamics of local spatial structure. The larger value of Ni denotes the stronger dynamics of regional vulnerability. Di expresses the fluctuation degree in local spatial dynamic paths, and the larger the value indicates the more significant the increase of the regional vulnerability.
The temporal path of LISA describes the temporal trajectory of the spatial units moving on the Moran’s I scatter plots. However, the spatiotemporal transition of LISA can further analyze the dynamic change process of local spatial relations between neighborhoods in order to reveal the spatial dependence of local vulnerability. The spatiotemporal transition processes of LISA are usually expressed by the transition probability matrix and spatiotemporal transition types, which can be divided into 4 types: TP0, TP1, TP2 and TP3. Based on Rey’s research, spatiotemporal flow and spatial-temporal cohesion were used to denote the spatial pattern path dependence and locking characteristics of the research units (Rey, 2001). The formula were as follows.
S C t = F 0 , t n
S F t = 1 S C t
where SC∈[0,1] is spatiotemporal cohesion index, the larger values of the SC indicate the greater spatial stability of vulnerability. SF∈[0,1] is spatiotemporal flow index, the larger values of the SF indicate the greater spatial dynamics of vulnerability. The t is the research period, the F0,t is the number of administrative villages with TP0 type transition in the SESs vulnerability, the n is the number of transitive villages that may occur within the region.

3.3 Influencing factors analysis for dynamic evolution of the VSESs

The VSESs was affected by a combination of multiple geographical factors, and each factor showed a cyclic cumulative effect (Su and Huang, 2018). According to the concept of the VSESs, exposure to environmental interference was an important stressor and a core component of vulnerability. Internal and external exposure produced under the influence of regional external environmental change and internal brittle receptors transformation was the key factors affecting the vulnerability change (Lv et al., 2019; Butt et al., 2022). Therefore, from the perspective of environmental exposure, the 8 factors expressing environmental exposure and ability exposure were selected to analyze the major influencing factors of the spatial and temporal evolution of the VSESs and further explore the rules of the formation and mechanism for vulnerability differentiation in suburban suburbs (Table 2).
Table 2 Influencing factors of the socio-ecological system vulnerability
Target Criterion Index Statistical method
Environmental exposure Economic factors Z1 GDP per area (yuan km-2) GDP per area of the village
Social factors Z2 Fiscal expenditure (yuan yr-1) The expenditures of science, education, cultural and health on the village
Ecological factors Z3 Proportion of ecological land (%) The proportion of cultivated land, garden land, forest land, grassland, water in the village
Abilities exposure Natural capital factors Z4 Cultivated land (person ha-1) Agricultural labor/cultivated land of the village
Physical capital factors Z5 Household assets (yuan household-1) The total arrests of productive assert, house asset, living asset
Human capital factors Z6 Immigrant laborers (person-time yr-1) Annual numbers of the immigrant workers
Social capital factors Z7 Re-education (person-time yr-1) Participation in technical training, employment guidance, learning relevant policies
Financial capital factors Z8 Proportion of nonagriculture (%) Non-agricultural assets/total investment capital
The reliability of this batch of the livelihood data was tested by the Cronbach’s alpha coefficient method in order to ensure the validity. The test results showed that the overall sample data reliability was high (the coefficient was 0.8098), which met the research requirements.
The method of Geographic Detectors were used to analyze the spatiotemporal heterogeneity of the VSESs and its interaction mechanism of the dynamic evolution. Geographic Detectors is based on spatial differentiation theory and set theory, and analyses the determining indicator Qv of regional differentiation by spatial superposition technique to test the consistency of the spatial partition and multifactorial distribution of single factors (Wang and Xu, 2017).The Qv formula was as follows.
Q v = 1 1 n σ 2 h = 1 l n h σ h 2
where the nh is the number of samples within the type h included in the factor Ai. The n is the number of all samples in the study area. The l is the number of classifications of the factor Ai. The σ 2 is the discrete variance and the σ h 2 is the discrete variance of the secondary region.
To determine the explanatory force of multiple influence factor interactions on the spatial and temporal separation of the VSESs and reveal the mechanism of interaction occurrence, interaction detection of the Geographic Detectors was used to analyze the differential of multifactorial strength, direction, linearity, or nonlinearity. The purpose of interaction detection was to analyze whether two influencing factors acting together increase or weaken the explanatory power of changes for the VSESs, or to analyze whether the effects of two factors on vulnerability is independent relationship (Below et al., 2012; Prasetyo et al., 2020).

4 Data

4.1 Data source

1) The geospatial data. Land use map of the 1:5000 in Qingpu District of the year 1998, 2008 and 2018. 2) The social data. The Statistical Yearbook of Qingpu District (1999-2019), the National Economic and Social Development Statistical Bulletin of Qingpu District (1999-2019), the Township Statistical Yearbook of Qingpu District (1999- 2019), the Agricultural Statistical Yearbook of Qingpu District (1999-2019), the Industrial Development Report of Qingpu District (1999-2019), the Forestry Statistical Yearbook of Qingpu District (1999-2019), the Land Consolidation Plan of Qingpu District (2010-2020), and the General land use plan of Qingpu District (2006-2020) were used. 3) The investigation data. Land data in village scale came from the ‘Rural Collective Construction Land Census’, which organized by Qingpu District Natural Resources Bureau. The social and economic data of farmers came from the rural fixed observation points of Qingpu District and the survey data. In addition, 5 members from the research group conducted a participatory farmer survey from July to October in 2019 (a total of 1485 questionnaires were distributed, with an effective recovery rate of 95%).

4.2 Data processing

1) The land categories of Qingpu District for different years were transformed and divided into 8 types of cultivated land, garden land, forest land, grassland, construction land, transportation land, water area and unused land. 2) The land use vector maps of Qingpu District were converted into the grid maps with pixel of 30 m×30 m, and the numbers of unused land patches, landscape dimension index and patch density index were used to calculate by software of Fragstats 3.3. 3) Water areas and vegetation coverage were calculated using the spatial statistical function of the ArcGIS 10.0. 4) In order to eliminate the effect of price changes on the timing data, the index of GDP was leveled in the year of 2018 as the base period.

5 Results

5.1 Evaluation results of the VSESs

The VSESs of 184 villages in Qingpu District of the year 1998, 2008 and 2018 was evaluated by software of MATLAB, ArcGIS and SPSS, and obtained the following results (Table 3).
Table 3 Results of the vulnerability assessment for Qingpu District in the year 1998, 2008 and 2018
Region Sensibility Adaptability Vulnerability
1998 2008 2018 1998 2008 2018 1998 2008 2018
Xujing 0.468 0.589 0.549 0.485 0.527 0.543 0.554 (II) 0.764 (IV) 0.734 (IV)
Zhaoxiang 0.428 0.567 0.504 0.469 0.514 0.530 0.597 (II) 0.756 (IV) 0.721 (IV)
Huaxin 0.409 0.498 0.518 0.512 0.528 0.534 0.601 (III) 0.721 (IV) 0.705 (IV)
Chonggu 0.411 0.537 0.462 0.499 0.519 0.525 0.582 (II) 0.698 (III) 0.654 (III)
Baihe 0.346 0.453 0.417 0.535 0.569 0.597 0.448 (II) 0.638 (III) 0.619 (III)
Xiayang 0.648 0.677 0.667 0.419 0.548 0.648 0.595 (II) 0.711 (IV) 0.531 (II)
Yingpu 0.614 0.712 0.679 0.434 0.502 0.612 0.604 (III) 0.734 (IV) 0.568 (II)
Xianghuaqiao 0.587 0.697 0.660 0.487 0.529 0.599 0.619 (III) 0.741 (IV) 0.625 (III)
Zhujiajiao 0.334 0.477 0.429 0.669 0.711 0.747 0.385 (I) 0.562 (II) 0.533 (II)
Liantang 0.308 0.566 0.519 0.586 0.615 0.622 0.398 (I) 0.596 (II) 0.581 (II)
Jinze 0.244 0.376 0.332 0.671 0.699 0.734 0.314 (I) 0.579 (II) 0.557 (II)
avg. in QP 0.436 0.545 0.512 0.524 0.569 0.608 0.518 (II) 0.682 (III) 0.621 (III)
avg. in ER 0.412 0.599 0.570 0.500 0.531 0.546 0.556 (II) 0.716 (IV) 0.687 (III)
avg. in CR 0.616 0.695 0.669 0.447 0.526 0.620 0.606 (III) 0.729 (IV) 0.575 (II)
avg. in WR 0.295 0.473 0.427 0.642 0.675 0.701 0.366 (I) 0.579 (II) 0.557 (II)

Note: I expressed the low vulnerability; II expressed the below average vulnerability; III expressed the average vulnerability; IV expressed the above vulnerability; V expressed the top vulnerability; QP expressed the Qingpu District; ER expressed the Eastern Region; CR expressed the Central Region; WR expressed the Western Region.

1) The temporal heterogeneity of the vulnerability subsystems was significant. The index range of threshold for sensitivity and adaptability of the subsystems vulnerability in Qingpu District were [0.124,0.805] and [0.179,0.793] from the year 1998 to 2018, respectively. Yet the index of sensitivity showed variation a trend of ‘up first and then down’, and the index of adaptability showed ‘gradual advance’, respectively. Thereinto, the index of sensitivity increased from 0.436 (in the year 1998) to 0.545 (in the year 2008), an increase of 20.00%, but decreased to 0.512 by the year 2018. The cumulative increase of the index was 14.84% during the study period. 2) The spatial disequilibrium of the subsystems vulnerability was significant. The index of sensitivity of Qingpu District showed the characteristics of ‘High in the center, low in all sides’. The specific spatial distribution of the index mean value was the Central Region (0.660) > Eastern Region (0.460)>Western Region (0.398). The maximum index value of sensitivity was 0.668 in Yingpu town in the Central Region, yet the minimum index value of sensitivity was 0.317 in Jinze town in the Western Region. Meanwhile, the index adaptability presented the characteristics of ‘high in the west and low in the east’, and the index mean value was the Western Region (0.673) >Central Region (0.531) >Eastern Region (0.526). 3) The spatial-temporal pattern of the VSESs presented the dynamic characteristics of ‘the rolling change of increase first and then decrease’ and ‘the agglomerate change of high in the east and low in the west’. The index value of the VSESs in Qingpu District increased from 0.518 to 0.621 and the grades increased from low to medium during the research period. The VSESs had increased 131.72% from the year 1998 to 2008, yet it had decreased 9.21% from the year 2008 to 2018. Meanwhile, the spatial distribution of the VSESs presented the dynamic characteristics of ‘the agglomerate change of high in the east and low in the west’.

5.2 Dynamic characteristics of the VSESs

5.2.1 Spatial association characteristics

The global spatial autocorrelation of the VSESs index was significant. The results showed that the Z values under the 5% significance were 5.68 (in 1998), 6.97 (in 2008) and 8.54 (in 2018), respectively. All the Z values were above the threshold of 1.96. The results verified that vulnerability of different years in the region scale presented the characteristics of agglomeration. The index of the Global Moran’s I for vulnerability of the administrative villages was 0.385 (in 1998), 0.425 (in 2008), and 0.468 (in 2018), respectively, which was all greater than 0, indicating a significant clustering characteristic in the village scale.

5.2.2 Spatio-temporal interaction characteristics

1) The relative length of temporal path changes of vulnerability for LISA decreased gradually from the center to the periphery during the study period (Fig. 1a). There were 107 administrative villages in the top and above average grades, with a total areas of 399.69 km2, mainly distributed in the Central Region. The results showed that the local spatial structure of the VSESs in region was strongly dynamic and unstable. However, 77 administrative villages in the low and average grades accounting for 35.21% of the total areas, mainly distributed in the north and southwest of the region. The curvature of temporal path changes of the VSESs for LISA was relatively small from the year 1998 to 2018. There were 108 administrative villages with low and average grades, accounting for 58.70%, showing the spatial pattern of high in the north and south regions and low in the central region (Fig. 1b). The spatiotemporal characteristics of the relative length and curvature of the LISA temporal path of it indicated that the local spatial structures were strongly dynamic and unstable. Those results above also verified the correctness of the spatial and temporal variation of the vulnerability. That is, although the grades of the VSESs raised from low (0.518) to average (0.621), the regional discrepancy of vulnerability was large. 2) In order to further analyze the dynamic processes of local spatial association among the VSESs in administrative villages, transition probability and spatiotemporal transition matrix of LISA were used to depict the transition characteristics of local spatial correlation types (Table 4). On the whole, the VSESs in Qingpu District had poor spatial cohesion and unstable spatial pattern, and also had strong transfer activity. The results of the different research periods were showed that the TP1 and TP2 became the two types with the largest proportion of vulnerability spatiotemporal transitions, accounting for 20.70% and 19.10%, respectively. In addition, although the spatiotemporal flow index of the VSESs was 0.504 from the year 1998 to 2018, the spatiotemporal cohesion was still strong, and the spatial pattern was relatively stable, showing the characteristics of path dependence and locking. Cracking the path dependence and path locking of administrative villages had become the focus of reducing vulnerability in the future.
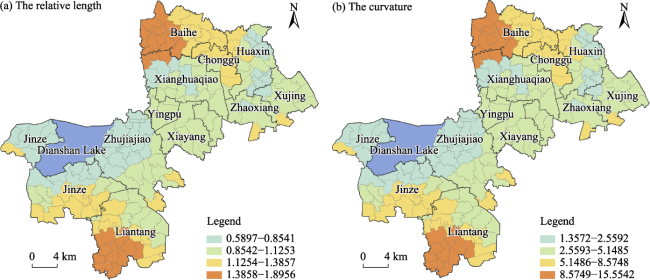
Fig. 1 Dynamic interaction characteristics of the vulnerability in Qingpu District
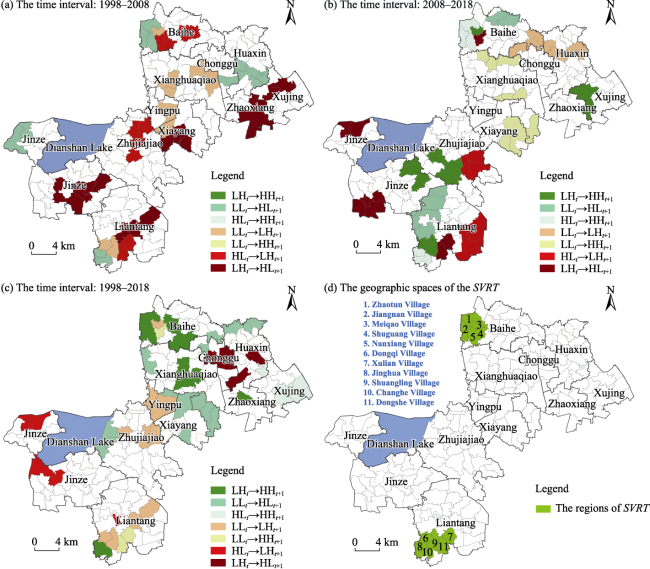
Table 4 Spatio-temporal transition matrices of the vulnerability from the year 1998 to 2018
Time interval t/t+1 HHt+1 LHt+1 LLt+1 HLt+1 Unit Proportion for the unit (%) Type Proportion for the type (%) SF SC
1998-2008 HHt 0.535 0.246 0.125 0.094 106 49.87 TP0 48.55 0.5145 0.4855
LHt 0.172 0.513 0.114 0.201 46 21.55 TP1 20.70
LLt 0.126 0.242 0.468 0.164 38 17.54 TP2 14.05
HLt 0.112 0.216 0.246 0.426 24 11.04 TP3 16.70
2008-2018 HHt 0.488 0.201 0.084 0.227 118 55.24 TP0 52.48 0.4753 0.5248
LHt 0.215 0.509 0.119 0.157 41 18.96 TP1 18.25
LLt 0.099 0.247 0.524 0.130 30 14.22 TP2 19.10
HLt 0.171 0.067 0.184 0.578 25 11.58 TP3 10.18
1998-2018 HHt 0.545 0.101 0.128 0.226 113 53.24 TP0 49.60 0.5040 0.4960
LHt 0.112 0.511 0.215 0.162 36 16.66 TP1 17.25
LLt 0.098 0.183 0.487 0.232 38 17.58 TP2 20.63
HLt 0.201 0.113 0.245 0.441 27 12.52 TP3 12.53

Note: The shadow parts were the transition types of the ‘spatial vulnerability relative trap’.

5.3 Geographic identification of the ‘spatial vulnerability traps’

According to the concept of ‘spatial poverty trap’ created by some scholars (Bird and Shepherd, 2003), meanwhile based on the spatial agglomeration verification of regional poverty, we tried to introduce those concepts into the VSESs research. The concept of ‘spatial vulnerability trap, SVT’ was proposed. In order to better reflect the relativity and variability of the SVT, we extended the concept of the SVT to ‘spatial vulnerability absolute trap, SVAT’ and ‘spatial vulnerability relative trap, SVRT’. 1) The constructed concept of the SVAT was judged by ‘persistent occurrence geographic spaces with high vulnerability’. That is, the geographical spaces had been in high and continuous vulnerability. 2) The constructed concept of the SVRT was judged by ‘the relative fixation and the dynamic change of the vulnerability’ as the evaluation hypothesis. Of these, the SVAT reflected the inherent attribute and deprivation mechanism of geographical resource endowment. However, the SVRT reflected the short-term change process of vulnerability stickiness, and it may provide a basis for managers to prevent and control the vulnerability risks. The verification methods and procedure were as follows. 1) Geographic identification of the SVAT. The high grade vector layers (above average and top grades) of the SESs vulnerability in village scale and the HH region vector layers of the LISA were superimposed at three time points (the year of 1998, 2008 and 2018), and the areas of the layer superposition were identified as the geographic spaces of the SVAT. 2) Geographic identification of the SVRT. The high grade vector layers (above average and top grades) of the SESs vulnerability in village scale and the spatiotemporal transition vector layers of the LISA were superimposed at three time points (the year of 1998, 2008 and 2018). In order to reflect the relativity and variability of the SVRT, spatiotemporal transition types of the LISA mainly selected LHt→HHt+1 & LLt→LHt+1 of the TP1, HLt→ HHt+1 & LLt→HLt+1 of the TP2, and LLt→HHt+1 & HLt→LHt+1 & LHt→HLt+1 of the TP3, totaling the seven types (Table 4).
The verified results showed that, 1) the SVAT did not exist in Qingpu District form the year 1998 to 2018. Although the results of the global spatial autocorrelation analysis showed that the overall high vulnerability in this region had significant agglomeration characteristics, and had the initial premise of the SVT generation, the relative length and curvature of the temporal path of the SESs vulnerability for LISA showed that the local spatial structures of administrative villages was strongly dynamic and unstable. 2) The SVRT did exist, and it was mainly distributed rounding the areas of the administrative boundary in the northern and southern parts of the Qingpu District, totaling 11 administrative villages. To better reveal the geographical nature of the SVRT, the study explores the possible causes from the following aspects. The possible reasons for generation the SVRT were as follows (Fig. 2). The geographical spaces of the SVRT distributed all around the administrative boundaries of the Shanghai city. The 5 administrative villages in the north were close to Kunshan County in Jiangsu Province, while the 6 administrative villages in the south were close to Jiashan County in Zhejiang Province. It can be seen that there may be a certain regional sealing in the process of implementing the measures of the VSESs reduction, which was specifically reflected the relatively weak effect of reducing vulnerability in the areas around the administrative boundaries, providing a ‘natural greenhouse’ for the SVRT. Those results of the SVRT were consistent with the validation results of Jin et al. for the ‘spatial poverty trap’ (Jin et al., 2020). All the geographical spaces of the SVRT were distributed basically far away from the city and county center, and also far away from the socio-economic radiation range. Although the improvement of road network and other conditions had broken the original closed state to some extent, most areas had been still in a relatively closed and independent development state, easily to come into being the ‘isolated islands’ of the VSESs, which further exacerbated the formation of the SVRT.
Fig. 2 Spatio-temporal transition distribution and the trap of the vulnerability in Qingpu District

5.4 Geographic detection for dynamic evolution of the VSESs

The VSESs in the village scale is synthetic effected by multiple factors. The factors in two dimensions of regional environment and regional capability were selected to analyze single factor detection and dual factors interaction detection of vulnerability in different years.

5.4.1 Influencing factors detection

1) The influencing factors varied significantly, and the dominant influence factors were prominent. The dominant factors affecting the spatiotemporal differentiation of the SESs vulnerability in this region were Z7, Z6, Z2, Z1, Z3 and Z8, and the corresponding average was 0.0230, 0.0221, 0.0194, 0.0182, 0.0162 and 0.0146, respectively. However, the factors of the Z4 and Z5 did not pass the 5% significance tests (Table 5). 2) The influences of the 6 dominant factors presented the fluctuating changes and the types differences. The influences of the factors Z7 and Z2 increased year by year, while that of the factors Z6, Z1 and Z3 initially increased and then decreased, yet the influences of the factor Z8 was the opposite, that is initially decreased and then increased. 3) The capacities exposure of villages had become the main sources of threat affecting the VSESs. On the basis of excluding the factors Z4 and Z5, the cumulative value of environmental exposure (0.538) was 9.98%.
Table 5 Influencing factors on the vulnerability in the year 1998, 2008 and 2018
Year Z1 Z2 Z3 Z4 Z5 Z6 Z7 Z8
1998 0.0148 0.0134 0.0158 0.059 0.044 0.0177 0.0145 0.0168**
2008 0.0197 0.0218 0.0217** 0.035 0.028 0.0246** 0.0267 0.0114
2018 0.0202** 0.0229** 0.0111 0.018 0.031 0.0241 0.0278** 0.0157
Avg. 0.0182 0.0194 0.0162 0.037 0.034 0.0221 0.0230 0.0146
Max. 0.0202 0.0229 0.0217 0.059 0.044 0.0246 0.0278 0.0168

Note: ** expressed significance level of 5%.

5.4.2 Influencing factors interaction detection

The results of the single-factorial Geographical Detection can only analyze the influence of single factors, while the VSESs was affected by multiple factors in practice, with the mutual influences and the circular cumulative effects (Wang and Xu, 2017). Therefore, the effects of the dual factors on the VSESs were analyzed by interactive detection of the Geographical Detection (Table 6).
Table 6 Results of interactive detection on the dynamic evolution of the vulnerability in Qingpu District
Year Q/QA∩B The dominant affecting factors
Z1 Z2 Z3 Z6 Z7 Z8
1998 Z1 0.0148
Z2 0.0378BE 0.0134
Z3 0.0351BE 0.0548BE 0.0158
Z6 0.0547NE 0.0556NE 0.0484NE 0.0177
Z7 0.0441NE 0.0511NE 0.0448NE 0.0538BE 0.0145
Z8 0.0365NE 0.0498NE 0.0475NE 0.0524BE 0.0561BE 0.0168
2008 Z1 0.0197
Z2 0.0509BE 0.0218
Z3 0.0469BE 0.0501NE 0.0217
Z6 0.0505NE 0.0519BE 0.0520NE 0.0246
Z7 0.0423NE 0.0487NE 0.0439NE 0.0519NE 0.0267
Z8 0.0368NE 0.0466NE 0.0458NE 0.0517BE 0.0526BE 0.0114
2018 Z1 0.0202
Z2 0.0502BE 0.0229
Z3 0.0395BE 0.0411NE 0.0111
Z6 0.0520NE 0.0552BE 0.0439NE 0.0241
Z7 0.0499NE 0.0494NE 0.0411BE 0.0509BE 0.0278
Z8 0.0446NE 0.0475BE 0.0355NE 0.0485NE 0.0507BE 0.0157
TQ 0.6718 0.7407 0.6704 0.7734 0.7313 0.7026

Note: The shadow parts were the influence of the single-factor; BE indicated the both enhancement of the dual factors; NE indicated the nonlinear enhancement of the dual factors; Q indicated influences of the single-factor; QA∩B indicated interaction influences of the two-factors; TQ indicated the cumulative interaction influences of the factors.

(1) The interactional influences of dual factors were stronger than that of single factor and were dominated by the type of the NE. According to the results of interactional influences in different years, the interactional types of any dual factors were the BE or NE, with no existence the types of the IR or NR. Thereinto, the interactional influences of the Z2, Z6, Z7 and Z8 were 185.95% higher than that of the single factors, proving to be the strongest exposed factor groups affecting the VSESs in Qingpu District. The above results showed that the interactional influences of dual factors had more profound impact on the VSESs in Qingpu District, and the circular cumulative effects of the dual factors had become the keys to the comprehensive reduction of vulnerability in this region.
(2) The interactional influences of dual factor presented differentiations in dimension, and the interactional influences of the regional capability were a little bit stronger than that of the regional environmental. The cumulative interaction influences of the factors were Z6, Z2, Z7, Z8, Z1 and Z3 from the year 1998 to 2018. The average cumulative influences of the three kinds of regional capabilities was 0.7358, while that of regional environment was 0.6943 in the research period.

5.4.3 Interaction influence mechanisms for the dynamic evolution of the VSESs

(1) The influence mechanism of the dominant factors. The results of the single-factorial Geographical Detection showed that Z7, Z6, Z2, Z1, Z3 and Z8 were the dominant factors influence the spatiotemporal differentiation of the SESs vulnerability in Qingpu District.
Social Capital Factors (Z7). As the most important endogenous capital to affect the VSESs, the social capital was mainly characterized by the degree of re-education and policy awareness, and is the core of farmers’ cognitive ability. When farmers faced the opportunities and risks, the degree of their cognitive ability had an important impact on improving their adaptability to reduce vulnerability, and it is the sustainable capital for farmers to avoid the vulnerability risks (Below et al., 2012). Human Capital Factors (Z6). It is the main pillar and livelihood capital of farmers, as well as the core capital of regional social and economic development. It reflects the quantity and structure of labor, human capital level and the development abilities. Meanwhile, it is also a key endogenous capacity for sensitivity and adaptability affecting the VSESs. Social Factors (Z2). As an exogenous environmental factors, they reflected the strength of government support and the level of public services guarantee, and greatly transformed the VSESs mainly by affecting the regional adaptabilities. Social factors had relied on the instrumental policies and regional measures, such as the fiscal expenditures on science education and cultural and health, infrastructure construction expenditures, fiscal subsidy policies, etc., to realize the coverage and investment of the public services, thus forming a ‘blood-refresh mode’ to improve the regional resilience. Economic Factors (Z1). As the factors of environmental exposure, those were the core factors affecting the sensitivity, reflecting the level of regional industrialization, industrial structure and resource efficiency. It produced a deep disturbance to the resource allocation of the SESs relied on the agriculture, which increased the sensitivity. Ecological Factors (Z3). As the factors reflecting the regional ecological endowment and the expansion scale of land urbanization, they were important regional potential resources and had a great impact on the regulatory adaptability. Financial Capital Factors (Z8). As the factors of the regional capacity, they reflected the differentiation of farmer’s economic capital and the diversification of livelihoods, which were the important factors affecting the adaptability. For the metropolitan suburbs with more people and less land, the lack of natural capital for farmers was serious in the process of the rapid urbanization. As an important supplement of the insufficient livelihood capital, financial capital forced farmers to adopt diversified strategies of livelihood to realize the transformation, and enhanced farmers' awareness of economic safety to cope with the risks of abilities exposure and reduce vulnerability.
(2) The interactive influence mechanism of the dominant factors. Based on the values of the cumulative influence ranking and the grades of the VSESs, the types of the interactive influence for dominant factors were divided into the comprehensive impact type (TC-I), the endogenous ability constraint type (TA-I) and the exogenous environmental intimidation type (TE-I), so as to explore the interactive influence mechanism.
The comprehensive impact type (TC-I). This type was composed of the human capital factors exposed for the endogenous abilities and social factors exposed to exogenous environment. It was the most influence power of interactive type affecting the VSESs in Qingpu District. The geographical spaces of this type was prone to generate the vicious cycle of the vulnerability and came into being the SVRT. Meanwhile, the areas of this type was generally in a relatively closed areas which were far away from the center of cities and counties, with the single industrial structure. Normally, subject to the relatively inferior geographical location, the areas of the TC-I were difficult to accept economic radiation. The slow development of regional economy led to the increasing cumulative effects of the VSESs. In order to improve their own economic situation, the livelihood capital of regional farmers had been seriously differentiated, resulting in a large amount of labors outflow and resources idle, aggravating the accumulation of the VSESs. The endogenous ability constraint type (TA-I). The endogenous capacities affected the adaptability and had become the major ‘contribution sources’ to the evolution of the VSESs. The factors of this type were composed of the social capital and financial capital for the endogenous abilities, which mainly affected the adaptability of the SESs through the transformation of cognitive abilities and household strategies of the farmers. The geographical spaces of this type commonly had good location conditions and mature development. Normally, the areas had good geographical capital and economic location. Although the natural capital of farmers was greatly reduced or even missing in the rapid social and economic development in this areas, it had accumulated a large number of physical capital and financial capital, making it easily to realize the choices and transformation of household strategies of the farmers. In addition, the adequacy of public services and the easy accessibility of public resources had encouraged them to pay more attention to re-education and policies perception, and then timely adjusted their household strategies to cope with internal and external risks. The exogenous environmental intimidation type (TE-I). The exogenous environment greatly impacted the sensitivity of the SESs, and was the core of interference to the VSESs transition. The factors of this type was composed of economic factors and ecological factors exposed by the exogenous environment, which mainly affected the evolution of the SESs sensitivity by systemic factors transformation such as the ecological resources endowment, the productive efficiency and the industrial structures. The geographical spaces of this type was commonly in the suburb close to the city center. Normally, in the process of rapid urbanization and industrialization, the overall structures of this areas had greatly changed, such as the increased economic aggregate, the rapid expansion of and construction land scale, the sharp decrease of ecological resources, the surge of total population, the outflow of agricultural population and the transformation industries, which had caused the great disturbance to the suburbs. In addition, the openness of man-land system, the relevance of industries and the synergy of regional functions leaded to multi-factors coupling, which finally produced the comprehensive pressures of the ‘resource-population-economy-society’.

6 Discussion

The units of this study were the administrative villages. Although in-depth analysis and access to kinds of data, such as various yearbooks, reports and interview data and so on, there were still a lack of temporal and spatial data in some administrative villages. Therefore, in the process of data processing, using the practices of predecessors, the village dot data were used to the whole village, and the averages were used to replace some missing data.
The vulnerability evaluation indicators should include economy, politics, culture, environment, society, geography and so on, but the research focused on the plastic economic capital ability, social transformation advantages and ecological environmental protection awareness, so as to highlight the characteristics of the VSESs in the suburbs. Meanwhile, the geographical elements (such as topography, soil, climate, etc.) in the new economic geography had less selection, mainly based on the assumption that the less differences in geographical elements caused by the small scale of the case area.
In essence, the verification methods of the SVT was still a continuous agglomeration that strictly followed the high values of geographical elements. The successful application of this method must require the two very important conditions, none was dispensable. That is, the high grade of the VSESs and occurrence the spatiotemporal transitions. Thus, persistent vulnerability was merely a relative concept. This persistent vulnerability will eventually collapse as the elements flowing. Therefore, the length of time is a decisive factor in the existence of the SVT. Although in the study period of the year 1998 to 2018 when the SVT was present, it did not represent the existence of the SVT in all time periods.

7 Conclusions

The spatio-temporal heterogeneity of the VSESs was significant. The threshold of the sensitivity and adaptability was [0.124,0.805] and [0.179,0.793] in Qingpu District from the year 1998 to 2018, and the trends of the two index showed the ‘up first and then down’ and ‘gradual increase’, respectively. Yet the two index had the spatial disequilibrium characteristics of the ‘high in the center, low in all sides’ and ‘high in the west and low in the west’, respectively.
The spatial condensation of the SESs was poor, having the strong transition, and the SVRT did exist. Due to the spillover effect of the administrative villages, the cohesion index of the vulnerability spatiotemporal transition was 0.496. The dynamic structures of the high transformation and low path locking caused the significant spatiotemporal transition of the VSESs. However, the SVAT was not detected during the study period. Meanwhile, Affected by regional closure, regional competitiveness and the circular cumulative effects of the VSESs, the SVRT was detected, and its geographical spaces mainly distributed rounding the areas of the administrative boundary in the northern and southern parts of the Qingpu District, totaling 11 administrative villages.
The influence of ability factors went beyond that of environmental factors and dominated the spatiotemporal evolution of the VSESs. The environmental factors represented by fiscal subsidy policy, infrastructure construction input and land urbanization in the rapidly developing metropolitan suburbs had important impacts on the VSESs. However, the spatio-temporal evolution of it in the suburbs was dominated by the ability factors represented by human capital, cognitive ability and economic capital. The main types of the interactive influence leading to the differentiation of the VSESs in Qingpu District can be divided into the comprehensive impact type, the endogenous ability constraint type and the exogenous environmental intimidation type. The comprehensive impact type was the most important combination affecting the VSESs in Qingpu District, and was easy to form the SVRT. The endogenous capacities affected the adaptability and had become the major ‘contribution sources’ to the evolution of the VSESs. The exogenous environment greatly impacted the sensitivity of the SESs, and was the core of interference to the VSESs transition.
[1]
Bai J, Li J L, Bao A M, et al. 2021. Spatial-temporal variations of ecological vulnerability in the Tarim River Basin, Northwest China. Journal of Arid Land, 13(8): 814-834. (in Chinese)

DOI

[2]
Below T B, Mutabazi K D, Kirschke D, et al. 2012. Can farmers’ adaptation to climate change be explained by socio-economic household-level variables? Global Environmental Change, 22(1): 223-235.

[3]
Bird K, Shepherd A. 2003. Livelihoods and chronic poverty in semi-arid Zimbabwe. World Development, 31(3): 591-610.

[4]
Butt N, Halpern B S, O'Hara C C, et al. 2022. A trait-based framework for assessing the vulnerability of marine species to human impacts. Ecosphere, 13(2): e3919. DOI: 10.1002/ECS2.3919.

[5]
Cao J S, Yang Y Q, Deng Z Y, et al. 2022. Spatial and temporal evolution of ecological vulnerability based on vulnerability scoring diagram model in Shennongjia, China. Scientific Reports, 12(1): 1-16.

[6]
Cinner J E, Huchery C, Darling E S, et al. 2013. Evaluating social and ecological vulnerability of coral reef fisheries to climate change. Plos One, 8(9): e74321. DOI: 10.1371/journal.pone.0074321.

[7]
Damian N, Mitrică B, Mocanu I, et al. 2023. An index-based approach to assess the vulnerability of socio-ecological systems to aridity and drought in the Danube Delta, Romania. Environmental Development, 45: 100799. DOI: 10.1016/J.ENVDEV.2022.100799.

[8]
Dossou J F, Li X X, Sadek M, et al. 2021. Hybrid model for ecological vulnerability assessment in Benin. Scientific Reports, 11: 2449. DOI: 10.1038/S41598-021-81742-2.

PMID

[9]
Fang C L, Wang Y, Fang J W. 2016. A comprehensive assessment of urban vulnerability and its spatial differentiation in China. Journal of Geographical Sciences, 26(2): 153-170. (in Chinese)

DOI

[10]
Guo B, Zang W Q, Luo W. 2020. Spatial-temporal shifts of ecological vulnerability of Karst Mountain ecosystem-impacts of global change and anthropogenic interference. Science of the Total Environment, 741: 140256. DOI: 10.1016/j.scitotenv.2020.140256.

[11]
Gupta A K, Negi M, Nandy S, et al. 2020. Mapping socio-environmental vulnerability to climate change in different altitude zones in the Indian Himalayas. Ecological Indicators, 109: 105787. DOI: 10.1016/j.ecolind.2019.105787.

[12]
Jha S K, Negi A K, Alatalo J M, et al. 2021. Socio-ecological vulnerability and resilience of mountain communities residing in capital constrained environments. Mitigation and Adaptation Strategies for Global Change, 26(8): 1-23.

[13]
Jin G, Deng X Z, Dong Y, et al. 2020. China’s multidimensional poverty measurement and its spatiotemporal interaction characteristics in the perspective of development geography. Acta Geographica Sinica, 75(8): 1633-1646. (in Chinese)

[14]
Li H, Zhao X Y, Wang W J, et al. 2020. Inherent vulnerability of rural society in Gannan Plateau, China and its influencing factors. Scientia Geographica Sinica. 40(5): 804-813. (in Chinese)

DOI

[15]
Li Z H, Deng X Z, Zhang Y. 2021. Evaluation and convergence analysis of socio-economic vulnerability to natural hazards of Belt and Road Initiative countries. Journal of Cleaner Production, 282: 125406. DOI: 10.1016/j.jclepro.2020.125406.

[16]
Lv X J, Xiao W, Zhao Y L, et al. 2019. Drivers of spatio-temporal ecological vulnerability in an arid, coal mining region in Western China. Ecological Indicators, 106: 105475. DOI: 10.1016/j.ecolind.2019.105475.

[17]
Pandey R, Jha S K, Alatalo J M, et al. 2017. Sustainable livelihood framework-based indicators for assessing climate change vulnerability and adaptation for Himalayan communities. Ecological Indicators, 79: 338-346.

[18]
Phalkey N. 2020. Household level vulnerability in an Indian mangrove socio-ecological system. International Journal of Sustainable Development & World Ecology, 27(6): 534-547.

[19]
Prasetyo Y T, Senoro D B, German J D, et al. 2020. Confirmatory factor analysis of vulnerability to natural hazards: A household vulnerability assessment in Marinduque Island, Philippines. International Journal of Disaster Risk Reduction, 50: 101831. DOI: 10.1016/j.ijdrr.2020.101831.

[20]
Ren G P, Liu L M, Guan Q C, et al. 2019. Rurality evaluation and spatial autocorrelation type classification based on quality of life in metropolitan suburbs. Transactions of the Chinese Society of Agricultural Engineering, 35(7): 264-275. (in Chinese)

[21]
Rey S J. 2001. Spatial empirics for economic growth and convergence. Geographical Analysis, 33(3): 195-214.

[22]
Rorato A C, Escada M I S, Camara G, et al. 2022. Environmental vulnerability assessment of Brazilian Amazon Indigenous Lands. Environmental Science & Policy, 129: 19-36.

[23]
Sarkar U K, Karnatak G, Lianthuamluaia L, et al. 2022. Combining stakeholder perception and ecological approaches for assessing vulnerability of floodplain wetlands in changing climate: A regional study. International Journal of Biometeorology, 66(7): 1415-1427.

DOI PMID

[24]
Su J, Huang G Q. 2018. Simulation and analysis of ecosystem vulnerability with cascading spread caused by dust migration based on object function GeoPetri net. Ecological Modelling, 379: 54-72.

[25]
Wang J F, Xu C D. 2017. Geodetector: Principle and prospective. Acta Geographica Sinica, 72(1): 116-134. (in Chinese)

DOI

[26]
Wu J, Zhang Z J, He Q J, et al. 2021. Spatio-temporal analysis of ecological vulnerability and driving factor analysis in the Dongjiang River Basin, China, in the recent 20 years. Remote Sensing, 13(22): 4636. DOI: 10.3390/RS13224636.

[27]
Xie Z L, Li X Z, Chi Y, et al. 2021. Ecosystem service value decreases more rapidly under the dual pressures of land use change and ecological vulnerability: A case study in Zhujiajian Island. Ocean & Coastal Management, 201: 105493. DOI: 10.1016/J.OCECOAMAN.2020.105493.

[28]
Yang Z H, Li B, Nan B, et al. 2023. A methodological framework for assessing pastoral socio-ecological system vulnerability: A case study of Altay Prefecture in Central Asia. Science of the Total Environment, 862: 160828. DOI: 10.1016/J.SCITOTENV.2022.160828.

[29]
Yao Y, Liu Y X, Wang Y J, et al. 2021. Greater increases in China’s dryland ecosystem vulnerability in drier conditions than in wetter conditions. Journal of Environmental Management, 291: 112689. DOI: 10.1016/J.JENVMAN.2021.112689.

[30]
Ye X Y, Rey S. 2013. A framework for exploratory space-time analysis of economic data. The Annals of Regional Science, 50(1): 315-339.

[31]
Zhang J, Li J J, Yang X J, et al. 2022. Rural social-ecological systems vulnerability evolution and spatial-temporal heterogeneity in arid environmental change region: A case study of Minqin Oasis, northwestern China. Applied Geography, 145: 102747. DOI: 10.1016/J.APGEOG.2022.102747.

Outlines

/