Impact of Human Activities on Ecosystem

Drivers of Residents’ Livelihood Resilience in Sanjiangyuan National Park, China: From PLS-SEM and fs/QCA

  • BU Shijie , 1 ,
  • WANG Qun , 1, * ,
  • HU Changwei 2 ,
  • ZHUOMA Cuo 3
Expand
  • 1. School of Geography and Tourism, Anhui Normal University, Wuhu, Anhui 241002, China
  • 2. Faculty of International Tourism and Management, City University of Macao, Macao 999078, China
  • 3. School of Tourism, Qinghai Minzu University, Xining 810000, China
* WANG Qun, E-mail:

BU Shijie, E-mail:

Received date: 2023-11-21

  Accepted date: 2024-06-11

  Online published: 2024-10-09

Supported by

The National Natural Science Foundation of China(42171239)

Abstract

This study investigates the effects of tourism development perception, adaptive capacity, and transformation capacity on the residents’ livelihood resilience in a national park. Using the Yellow River Source Park in Sanjiangyuan National Park, China as a case study, this study simultaneously used the partial least squares structural equation model (PLS-SEM) and fuzzy-set qualitative comparative analysis (fs/QCA) to explore the linear and nonlinear dynamic impacts among the variables. PLS-SEM analysis revealed that adaptive capacity and transformation capacity positively affect livelihood resilience; tourism development perception negatively affects livelihood resilience but positively affects adaptive capacity and transformation capacity. Tourism development perception and adaptive capacity can positively influence livelihood resilience through transformation capacity. The fs/QCA revealed that simple antecedent variables do not constitute a necessary condition for promoting residents' high livelihood resilience, which depends on the conditions combined with another element. The analysis identified two combination paths of high livelihood resilience and three combination paths of low livelihood resilience, where adaptive and transformation capacity are essential for triggering high livelihood resilience, and tourism development perception is a significant driver of low livelihood resilience.

Cite this article

BU Shijie , WANG Qun , HU Changwei , ZHUOMA Cuo . Drivers of Residents’ Livelihood Resilience in Sanjiangyuan National Park, China: From PLS-SEM and fs/QCA[J]. Journal of Resources and Ecology, 2024 , 15(5) : 1274 -1285 . DOI: 10.5814/j.issn.1674-764x.2024.05.015

1 Introduction

Livelihood resilience represents people’s ability to maintain and enhance their income sources and well-being during periods of external interference and change (Tanner et al., 2015). Community residents are core stakeholders in national park system construction and tourism development, and their livelihood resilience influences national parks’ ecological conservation and development. Compared with other destinations, most Chinese national parks are located in areas with relatively backwards social and economic development and fragile ecological environments (Zhao and Su, 2023). Indigenous people live on traditional livelihoods, depend on natural resources and require means of survival and development (Lecegui et al., 2022; Li et al., 2022; Bu et al., 2023; Ghazali et al., 2023). Ecotourism is responsible tourism to natural areas that protects the environment, maintains the well-being of local people, and involves interpretation and education (TIES, 2015). It provides development opportunities for residents of national park communities, but it also brings challenges. To balance the relationship between conservation and development, the management and development mechanism of ecotourism in national parks has made it difficult for indigenous people to participate in tourism. To increase the residents' livelihood resilience of national parks, however, it is essential to improve inhabitants’ desire to engage in tourism and enhance people’s endogenous development motivation.
Several studies have examined the influences and potential pathways to improve livelihood resilience, focusing on internal and external factors. For instance, climate change, natural disasters, policy changes, and tourism development are crucial external factors that affect livelihood resilience (Tanner et al., 2015; Venugopal et al., 2018; Yang et al., 2018; Quandt, 2019; Wu et al., 2024). In contrast, residents’ self-organizing capacity, buffering capacity, and learning capacity are essential internal factors (Amadu et al., 2021). Although recent studies have investigated the livelihood influence of the national park tourism development (Yu et al., 2020; Bu et al., 2023), tourism development perceptions, adaptive and transformation capabilities have not yet been thoroughly assessed. Empirical evidence that residents’ perceptions affect adaptive capacity suggests that residents’ willingness to participate is more vital when it is based on their assessments of the perception of tourism effects (Zhang et al., 2021). They have more opportunities to diversify their livelihoods, increasing their adaptive and transformation capacity. However, these propositions have yet to be tested in the national park system, where tourism development can influence residents’ livelihood capital and is a source of developing different livelihoods (Gaspard et al., 2021). The tourism development perception of residents can have nonlinear effects on livelihood resilience, which has not been noted in previous studies.
This study develops and tests a model in which tourism development perception, adaptive capacity, and transformation capacity influence residents' livelihood resilience. We explore the impact of the perception of tourism development on livelihood resilience by adopting adaptive and transformative capacities as mediators. In addition, this study aims to contribute to livelihood resilience and national park development literature using the partial least squares structural equation model (PLS-SEM) and fuzzy set qualitative comparative analysis method (fs/QCA) to explore livelihood resilience and its influence paths. fs/QCA provides advantages for confirming other quantitative analysis results and exposing discrepancies in the relationship between variables by comprehending the fundamental mechanisms that connect antecedents and result variables (George et al., 2023). Few studies in the livelihood resilience literature have used these two methods concurrently to help understand the links between drivers and livelihood resilience.

2 Literature review and hypotheses

2.1 Livelihood resilience

A livelihood comprises living capacities, assets, and necessary production activities (Chambers and Conway, 1992). Resilience refers to the ability to absorb, deal with and adapt to environmental change, highlighting a system’s response to extreme interference and continual pressure (Engle et al., 2013; Folke, 2016). Speranza et al. (2014) defined livelihood resilience as the ability of one’s livelihood to maintain or improve essential attributes and functions while protecting against stress and disturbance. It comprises individual and household strategies under stress and shock (Quandt, 2018; Liu et al., 2020a). Tanner et al. (2015) highlighted the role of human agency and empowerment and found that people’s livelihood opportunities and well-being are crucial to developing livelihood resilience. Thus, we define livelihood resilience as subjects utilizing their livelihood capital, exerting their initiative, and adopting adaptive livelihood strategies to diversify livelihoods and well-being in the face of external changes and interference.
Most recent studies are primarily based on the “livelihood resilience framework” of Speranza et al. (2014), which is used to explore the influence of buffer capacity, self-organizational capacity, and learning capacity on livelihood resilience. Nyamwanza (2012) considered resilience and the adaptive capacity of livelihoods. Bu et al. (2023) developed a framework of livelihood resilience in the context of ecotourism development and change comprising the three dimensions of changes in the tourism development environment, adaptive capacity, and transformation capacity. However, these studies emphasized the impacts of multiple livelihood capacities, livelihood capital, and tourism development environments on livelihood resilience, yet did not focused on the relationships among these factors. Moreover, the literature ignores the transmission pathways between the antecedents and livelihood resilience. Therefore, it does not fully reflect the requirements of current livelihood research and must be further explored.

2.2 Research hypotheses

2.2.1 Tourism development perception and livelihood resilience

Tourism impact perception reflects and expresses the perception of tourism objects or existing phenomena (Zhang et al., 2021). It also evaluates residents’ multifaceted influence on destination tourism development. Regarding the dimension of tourism impact perception, the intervention and development of tourism have a complex and comprehensive impact on the community in the tourist destination, and residents’ understanding of this impact of tourism is multifaceted. Generally, tourism impact perception comprises economic, social and cultural, and environmental impact perceptions (Rasoolimanesh and Seyfi, 2021; Zhang et al., 2021). Shekari et al. (2022) noted that vigorous tourism development has substantially affected local community residents. Tourism has increased employment opportunities for residents and improved their living standards (Yu et al., 2020). This also directly impacts residents’ livelihoods (Shekari et al., 2022). A positive perception of tourism development can encourage residents to change their traditional ways of living and realize diverse livelihoods (Su et al., 2016), thus improving residents’ livelihood resilience. The research of Cottrell et al. (2013) and Gong and Yang (2017) on residents’ perceptions of sustainable tourism in national park communities provides inspiration for this paper. Accordingly, we propose the following hypothesis:
H1: Tourism development perception is positively associated with livelihood resilience.

2.2.2 Adaptive capacity, transformation capacity, and livelihood resilience

Adaptive capacity measures the capacity of a livelihood system to self-adjust, modify its characteristics to capitalize on opportunities, and address disruptions or obstacles (Thulstrup, 2015). It is mainly a function of resources or assets inherent in and accessible to the livelihood system (Nyamwanza, 2012). It comprises three main areas: livelihood capital, resource dependence, and young labourers. Livelihood capital is the basis of livelihood adaptability (Bu et al., 2023). Having specific livelihood capital, residents can effectively improve their adaptive capacity by reducing their dependence on resources and actively participating in tourism development.
Transformational capacity is the ability of residents to use existing resources to create new development paths (Zheng et al., 2020; Wu et al., 2024). It includes four aspects: educational input, traffic accessibility, social relations, government support, and transformation opportunities. According to Dobler-Morales et al. (2022), a significant portion of the variation in livelihood strategies results from the interactions arising from unequal distributions of resources, such as the interaction between education and economic inequality concerning road accessibility and overall poverty. A high level of education provides an increased ability to accept new things from the outside world. Therefore, education inputs are the foundation for improving residents’ livelihood transformation ability. With the influence of government policies and funds, residents will further explore different livelihood transformation paths to seek better living standards and realize diverse livelihoods (Wang et al., 2022). The enhanced ability of residents to transform their livelihoods enables them to adequately cope with external disturbances and changes from multiple sources, thereby helping them internalize conflicts and problems as a driving force for improving livelihood resilience (Zheng et al., 2020; Bu et al., 2023).
The enhancement of livelihood adaptability is based on improving livelihood capital, optimizing capital utilization, and realizing the effective transformation of livelihood capital. Livelihood capital is essential for residents seeking diversified livelihood strategies, coping with external changes and uncertainties, and promoting livelihood transformation. Under the existing livelihood capital, increasing the emphasis on education and government policy support is vital to broadening the path of livelihood transformation and diversifying livelihood strategies. Thus, we hypothesize the following:
H2: Adaptive capacity is positively associated with livelihood resilience.
H3: Transformation capacity is positively associated with livelihood resilience.
H4: Adaptive capacity is positively associated with transformation capacity.

2.2.3 Tourism development perception, adaptive capacity, and transformation capacity

Tourism development is essential for realizing the mutual conversion and structural optimization of residents’ livelihoods and local tourism capital. Yu et al. (2020) found that ecotourism development is an effective way to enhance livelihood capital. Residents’ perceptions of the value of tourism development in national parks directly enhance residents’ adaptive and transformative capacity. Residents realize the economic benefits of tourism development, thus increasing their willingness to participate in tourism projects (Nyaupane and Poudel, 2011). A high-value perception of tourism development will change people’s behavioural state. Residents themselves are the subjects of livelihood strategy selection and tourism participation. Therefore, it is necessary to strengthen individual perceptions of the value of tourism development. The transformation of residents' internal perceptions of tourism development can externalize their participation in constructing national parks and tourism development. In this way, they can enrich their livelihoods, improve their adaptive and transformation capacity, and enhance their risk-coping ability. Thus, we hypothesize the following:
H5: Tourism development perception is positively associated with adaptive capacity.
H6: Tourism development perception is positively associated with transformation capacity.
Based on the consideration of H1-H6, mediating hypotheses regarding capacity are proposed.
H7a: Adaptive capacity mediates between tourism development perception and livelihood resilience.
H7b: Adaptive capacity mediates between tourism development perception and transformation capacity.
H8a: Transformation capacity mediates between tourism development perception and livelihood resilience.
H8b: Transformation capacity mediates between adaptive capacity and livelihood resilience.
H9: Tourism development perception can influence livelihood resilience through adaptive capacity and transformation capacity.
In addition to the illustrated linear links, the concepts illustrated in Fig. 1 might encompass nonlinear connections. Thus, our study follows two general principles:
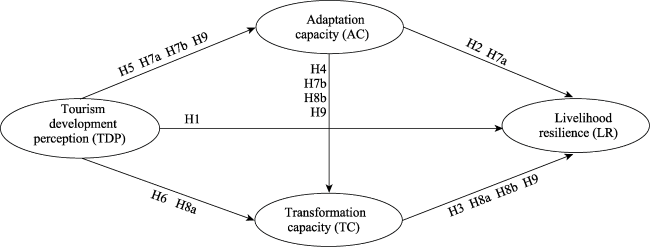
Fig. 1 Theoretical models for studying residents’ livelihood resilience drivers
P1: The level of livelihood resilience is influenced by various factors, not only a single factor.
P2: Thus, the driving forces of high livelihood resilience do not fully contradict those that drive low livelihood resilience.
In conclusion, tourism development perception, adaptive and transformation capacity are essential to livelihood resilience. Based on the above assumptions, we use the PLS-SEM and fs/QCA to explore the mechanism affecting the resilience of residents’ livelihoods and reveal the configuration path promoting residents’ livelihood resilience through the configuration effects of three antecedents: tourism development perception, adaptive capacity, and transformation capacity. The hypotheses of the model are illustrated in Fig. 1.

3 Materials and methods

3.1 Study area

The research was conducted in Yellow River Source Park in Sanjiangyuan National Park in Maduo County, Qinghai Province, China. The park covers 1.82×10⁴ km2 and was one of the first national parks established in China. The Yellow River Source Park community has a population of 9765, of whom Tibetans account for more than 90%. It is an area of traditional animal husbandry production and has a highly fragile ecological environment. The fragile ecological environment and the construction of the national park system have constrained the regional pastoral output and the development of herders’ livelihoods. In recent years, the national park has incorporated the ecotourism industry into the park’s concession project, seeking to coordinate the relationship between ecological protection and community development. Ecotourism development and changes in the Yellow River Source Park have affected the local population’s traditional livelihood strategy of grazing and increased the vulnerability of residents’ livelihoods. Therefore, studying the livelihood of residents in this area and exploring the factors influencing their livelihood resilience and the path of livelihood construction are important to develop livelihoods in the region.

3.2 Data sources

A bilingual Tibetan-Chinese survey questionnaire was used to collect the data. The respondents’ native tongue, Tibetan, was used in the questionnaire. To guarantee the equivalence of the items in Tibetan from Chinese, in producing the Tibetan-Chinese translation of the questionnaire, one Tibetan professor, five postgraduates, and six Tibetan undergraduates translated and proofread the scale items following the translation-back translation procedure. The research sample mainly comprised residents who participated in tourism development projects in the park or who engaged in tourism-related work. They also included government workers, education workers, and other workers in the research area. We selected residents of Zhalinghu township, Huanghe township, Machali town, and Huashixia town for the investigation. From May 6 to 10, 2021, 73 questionnaires were issued and recovered; 66 were valid, for an effective response rate of 90.4%.

3.3 Measures

A 5-point Likert-type scale was used to rate each item. The first section of the questionnaire collected basic information from respondents, including their place of residence, gender, age, ethnic group, education, income level, primary source of income, and means of livelihood. The second part is the measurement of variables related to livelihood resilience. All the measurement items adapted from previous studies, as shown in Table 1. Tourism development perception (TDP) was measured by three items related to living standards, economic benefits, and development chances (Gong and Yang, 2017). The items for measuring adaptive capacity (AC) dimensions (i.e., livelihood capital, dependence on natural resources, and young labour) were adapted from Thulstrup (2015) and Arhin et al. (2022). The items for measuring transformation capacity (TC) dimensions (i.e., education input, government support, social relations, transformation opportunities and traffic accessibility) were adapted from Zheng et al. (2020) and Wu et al. (2024). Five items measured the two dimensions of adaptive and transformation capacity. The items for measuring livelihood resilience (LR) dimensions (i.e., learning opportunity and capacity, self-organization capacity, and living environment) were adapted from Arhin et al. (2022) and Sina et al. (2019).
Table 1 Variables and measurement items related to livelihood resilience
Variable Item Factor loading
Tourism development perception TDP1 Tourism development can improve my living standard 0.880
TDP2 Tourism development can increase my daily income 0.897
TDP3 Tourism development can provide more job opportunities 0.922
Adaptive capacity AC1 The per capita income of my family has increased 0.671
AC2 My family has sufficient and high-quality pasture resources 0.712
AC3 My family has a comfortable housing environment 0.823
AC4 Young people are more willing to stay in the village and work after the development of ecotourism 0.652
AC5 My family depends significantly on the natural resources of the community 0.813
Transformation capacity TC1 My family’s investment in education has increased 0.719
TC2 My family has more opportunities for government funding and preferential policies 0.776
TC3 The residents in my community often help one another and get on well with each other 0.790
TC4 I often actively participate in community tourism services-related work 0.811
TC5 I think it is easier now to get to the state, the county, and the surrounding markets 0.650
Livelihood resilience LR1 How would you rate your living environment 0.723
LR2 How would you rate your ability to participate in social organization 0.904
LR3 How would you rate your ability to participate in education, training, and other learning activities organized 0.825

3.4 Data analysis

Two methods were employed to test our hypotheses: PLS-SEM using Smart PLS 4.0.8 and fs/QCA using fs/QCA v. 4.0. PLS-SEM is used to test the hypothetical relationship between causal structures and the net impact on one or more results. This method is suitable for forecasting applications and theory construction and increasingly become a popular technical tool in empirical research (Ali et al., 2018). However, it can only capture the linear relationship between structures, not unassumed reverse cases (Lee et al., 2022). According to Ragin et al. (2008a), the theoretical method of fs/QCA is used to examine the connections between antecedent conditional factors and outcome variables. This analytical approach, which has roots in set theory and Boolean logic, was created specifically to investigate social phenomena using small samples (Fainshmidt et al., 2020; Ruiz-Palomino et al., 2021). Its use may help with research issues regarding livelihoods. Therefore, to overcome the shortcomings of PLS-SEM and deepen the understanding of the complex causal situation of micro subjects’ livelihood resilience, this study uses asymmetric fs/QCA to supplement the research and combines several equivalent configuration schemes.
Fs/QCA consists of the following steps (Pappas and Woodside, 2021). 1) Calibration: This process involved calculating the average value of each scale item and converting the antecedents into fuzzy sets using fuzzy scores of 95%, 50%, and 5% (Ragin, 2008a; Fiss, 2011). 2) Necessary conditions analysis: This is used to check whether each antecedent condition is necessary to produce the result, which is a premise of fs/QCA. When analysing conditions, a condition is considered necessary if its consistency registers a significance above 0.9. A condition is close to being necessary if that value registers above 0.8 (Ragin, 2008b). 3) Truth table analysis: This involves the listing all conceivable combinations and ranking the cases using a minimum frequency of 1, a consistency threshold of 0.8, and a PRI consistency of 0.5 (Ragin, 2008b; Greckhamer et al., 2018).

4 Results and analysis

4.1 Sample profile

When conducting exploratory research, N=50 is the most reasonable minimum value (De Winter et al., 2009). The social traits of the samples are displayed in Table 2. The most considerable sample size for residences was 59.1% in Machali Town. A total of 33.3% of people were female, while 66.7% were male. The primarily were aged between 26 and 35 (42.4%). The majority of the respondents were Tibetans (69.7%). More than 37% (37.9%) had a bachelor's degree/college degree or above, and 6.10% had no education. 33.3% of the respondents had a monthly income between 2001 and 3500 yuan. Self-employment and industry are the primary sources of income for most residents, with 15.2% of the income coming from raising livestock and 6.1% being tourism related. Additionally, most residents (90.9%) had only one source of income, while a small minority (0.9%) had two or more sources.
Table 2 Descriptive statistics
Characteristics Description Frequency Percentage (%)
Residence Zhalinghu Township 10 15.2
Huanghe Township 7 10.6
Machali Town 39 59.1
Huashixia Town 10 15.2
Gender Male 44 66.7
Female 22 33.3
Age (yr) 18-25 22 33.3
26-35 28 42.4
36-45 8 12.1
46-55 6 9.1
56 and above 2 3
Ethnic groups Tibetan 46 69.7
Hui 1 1.5
Han 15 22.7
other 4 6.1
Education No formal education 4 6.1
Primary school 8 12.1
Secondary school 18 27.3
High school or technical school education 11 16.7
Bachelor’s degree/college degree or above 25 37.9
Monthly income (yuan) 2000 and below 14 21.2
2001-3500 22 33.3
3501-5000 9 13.6
Above 5000 21 31.8
Primary source of income Raise livestock 10 15.2
Plant crops 2 3
Engaged in pastoral or other tourism-related work 4 6.1
Go out to work 17 25.8
Self-employed industry and commerce 17 25.8
Public institution 13 19.7
Remittances from family members working outside 1 1.5
Rely on social security 3 4.5
Other 7 10.6
Means of livelihood 1 kind 60 90.9
2 kinds 4 6.1
3 kinds and above 2 3

4.2 Results of PLS-SEM

4.2.1 Measurement model results

The measurement model, which includes reliability and validity, and the structural model are evaluated using PLS-SEM (Kock, 2015; Hair et al., 2019). Table 3 shows that the Cronbach’s alpha and composite reliability (CR) for all the constructs exceeded the recommended value of 0.7, and the average variance extracted (AVE) for all the constructs surpassed the advised value of 0.5 (Ali et al. 2018; Hair et al., 2019; Seyfi et al., 2021). Therefore, all the measurement models are reliable and valid. Additionally, the heterotrait-monotrait ratio (HTMT) was assessed to ascertain discriminant validity (Seyfi et al., 2021). All the HTMT values were less than 0.9, thus validating the discriminant validity (Ali et al., 2018; Seyfi et al., 2021).
Table 3 Reliability estimates, and convergent and discriminant validity
Variables Dimension reliability and validity HTMT
Cronbach’s alpha CR AVE TDP AC TC LR
Tourism development perception (TDP) 0.883 0.927 0.810
Adaptive capacity (AC) 0.794 0.855 0.544 0.559
Transformation capacity (TC) 0.806 0.866 0.564 0.714 0.791
Livelihood resilience (LR) 0.752 0.860 0.673 0.320 0.788 0.834

4.2.2 Structural model and hypothesis testing

Before proceeding with the intervariable relationship analysis, several factors were examined. The random variable variance inflation factor (VIF) was less than 3.3 for all latent constructs (Kock and Lynn, 2012; Kock, 2015), indicating there were no multicollinearity issues. According to Hair et al. (2019), the coefficient of determination (R2), effect sizes (f 2), and predictive relevance (Q2) all play a role in structural model assessment. The R2 values for adaptive capacity, transformation capacity and livelihood resilience were 0.247, 0.553, and 0.551, respectively, indicating that the variables of all the items explained variance. The results for f 2 showed that adaptive capacity (f 2=0.200) and transformation capacity (f2=0.301) had a medium effect size, while tourism development perception (f2=0.109) had a small effect size on livelihood resilience. The model’s Q2 values of adaptive capacity (Q2=0.209), transformation capacity (Q2=0.353), and livelihood resilience (Q2=0.037) were all greater than zero, indicating they all had some predictive power.
As shown in Table 4, contrary to H1, tourism development perception was negatively related to livelihood resilience (β=‒0.281, P<0.05). However, tourism development perception was positively related to adaptive capacity (β= 0.497, P<0.001) and transformation capacity (β=0.361, P<0.01); thus, H5 and H6 are supported. The path coefficient from adaptive capacity to livelihood resilience was 0.410 (P<0.05), and that from adaptive capacity to transformation capacity was 0.496 (P<0.001). This means that adaptive capacity has a positive direct association with livelihood resilience and transformation capacity; thus, H2 and H4 are confirmed. H3 predicted a positive relationship between transformation capacity and livelihood resilience (β=0.549, P<0.05), which was also confirmed.
Table 4 Direct results of the structural model
Hypothesis f 2 β T value
H1. Tourism development perception→Livelihood resilience 0.109 ‒0.281* 2.287
H2. Adaptive capacity→Livelihood resilience 0.200 0.410* 2.099
H3. Transformation capacity→Livelihood resilience 0.301 0.549** 2.913
H4. Adaptive capacity→Transformation capacity 0.414 0.496*** 4.133
H5. Tourism development perception→Adaptive capacity 0.327 0.497*** 4.284
H6. Tourism development perception→Transformation capacity 0.219 0.361** 2.667

Note: Effect sizes (ƒ2): small=0.02, medium=0.15, and large=0.35; * means P<0.05, ** means P<0.01, *** means P<0.001.

Mediating effects were tested using a bootstrapping procedure with a resample of 10000 (Table 5). The results indicate that in the impact path of tourism development perception on livelihood resilience, transformation capacity indirect effect size of 0.198 with a confidence interval of [0.069,0.408] excluding 0, suggesting a significant indirect mediating effect; thus, H8a is supported. Similarly, the mediating role of transformation capacity between adaptive capacity and livelihood resilience was significant (β=0.272, T=1.981, P<0.05), with a confidence interval of [0.066,0.597] excluding 0, supporting for H8b. The mediating role of adaptive capacity between tourism development perception and transformation capacity is significant (β=0.246, T=2.738, P<0.01), supporting for H7b. However, the mediating role of adaptive capacity between tourism development perception and livelihood resilience was not significant (β=0.204, T=1.842, P=0.066); thus, H7a was not supported. Moreover, adaptive capacity and transformation capacity did not mediate the association between tourism development perception and livelihood resilience (β=0.135, T=1.569, P=0.117), thus H9 was not supported.
Table 5 Assessment of mediating effects
Hypothesis β T value Confidence
interval [25%, 97.5%]
H7a. Tourism development perception→Adaptive capacity→Livelihood resilience 0.204nc 1.842 [0.005,0.439]
H7b. Tourism development perception→Adaptive capacity→Transformation capacity 0.246** 2.738 [0.086,0.427]
H8a. Tourism development perception→Transformation capacity→Livelihood resilience 0.198* 2.376 [0.069,0.408]
H8b. Adaptive capacity→Transformation capacity→Livelihood resilience 0.272* 1.981 [0.066,0.597]
H9. Tourism development perception→Adaptive capacity→Transformation capacity→Livelihood resilience 0.135nc 1.569 [0.022,0.347]

Note: * means P<0.05, ** means P<0.01, *** means P<0.001; nc = not significant, 25%= lower limit; 97.5%= upper limit.

4.3 Results of fs/QCA

Table 6 presents the analytical findings from fs/QCA for the prerequisites for livelihood resilience. According to Ragin (2008a), a condition is necessary when its consistency score exceeds 0.9. The results indicate that tourism development perception, adaptive capacity, and transformation capacity do not constitute necessary conditions for livelihood resilience. After the necessity analysis, the fs/QCA results provided sufficient configurations that led to both high livelihood resilience (HLR) and low livelihood resilience (LLR). For HLR, two causal combinations (HLR1 and HLR2) emerged (consistency=0.866734, coverage=0.786602). HLR1 (Transformation capacity* ~Tourism development perception) indicates that under negative perceptions of tourism development, HLR can be promoted by residents with high transformation capacity, regardless of their level of livelihood adaptability. HLR2 (Adaptive capacity* Transformation capacity) indicates that, as long as residents have high adaptive capacity and transformation capacity, HLR can be formed under the combination of both, regardless of whether there is a positive impact of tourism development.
Table 6 Results of the necessity analysis of the antecedent conditions
Conditions tested High livelihood resilience Low livelihood resilience
Consistency Coverage Consistency Coverage
Adaptive capacity 0.815399 0.820873 0.528022 0.531889
~ Adaptive capacity 0.535010 0.531146 0.822175 0.816732
Transformation capacity 0.827220 0.810755 0.540745 0.530303
~ Transformation capacity 0.520764 0.531231 0.807028 0.823748
Tourism development perception 0.755380 0.676439 0.667373 0.597991
~ Tourism development perception 0.551076 0.623457 0.638897 0.723251

Notes: ~ means negated (lack of the causal condition). For example, “~Adaptive capacity” represents non-adaptability capacity; that is, residents’ livelihoods lack adaptability capacity.

Table 7 shows that three causal combinations (LLR1, LLR2 and LLR3), result in pathways leading to LLR (consistency=0.820926, coverage=0.848531). LLR1(~Adaptive capacity* ~Transformation capacity) shows that residents' livelihood adaptive capacity and transformation capacity are low. Even if the perception of tourism development is positive, the generation of HLR will be inhibited. LLR2 (~Transformation capacity* Tourism development perception) and LLR3(~Adaptive capacity* Tourism development perception) indicate that even if residents’ perception of tourism development is positive, as long as residents’ livelihood adaptive capacity and transformation capacity are poor, their livelihood elasticity will remain at a low level.
Table 7 Configuration analysis of high livelihood resilience (HLR) and low livelihood resilience (LLR)
Configuration High livelihood resilience Low livelihood resilience
HLR 1 HLR 2 LLR 1 LLR 2 LLR 3
Adaptive capacity
Transformation capacity
Tourism development perception
Consistency 0.902482 0.875267 0.878393 0.861194 0.870784
Raw coverage 0.462867 0.744468 0.735232 0.524387 0.555286
Unique coverage 0.042134 0.323735 0.252045 0.0411997 0.072099
Solution consistency 0.866734 0.820926
Solution coverage 0.786602 0.848531

Note: An antecedent condition that appears simultaneously in the two solutions is represented by “•” or “⊗”, “which means the core condition. A situation that only seems to be in the “intermediate solution” is defined by “•” or “⊗”, indicating an edge condition.

The results supported all earlier hypotheses. As shown for HLR1 and HLR2, multiple configurations resulted in HLR, confirming the study’s first tenet (P1). The second principle of causal asymmetry (LLR) was also supported (P2), as configurations of the same conditions led to distinct livelihood resilience outcomes (i.e., HLR2 and LLR1) depending on the presence or absence of adaptation and transformation capability (HLR2). Finally, transformation capability was a core condition (•) in HLR1 and HLR2, representing HLR. Tourism development perception was essential for LLR2 and LLR3, representing LLR.

5 Discussion

5.1 Theoretical contributions

This study makes three contributions to the research on the livelihoods of national park residents. First, we expanded the hypothetical analysis scenarios of the livelihood resilience of national park residents. Previous studies have focused on agriculture-based livelihoods (Quandt, 2018; Quandt et al., 2018; Liu et al., 2022). However, the unique livelihood context of herding in Sanjiangyuan National Park has not been sufficiently investigated (Li et al., 2022; Bu et al., 2023). National park ecology conservation, ecological tourism development (Shekari et al., 2022), and the maintenance of residents’ traditional livelihoods (such as grazing) provide unique contexts for understanding livelihood resilience that may differ from those in other types of regions. Under climate change, resettlement, and other conditions, the impacts of buffering, self-organization, learning capacity, adaptability, and transformation capability on livelihood resilience have been verified (Thulstrup, 2015; Liu et al., 2020b; Amadu et al., 2021; Fan et al., 2022; Wu et al., 2024). This study adds to the dimension of tourism perception in livelihood resilience studies. Using tourism development perception as a critical factor, we highlight the mediating role of adaptive and transformation capacity in influencing the residents’ livelihood resilience of national parks.
Second, this study focuses on the influence paths that lead to livelihood resilience and reveals the internal dynamics between the different elements of livelihood resilience. Specifically, we confirm the influence of tourism development perception on livelihood proposed by Zhang et al. (2021) and demonstrate the relationships among tourism perception, adaptive capacity, and transformation capacity, which thus far have not been evaluated. We found that adaptive capacity does not significantly influence livelihood elasticity under the influence of tourism development perception. Our understanding of the underlying assumptions of livelihood resilience is furthered by rejecting H7a and supporting H7b. The core element of adaptation ability is livelihood capital (Bu et al., 2023). When a livelihood subject’s available livelihood capital is insufficient, these internal factors will directly affect his or her choice of livelihood strategy regardless of whether the perception of tourism is negative or positive. Zheng et al. (2020) emphasized the impact of the combination of buffering, adaptation, and transformation capacity on farmers' livelihood resilience. However, our study revealed that adaptive capacity positively influences transformation capacity and livelihood resilience but does not positively affect livelihood resilience through transformation capacity under tourism development perception. As previously mentioned, consistent with our findings, Zheng et al. (2020) and Bu et al. (2023) indicated that combining adaptive and transformation capacity might enhance livelihood resilience. Moreover, adaptive capacity and positive tourism development perception strengthened the positive association with transformation capacity, the critical mediating variable of livelihood resilience evaluations in national parks.
Third, we combined PLS-SEM and fs/QCA for data analysis, consistent with the current suggestions to supplement quantitative approaches with qualitative analytical techniques for better comprehension of the issues under study (Ruiz-Palomino et al., 2021). Unlike recent studies, most articles use regression equation models to study livelihood resilience (Quandt et al., 2019; Liu et al., 2020b). These methods can be used to effectively analyse the linear effect of variables on outcomes. However, they do not explore the causal asymmetry of antecedent conditions or the nonlinear effects of variables on outcomes. Therefore, we apply PLS-SEM and fs/QCA simultaneously to comprehend the linear and nonlinear relationships among the dimensions, analyse the paths affecting livelihood resilience through the lens of causal asymmetry and effectively identify the distinctiveness of antecedent configurations that lead to high and low levels of livelihood resilience. To date, few studies have attempted to evaluate livelihood resilience. However, this study contributes to livelihood research by combining both methods to identify livelihood resilience.

5.2 Managerial implications

From the management viewpoint, the findings show that residents’ livelihood resilience in national parks must focus on how residents perceive its tourism development. Understanding each aspect of residents’ needs for tourism development enables national park to design tourism participation programs to enhance residents’ perceptions holistically by providing more job opportunities and increasing residents' income, reinforcing their willingness to participate. For the development of national parks, tourism development represents the essence of what distinguishes this kind of tourism development from others. This differentiation is essential for promoting the comprehension of residents’ perceptions of and affective connections with such a tourism development model. Suppose that residents’ perceptions of tourism development remain positive. In that case, residents will be willing to participate, which combines high adaptive and transformation capacities with their traditional livelihood strategies to promote livelihood resilience. From a sustainable livelihood perspective, people with a high level of participation in tourism use diverse livelihood strategies that are essential for resilience.
Livelihood resilience strategies should differentiate between residents who participate in tourism development and those who do not, given that these two types of residents evaluate tourism development, adaptive capacity, transformation capacity, and livelihood resilience differently. Increasing willingness to participate in tourism is an intelligent strategy for residents who do not participate by emphasizing tourism’ economic effects and learning opportunities and its positive influence on the living environment and living standards. For residents who participate in tourism development, it is equally crucial to reinforce tourism livelihoods to cope with disturbances, adapt to changes, and enhance diverse livelihood abilities.
Finally, residents’ livelihood strategy options are limited by their livelihood capital and ability. With respect to increasing perceptions of tourism development, we further suggest that governments should be based on cooperatives and focus on innovating community resource utilization and optimizing resource utilization to reduce residents’ high dependence on natural resources. A starting point to achieve this would be to improve the environmental management mechanism of national parks, the treatment and welfare of “ecological conservators” and the livelihood capital stock of local residents and their capacity to adapt to external disturbances. In addition, we should further improve the market competition mechanism of parks. Introducing multiple franchise enterprises could increase residents’ job chances and expand the channels for transforming their livelihoods. Realizing the competition mechanism of regional enterprise management helps improve operators’ awareness of the crisis.

5.3 Limitations and future research avenues

This research has several limitations. First, the sample size is mainly concentrated in Machali town. As the secondary distribution centre of tourism development in Maduo County, the residents of Machali town are less engaged in animal husbandry but more engaged in self-employment. The sample size significantly impacts the livelihood resilience of residents in a region. Moreover, residents engaged in animal husbandry accounted for 18.2% of the sample, which is a relatively high average score compared with residents engaged in other occupations. In contrast, the average scores for tourism development perception and transformation capacity are relatively low. The livelihood of residents engaged in animal husbandry was relatively stable in the early stage of the development of the national park, but had been affected by the time of the sample collection. The livelihood vulnerability of residents engaged in tourism and migrant work is relatively high. Therefore, future studies should increase the number of samples, select other regions to demonstrate the results, and compare the level and factors influencing the livelihood resilience of different practitioners (Wang et al., 2023).
Second, this study considers only the three aspects of livelihood resilience of tourism development perception, adaptive capacity, and transformation capacity. Future research might consider further aspects, including multisource disturbance, ecological effects, and policy change. In addition, the perception of tourism development is a highly subjective evaluation, and residents of different livelihood strategies and living stands may have different perceptions and behaviours when the same object is evaluated (Zhang et al., 2021). Therefore, the relationship between tourism development perception and livelihood resilience should be assessed and verified in different types of national parks, as well as in different stages of tourism development in Sanjiangyuan National Park.

6 Conclusions

This analysis led to two main conclusions: First, The PLS-SEM results show that adaptive and transformation capacity positively affect livelihood resilience. However, tourism development perception has a negative impact on livelihood resilience. As indicated in the mediating path analysis, transformation capacity full mediates the relationship between tourism development perception and livelihood resilience, as well as adaptive capacity and livelihood resilience, indicating that tourism development perception and adaptive capacity can positively influence livelihood resilience through transformation capacity. Adaptive capacity mediates the relationship between tourism development perception and transformation capacity. However, adaptive capacity has not been found to mediate tourism development perception and livelihood resilience. Additionally, tourism development perception does not influence livelihood resilience through adaptive capacity and transformation capacity.
Second, the fs/QCA results demonstrated that simple antecedent variables do not constitute a necessary condition for promoting residents’ high livelihood resilience, which depends on the conditions combined with another elements. There are two combination paths of high livelihood resilience and three combination paths of low livelihood resilience, in which adaptive and transformation capacities are essential for triggering high livelihood resilience. Similarly, the perception of tourism development was crucial for those configurations that led to low livelihood resilience. Therefore, based on the fs/QCA results, different combinations of factors in different scenarios have varying impacts on the livelihood resilience of national park residents. This explains the complexity and situational nature of residents’ livelihood development.
[1]
Ali F, Rasoolimanesh S M, Sarstedt M, et al. 2018. An assessment of the use of partial least squares structural equation modeling (PLS-SEM) in hospitality research. International Journal of Contemporary Hospitality Management, 30(1): 514-538.

[2]
Amadu I, Armah F A, Aheto D W, et al. 2021. A study on livelihood resilience in the small-scale fisheries of Ghana using a structural equation modelling approach. Ocean & Coastal Management, 215: 105952. DOI: 10.1016/j.ocecoaman.2021.105952.

[3]
Arhin P, Erdiaw-Kwasie M O, Abunyewah M. 2022. Displacements and livelihood resilience in Ghana’s mining sector: The moderating role of coping behaviour. Resources Policy, 78: 102820. DOI: 10.1016/j.res ourpol.2022.102820.

[4]
Bu S, Wang Q, Zhuoma C. 2023. Livelihood resilience analysis of residents in Sanjiangyuan National Park under the evolution of ecotourism development model. Areal Research and Development, 42(1): 132-136. (in Chinese)

[5]
Chambers R, Conway G. 1992. Sustainable rural livelihoods: Practical concepts for the 21st century. London, UK: Institute of Development Studies.

[6]
Cottrell S P, Vaske J J, Roemer J M. 2013. Resident satisfaction with sustainable tourism: The case of Frankenwald Nature Park, Germany. Tourism Management Perspectives, 8(1): 42-48.

[7]
De Winter J C, Dodou D, Wieringa P A. 2009. Exploratory factor analysis with small sample sizes. Multivariate Behavioral Research, 44(2): 147-181.

DOI PMID

[8]
Dobler-Morales C, Lorenzen M, Orozco-Ramírez Q, et al. 2022. Beyond a generalized deagrarianization: Livelihood heterogeneity and its determinants in the Mixteca Alta, Mexico. World Development, 160: 106074. DOI: 10.1016/j.worlddev.2022.106074.

[9]
Engle N L, Bermond A D, Malone E L, et al. 2013. Toward a resilience indicators framework for making climate-change adaptation decisions. Mitigation and Adaptation Strategies for Global Change, 19(8): 1295-1312.

[10]
Fainshmidt S, Witt M A, Aguilera R V, et al. 2020. The contributions of qualitative comparative analysis (QCA) to international business research. Journal of International Business Studies, 51(1): 455-466.

[11]
Fan Y, Shi X M, Li X P, et al. 2022. Livelihood resilience of vulnerable groups in the face of climate change: A systematic review and meta-analysis. Environmental Development, 44(22): 100777. DOI: 10.1016/j.envdev.2022.100777.

[12]
Fiss P C. 2011. Building better causal theories: A fuzzy set approach to typologies in organization research. The Academy of Management Journal, 54(2): 393-420.

[13]
Folke C. 2016. Resilience (Republished). Ecology and Society, 21(4): 44. DOI: 10.5751/ES-09088-210444.

[14]
Gaspard N, Ogwal H, Mburu D M, et al. 2021. An economic analysis of the effect of Volcano National Park tourism demand on human livelihood in Rwanda: A case study of Burera and Musanze districts. International Journal of Hospitality and Tourism Management, 5(2): 45-54.

[15]
George B D, Wissal B A, Victor T, et al. 2023. Gravitating exogenous shocks to the next normal through entrepreneurial coopetive interactions: A PLS-SEM and fsQCA approach. Journal of Business Research, 157: 113627. DOI: 10.1016/j.jbusres.2022.113627.

[16]
Ghazali S, Zibaei M, Azadi H. 2023. Impact of livelihood strategies and capitals on rangeland sustainability and nomads’ poverty: A counterfactual analysis in Southwest Iran. Ecological Economics, 206(22): 107738. DOI: 10.1016/j.ecolecon.2023.107738.

[17]
Gong J, Yang S. 2017. Residents’ perceptions on tourism impacts in natural heritage site from sustainable perspective: A case study of Shennongjia. Journal of Central South University of Forestry and Technology (Social Sciences), 11(6): 54-60. (in Chinese)

[18]
Greckhamer T, Furnari S, Fiss P C, et al. 2018. Studying configurations with qualitative comparative analysis: Best practices in strategy and organization research. Strategic Organization, 16(4): 482-495.

[19]
Hair J F, Risher J J, Sarstedt M, et al. 2019. When to use and how to report the results of PLS-SEM. European Business Review, 31(1): 2-24.

[20]
Kock N. 2015. Common method bias in PLS-SEM: A full collinearity assessment approach. International Journal of e-Collaboration, 11(4): 1-10.

[21]
Kock N, Lynn G. 2012. Lateral collinearity and misleading results in variance-based SEM: An illustration and recommendations. Journal of the Association for Information Systems, 13(7): 546-580.

[22]
Lee J H, Joo D, Lee C, et al. 2022. The role of residents’ sustainable in agricultural heritage site management: Insights from PLS-SEM and Fs/QCA. Journal of Hospitality and Tourism Management, 52(7): 65-74.

[23]
Lecegui A, Olaizola A M, López-I-Gelats V E. 2022. Implementing the livelihood resilience framework: An indicator-based model for assessing mountain pastoral farming systems. Agricultural Systems, 199: 103405. DOI: 10.1016/j.agsy.2022.103405.

[24]
Li T, Cai S, Singh R K, et al. 2022. Livelihood resilience in pastoral communities: Methodological and field insights from Qinghai-Tibetan Plateau. Science of the Total Environment, 838(2): 155960. DOI: 10.1016/j.scitotenv.2022.155960.

[25]
Liu W, Li J, Ren L, et al. 2020a. Exploring livelihood resilience and its impact on livelihood strategy in rural China. Social Indicators Research, 150(2): 977-998.

[26]
Liu W, Li J, Xu J. 2020b. Effects of disaster-related resettlement on the livelihood resilience of rural households in China. International Journal of Disaster Risk Reduction, 49(1): 101649. DOI: 10.1016/j.ijdrr.2020.101649.

[27]
Liu Y, Zou X, Chen J, et al. 2022. Impacts of protected areas establishment on pastoralists’ livelihoods in the Three-River-Source Region on the Qinghai-Tibetan Plateau. Land Use Policy, 115(3): 106018. DOI: 10.1016/j.landusepol.2022.106018.

[28]
Nyamwanza A M. 2012. Livelihood resilience and adaptive capacity: A critical conceptual review: Original research. Jamba: Journal of Disaster Risk Studies, 4 (1): 1-6.

[29]
Nyaupane G P, Poudel S. 2011. Linkages among biodiversity, livelihood, and tourism. Annals of Tourism Research, 38(4): 1344-1366.

[30]
Pappas I O, Woodside A G. 2021. Fuzzy-set Qualitative Comparative Analysis (fsQCA): Guidelines for research practice in information systems and marketing. International Journal of Information Management, 58(3): 102310. DOI: 10.1016/j.ijinfomgt.2021.102310.

[31]
Quandt A. 2018. Measuring livelihood resilience: The Household Livelihood Resilience Approach (HLRA). World Development, 107: 253-263.

[32]
Quandt A. 2019. Variability in perceptions of household livelihood resilience and drought at the intersection of gender and ethnicity. Climatic Change, 152(2): 1-15.

[33]
Quandt A, Neufeldt H, McCabe J T. 2018. Building livelihood resilience: What role does agroforestry play? Climate and Development, 11(6): 485-500.

[34]
Ragin C C. 2008a. Measurement versus calibration:A set-theoretic approach. In: The Oxford handbook of political methodology. New York, USA: Oxford University Press.

[35]
Ragin C C. 2008b. Redesigning social inquiry:Fuzzy sets and beyond. Chicago, USA: University of Chicago Press.

[36]
Rasoolimanesh S M, Seyfi S. 2021. Residents’ perceptions and attitudes towards tourism development: A perspective article. Tourism Review, 76(1): 51-57.

[37]
Ruiz-Palomino P, Gutiérrez-Broncano S, Jiménez-Estévez P, et al. 2021. CEO servant leadership and strategic service differentiation: The role of high-performance work systems and innovativeness. Tourism Management Perspectives, 40: 100891. DOI: 10.1016/j.tmp.2021.100891.

[38]
Seyfi S, Rasoolimanesh S M, Vafaei-Zadeh A, et al. 2021. Can tourist engagement enhance tourist behavioural intentions? A combination of PLS-SEM and fsQCA approaches. Tourism Recreation Research, 49(1): 63-74.

[39]
Shekari F, Ziaee M, Faghihi A, et al. 2022. Nomadic livelihood resilience through tourism. Annals of Tourism Research Empirical Insights, 3(1): 100034. DOI: 10.1016/j.annale.2022.100034.

[40]
Sina D, Chang-Richards A Y, Wilkinson S, et al. 2019. A conceptual framework for measuring livelihood resilience: Relocation experience from Aceh, Indonesia. World Development, 117(2): 253-265.

[41]
Speranza C I, Wiesmann U, Rist S. 2014. An indicator framework for assessing livelihood resilience in the context of social-ecological dynamics. Global Environmental Change, 28: 109-119.

[42]
Su M M, Wall G, Jin M. 2016. Island livelihoods: Tourism and fishing at Long Islands, Shandong Province, China. Ocean and Coastal Management, 122: 20-29.

[43]
Tanner T, Lewis D, Wrathall D, et al. 2015. Livelihood resilience in the face of climate change. Nature Climate Change, 5: 23-26.

[44]
TIES (The International Ecotourism Society). 2015. TIES Announces Ecotourism Principles Revision. https://ecotourism.org/news/ties-announces-ecotourism-principles-revision/. Viewed on 2023-04-19.

[45]
Thulstrup A W. 2015. Livelihood resilience and adaptive capacity: Tracing changes in household access to capital in central Vietnam. World Development, 74: 352-362.

[46]
Venugopal S, Gau R, Appau S, et al. 2018. Adapting traditional livelihood practices in the face of environmental disruptions in subsistence communities. Journal of Business Research, 100: 400-409.

[47]
Wang X, Lin D Y, Hao H G. 2023. The dominant livelihood types of farm households and their determinants in Key Ecological Function Areas. Journal of Resources and Ecology, 14(1): 114-123.

DOI

[48]
Wang D, Wang X, Hao H G, et al. 2022. Research progress on farmers’ livelihood transformation and its ecological effects: A review. Journal of Resources and Ecology, 13(5): 912-924.

[49]
Wu J L, Xiao Y C, Liu S L, et al. 2024. Evaluation and obstacle factors of farmer households’ livelihood resilience in ethnic tourism villages: A case study of 10 villages in Wuling Mountain area of Hunan and Hubei. Economic Geography, 44(1): 174-184. (in Chinese)

[50]
Yang H, Dietz T, Yang W, et al. 2018. Changes in human well-being and rural livelihoods under natural disasters. Ecological Economics, 151: 184-194.

[51]
Yu P, Zhang J, Wang Y, et al. 2020. Can tourism development enhance livelihood capitals of rural households? Evidence from Huangshan National Park adjacent communities, China. Science of the Total Environment, 748: 141099. DOI: 10.1016/j.scitotenv.2020.141099.

[52]
Zhang S, Luo X, Gong J. 2021. A comparative study on the perception and attitude towards sustainable tourism based on different livelihood: Taking Shennongjia National Park system pilot area as an example. Ecological Economy, 37(8): 132-140. (in Chinese)

[53]
Zhao X Y, Su H Z. 2023. The research framework and key issues of sustainable livelihoods in the national park. Journal of Natural Resources, 38(9): 2217-2236. (in Chinese)

[54]
Zheng D Y, Huang X J, Wang C. 2020. Farmers’ livelihood resilience and its optimization strategy in Loess Plateau of north Shaanxi Province. Journal of Arid Land Resources and Environment, 34(9): 9-16. (in Chinese)

Outlines

/