
Journal of Resources and Ecology >
Coupling Coordination Relationship between Ecological Human Settlements and the Happiness Levels of Residents in the Yangtze River Delta Urban Agglomeration
|
FAN Hua, E-mail: 1185218914@qq.com |
Received date: 2023-10-16
Accepted date: 2024-03-10
Online published: 2024-10-09
Supported by
The Major Research Plan of the National Natural Science Foundation of China(41471032)
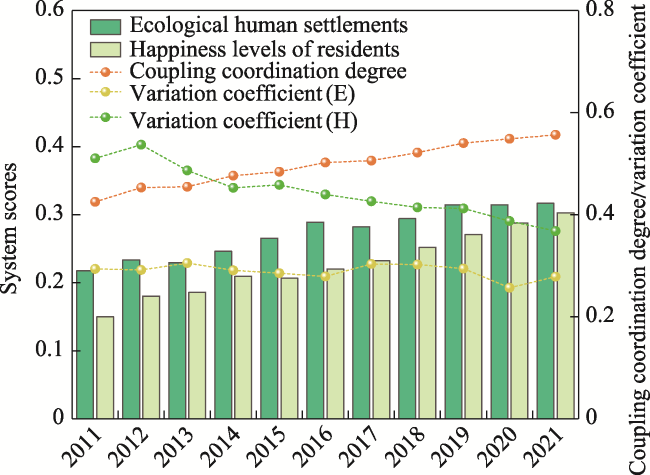
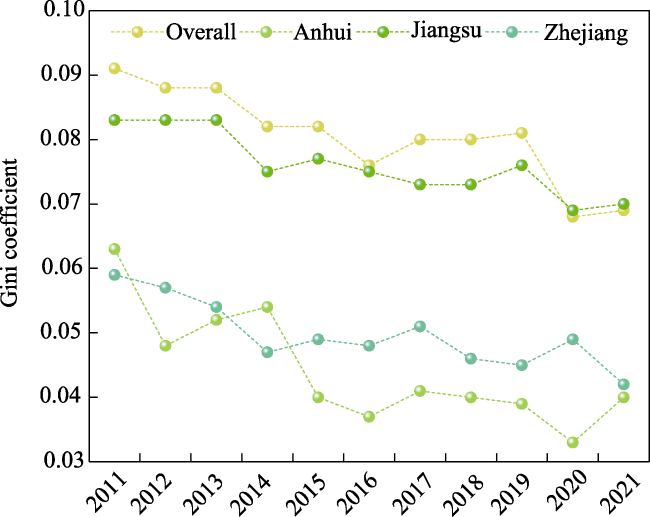
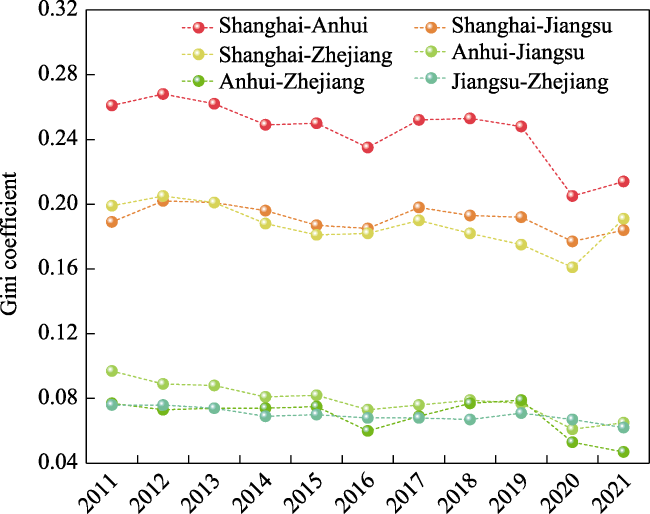
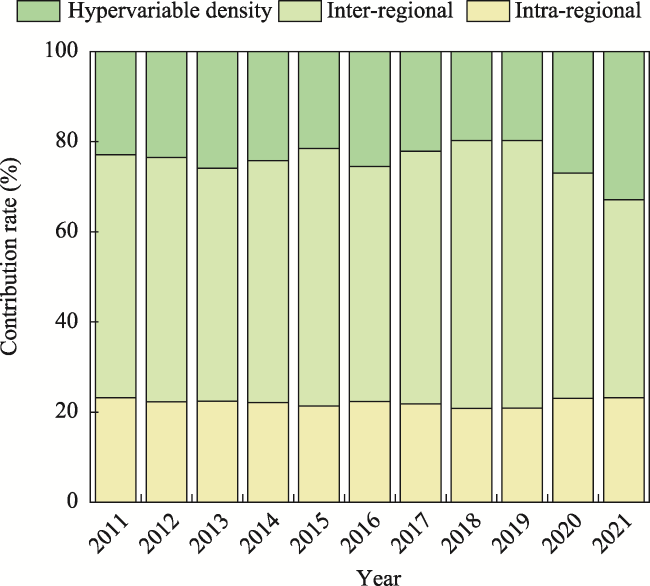
Promoting the coordinated development of ecological human settlements and the happiness levels of residents will help to promote people-centered high-quality development. This study was based on the 2011-2021 data of the Yangtze River Delta urban agglomeration, and constructed an evaluation index system of ecological human settlements and the happiness levels of residents. The entropy value method, coupling coordination degree model, Dagum Gini coefficient and Geodetector model were used to explore the coupling coordination relationship and influencing factors of these two systems. The findings indicate that ecological human settlements and the happiness levels of residents in the Yangtze River Delta urban agglomeration have shown an upward trend over time. By 2021, the overall level of the region had significantly improved. The coupling coordination level between these two systems has gradually increased, showing a spatial distribution pattern of high in the east and low in the west. The Dagum Gini coefficient shows a fluctuating downward trend in the overall and intra-regional differences, with the largest inter-regional difference between Shanghai and Anhui, and the inter-regional difference is the main source of the spatial differences. Economic development level (Eco) was the main factor influencing the coupling coordination of the two systems from 2011 to 2021. The results of this study provide references for constructing ecological human settlements and enhancing the happiness levels of residents.
FAN Hua , ZHAO Cuiwei . Coupling Coordination Relationship between Ecological Human Settlements and the Happiness Levels of Residents in the Yangtze River Delta Urban Agglomeration[J]. Journal of Resources and Ecology, 2024 , 15(5) : 1251 -1262 . DOI: 10.5814/j.issn.1674-764x.2024.05.013
Table 1 Indicator system of ecological human settlements and the happiness levels of residents |
| System | Primary indicators | Secondary indicators | Attribute |
|---|---|---|---|
| Ecological human settlements | Ecological background | Green space per capita in parks (m² person‒1) | + |
| Industrial fume (dust) emissions per capita (t person‒1) | ‒ | ||
| Industrial SO2 emissions per capita (t person‒1) | ‒ | ||
| Greening coverage in built-up areas (%) | + | ||
| Water resources per capita (m3 person‒1) | + | ||
| Social foundation | Non-hazardous treatment rate of domestic waste (%) | + | |
| Public toilets per 10000 population (seats) | + | ||
| Sewage treatment rate (%) | + | ||
| Density of drainage pipes in built-up areas (km km-2) | + | ||
| Population density (persons km-2) | ‒ | ||
| Economic support | Average GDP of land (10000 yuan km-2) | + | |
| Domestic tourism revenue (10000 yuan) | + | ||
| Percentage of tertiary sector value added (%) | + | ||
| Percentage of employees in the tertiary sector (%) | + | ||
| Happiness levels of residents | Materialistic life | Water supply coverage rate (%) | + |
| Gas supply coverage rate (%) | + | ||
| Retail sales of social consumer goods per capita (yuan person‒1) | + | ||
| Urban per capita disposable income (yuan) | + | ||
| Safety | Number of hospitals per 10000 population (number) | + | |
| Number of hospital beds per 10000 population (beds) | + | ||
| Number of urban workers enrolled in basic pension insurance (persons) | + | ||
| Number of urban basic medical insurance participants (persons) | + | ||
| Interrelationship needs | Library holdings per 10000 population (items) | + | |
| Number of domestic tourists (10000 person-times) | + | ||
| Number of libraries per 10000 population (units) | + | ||
| Ratio of disposable income between urban and rural areas | ‒ | ||
| Number of cell phone subscribers at the end of the year (10000 households) | + | ||
| Respect for needs | Percentage of students enrolled in general higher education (%) | + | |
| Number of divorces (10000 pairs) | ‒ | ||
| Development needs | Number of patents granted per 10000 persons (number) | + | |
| Science and technology expenditures as a percentage (%) | + | ||
| Urban registered unemployment rate (%) | ‒ | ||
| Average wage of employees (yuan) | + |
Table 2 Types of coupling coordination |
| D | (0, 0.1] | (0.1, 0.2] | (0.2, 0.3] | (0.3, 0.4] | (0.4, 0.5] | (0.5, 0.6] | (0.6, 0.7] | (0.7, 0.8] | (0.8, 0.9] | (0.9, 1.0] |
|---|---|---|---|---|---|---|---|---|---|---|
| Stage | Extreme dissonance | Severe dissonance | Moderate dissonance | Mild dissonance | Near dissonance | Minimal coordination | Primary coordination | Intermediate coordination | Good coordination | Excellent coordination |
Fig. 1 Overall score and coupling coordination degree |
Fig. 2 Spatial and temporal patterns of ecological human settlements |
Fig. 3 Spatial and temporal patterns of the happiness levels of residents |
Fig. 4 Spatial and temporal patterns of the degrees of coupling coordination |
Fig. 5 Overall and intra-regional Gini coefficients |
Fig. 6 Inter-regional Gini coefficients |
Fig. 7 Sources of regional differences and their contribution |
Table 3 Indicator system for factors influencing the coupling coordination |
| Variable type | Variable name | Variable meaning | Acronym |
|---|---|---|---|
| Dependent variable | Degree of coupling coordination | Coupling coordination degree calculated by the model | D |
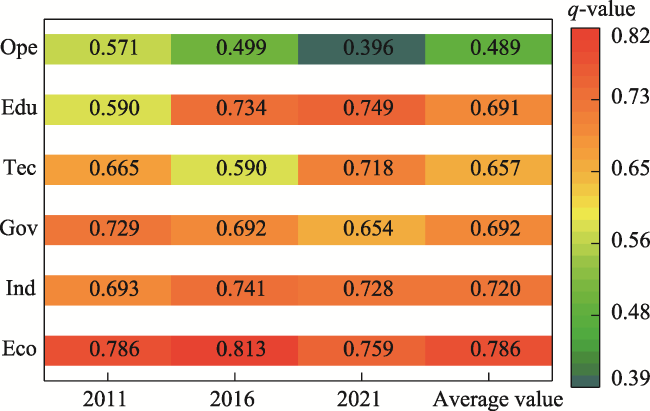
| Independent variable | GDP per capita | Economic development level | Eco |
| Value added of secondary and tertiary industries as a share of GDP | Industrial structure | Ind | |
| Per capita financial expenditure | Governmental regulation ability | Gov | |
| Scientific expenditure | Scientific and technological innovation investment | Tec | |
| Education expenditure | Cultural and educational investment | Edu | |
| Per capita real foreign capital utilization | Level of opening up to the outside world | Ope |
Fig. 8 Factor detection |
| [1] |
|
| [2] |
|
| [3] |
|
| [4] |
|
| [5] |
|
| [6] |
|
| [7] |
|
| [8] |
|
| [9] |
|
| [10] |
|
| [11] |
|
| [12] |
|
| [13] |
|
| [14] |
|
| [15] |
|
| [16] |
|
| [17] |
|
| [18] |
|
| [19] |
|
| [20] |
|
| [21] |
|
| [22] |
|
| [23] |
|
| [24] |
|
| [25] |
|
/
| 〈 |
|
〉 |


