
Journal of Resources and Ecology >
Spatial Differentiation, Typological Structure, and Influencing Factors of A-grade Scenic Spots in China
|
YANG Yuanyuan, E-mail: 739271126@qq.com |
Received date: 2024-01-27
Accepted date: 2024-04-25
Online published: 2024-10-09
Supported by
The Guizhou Province 2021 Philosophy and Social Science Planning Project(21GZQN14)
Tourism scenic spots serve as direct attractions for tourists and crucial drivers for the transformation and upgrading of the tourism industry, so they play an irreplaceable role in the development of the tourism sector. The quantity and grades of A-grade scenic spots are the mainstay of competition in various tourism markets, and their spatial layout is very important for the development of regional tourism. Using 11970 A-grade scenic spots in China as the research sample, and methods such as the Nearest Neighbor Index Method, Kernel Density Estimation Method, and Grid Dimension Method, the spatial distribution, typological structure, and influencing factors of A-grade tourist attractions were analyzed to identify the main natural, economic, and social factors influencing the spatiotemporal pattern of A-grade scenic spots. The results indicated that China’s A-grade scenic spots exhibit clustering characteristics in their spatial distribution. The kernel density center shows a spatial pattern of “multiple cores, with secondary cores surrounding, and a gradual decrease”. The spatial structure is fractal and complex, with significant regional differences and a notable scale-free range. The types of tourist destinations and products exhibit distinct regional features, with a higher concentration of scenic spots in the regions in South China and East China, which are characterized by favorable natural and economic conditions and convenient transportation. A-grade scenic spots are densely distributed around the Beijing-Tianjin-Hebei region and the eastern regions such as Shanghai, Zhejiang, and Jiangsu provinces. Analyzing the spatial distribution characteristics of A-grade scenic spots in China contributes to our understanding of the complexity of scenic spot layout and spatial connections, which provides a basis for optimizing the layout of tourism development within regions, the rational allocation of resources, enhancing the quality and efficiency of the tourism industry, and promoting sustained and healthy regional economic development. It is conducive to the strategic work of tourism development and rural revitalization in China, and serves as a reference for decision-making.
YANG Yuanyuan , YAO Yao . Spatial Differentiation, Typological Structure, and Influencing Factors of A-grade Scenic Spots in China[J]. Journal of Resources and Ecology, 2024 , 15(5) : 1209 -1218 . DOI: 10.5814/j.issn.1674-764x.2024.05.009
Fig. 1 Spatial distribution map of A-grade scenic spots |
Table 1 Spatial nearest neighbor index of the A-grade scenic spots in China |
| Total number | (km) | (km) | R | Z | P |
|---|---|---|---|---|---|
| 11970 | 7.96 | 19.70 | 0.40 | -124.65 | <0.001 |
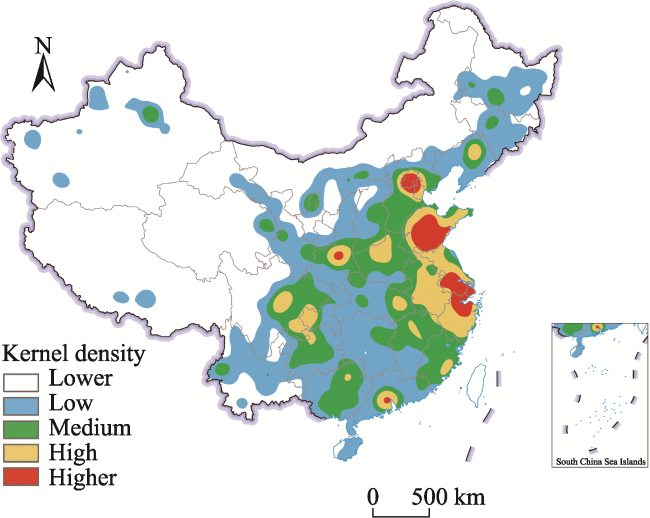
Fig. 2 Kernel density map of A-grade scenic spots |
Table 2 Distribution of partial values of kernel density in the A-level scenic spots in China |
| Region | City | Kernel density (Number per 10000 km2) |
|---|---|---|
| The top five | Shanghai | 171.22 |
| Beijing | 146.83 | |
| Tianjin | 81.12 | |
| Shandong | 77.04 | |
| Zhejiang | 75.16 | |
| The bottom five | Gansu | 7.96 |
| Inner Mongolia | 3.26 | |
| Xinjiang | 2.50 | |
| Qinghai | 1.58 | |
| Tibet | 0.90 | |
| Countrywide | 12.47 | |
Table 3 Calculation of grid dimensions of the A-grade scenic spots |
| K | 2 | 3 | 4 | 5 | 6 | 7 | 8 | 9 | 10 |
|---|---|---|---|---|---|---|---|---|---|
| N(r) | 4 | 9 | 15 | 21 | 28 | 34 | 41 | 52 | 58 |
| I(r) | 0.9138 | 1.6081 | 2.0477 | 2.3959 | 2.6329 | 2.8036 | 2.9949 | 3.2355 | 3.4215 |
Fig. 3 Double logarithm scatter plots for the grid dimensions of A-grade scenic spots |
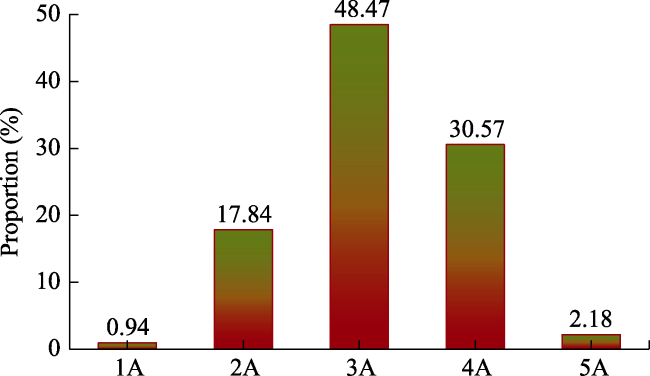
Fig. 4 Distribution of destination types of A-grade scenic spots |
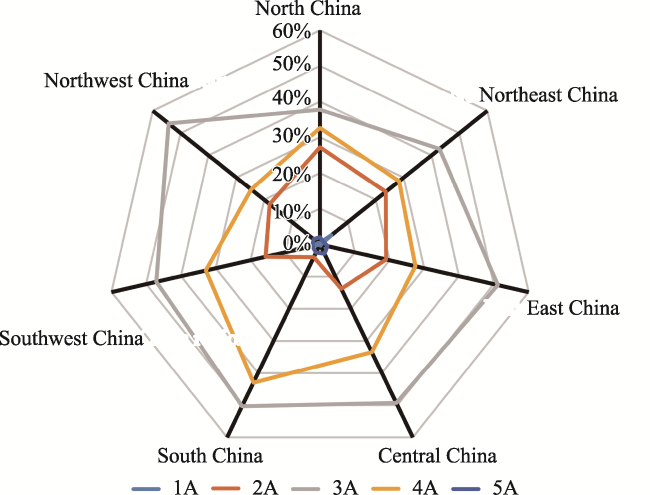
Fig. 5 Spatial distributions of the destination types |
Fig. 6 Spatial distributions based on product structure |
Fig. 7 Distribution of A-grade scenic products |
Fig. 8 Distribution of A-grade scenic spots relative to the main highways and railways, showing their spatial relationships |
| [1] |
|
| [2] |
|
| [3] |
|
| [4] |
|
| [5] |
|
| [6] |
|
| [7] |
|
| [8] |
|
| [9] |
|
| [10] |
|
| [11] |
|
| [12] |
|
| [13] |
|
| [14] |
|
| [15] |
|
| [16] |
|
| [17] |
|
| [18] |
|
| [19] |
|
| [20] |
|
| [21] |
|
| [22] |
|
| [23] |
|
/
| 〈 |
|
〉 |


