Special Column: Resources and Ecology of the Mongolian Plateau

Impact of Human Activities and Climate Change on Grassland Productivity in Xilingol League

  • YAN Huimin , 1, 2 ,
  • XIE Gege 1, 2 ,
  • NIU Zhongen , 1, 3, * ,
  • LIU Guihuan 4 ,
  • YANG Yanzhao 1, 2 ,
  • XUE Zhichao 5 ,
  • WANG Boyu 1, 2
Expand
  • 1. Institute of Geographic Sciences and Natural Resources Research, Chinese Academy of Sciences, Beijing 100101, China
  • 2. University of Chinese Academy of Sciences, Beijing 100049, China
  • 3. School of Resources and Environmental Engineering, Ludong University, Yantai, Shandong 264025, China
  • 4. Chinese Academy of Environmental Planning, Ministry of Ecology and Environment of China, Beijing 100012, China
  • 5. Business School, Beijing Technology and Business University, Beijing 100048, China
* NIU Zhongen, E-mail:

YAN Huimin, E-mail:

Received date: 2024-03-18

  Accepted date: 2024-05-20

  Online published: 2024-10-09

Supported by

The National Key Research and Development Program of China(2022YFF1301802)

Abstract

Natural grasslands are increasingly subjected to the dual stresses of grazing pressures and climate change. However, the contribution of human activities, especially grassland ecology conservation projects, to grassland improvement remains ambiguous. Utilizing MODIS satellite data in conjunction with the VPM model, the gross primary productivity (GPP) changes in the Xilingol grassland from 2000 to 2020 were assessed. Based on GPP data derived from remote sensing, this study quantitatively assessed the spatiotemporal dynamics of the impacts of climate change and human activities on the productivity of grassland in the Xilingol League. From 2000 to 2020, the grasslands exhibited a greening trend characterized by a significant annual GPP increment of 2.66 gC m-2 yr-1 (P<0.05). Climate change and human activities jointly contributed to this greening trend, with relative contribution rates of 55% and 45%, respectively. However, the relative contributions of climate change and human activities to the trend of GPP varied greatly in different regions. Climate change emerged as the principal driver in the central and eastern regions of Xilingol League with robust grass growth, accounting for more than 65% of the GPP enhancement. Conversely, human activities were the dominant factors in less verdant western regions and the agro-pastoral ecotone, representing more than 60% of the GPP change. Grassland productivity was sensitive to grassland ecological restoration measures, with significant changes in the trends of grassland productivity attributed to human activities in pivotal policy implementation years such as 2005 and 2011. Specifically, measures such as the control of wind/sand sources and returning grazing land to grassland from 2000 to 2005 gradually alleviated the pressure of human activities on grassland productivity, as they significantly improved vegetation growth in high-quality grasslands. Under the forage-livestock balance policy from 2005 to 2011, inadequate compensation for grassland ecological protection led to a significant reduction in GPP, as some herders increased their livestock holdings despite grazing restrictions, and this particularly affected the high-quality grasslands. The implementation of the Grassland Ecological Protection Subsidy and Reward Program from 2011 to 2020 generally promoted the recovery of productivity in eastern and western Xilingol League grasslands, but significant ecological pressure persisted. This study provides theoretical support for optimizing grassland ecosystem management and forming a virtuous cycle of grassland conservation in pastoral areas.

Cite this article

YAN Huimin , XIE Gege , NIU Zhongen , LIU Guihuan , YANG Yanzhao , XUE Zhichao , WANG Boyu . Impact of Human Activities and Climate Change on Grassland Productivity in Xilingol League[J]. Journal of Resources and Ecology, 2024 , 15(5) : 1134 -1146 . DOI: 10.5814/j.issn.1674-764x.2024.05.003

1 Introduction

Grasslands represent the largest managed ecosystem on Earth and serve as the foundation for the global meat and dairy industries, so they sustain the livelihoods of over a billion people worldwide. In addition, grasslands provide essential ecological services such as water conservation, windbreak, sand fixation, and biodiversity conservation. However, grasslands are highly vulnerable to the impacts of human activities and climate change. Reasonable grazing management contributes to maintaining the productivity and biodiversity of grassland ecosystems (Evans et al., 2015; Tälle et al., 2016). Nevertheless, approximately 20% of rangelands worldwide have degraded due to overgrazing, which has been widespread in regions such as Asia, South America, Australia, Africa and the Mediterranean over the past century (Rowntree et al., 2004; Abu Hammad and Tumeizi, 2012; Lu et al., 2017). Overgrazing has become a main driver of grassland degradation, especially in the Eurasian steppe (De Haan, 2006; Wesche et al., 2016). Grassland degradation not only leads to environmental problems, such as desertification, reduced grassland productivity, and soil organic carbon loss (Chen et al., 2017; Liu et al., 2018), but it also affects the provision of grassland ecosystem services and human livelihoods (Waldron et al., 2010; Huang et al., 2013;). Ecological restoration after degradation often requires significant investment and lengthy processes. A series of natural disasters, including droughts in 1997 and dust storms in 2000, prompted the government to focus on ecological management in China (Delang and Yuan, 2015), leading to the implementation of various ecological protection programs (Chen et al., 2017; Liu et al., 2018). From 1998 to 2015, the government invested US$378.5 billion in 16 major ecological protection and restoration projects, with funding increasing each year (Bryan et al., 2018). Because of the significant ecological and economic costs of ecological conservation and management, timely and accurate monitoring of ecological degradation is crucial to proactively avoid the ‘degradation before management’ scenario and achieve sustainable development goals.
Overgrazing has exacerbated the degradation and desertification of grasslands in semi-arid regions due to the continuous expansion of livestock production since the 1980s (Chen et al., 2015; Wu et al., 2015). Since 2000, the degradation of desertified areas has been mitigated through the implementation of a series of grassland restoration and conservation projects (Yang et al., 2016; Zhou et al., 2017; Hu et al., 2019). However, the effects of natural factors and human activities on grassland degradation have been controversial. On the one hand, identifying the effects of human activities on ecosystems is usually difficult before the threshold of ecological resilience is reached, and the effectiveness of grazing control policies since 2000 in mitigating grassland degradation remains controversial (Huang et al., 2023; Shao et al., 2023). On the other hand, global warming and increasing extreme weather events are altering the original ecological environment, which brings new challenges to the livelihoods of grassland herders. Some scholars argue that the main cause of grassland degradation is overgrazing (Teague and Dowhower, 2003), suggesting that successful ecological restoration programs have effectively curbed desertification. However, other researchers believe that climate change is the major driver of extensive grassland degradation (Dong et al., 2013; Zhang et al., 2018). However, slowly changing ecological conditions may be difficult for pastoralists and policy makers to perceive simultaneously and incorporate into risk control or sustainable rangeland management. Therefore, identifying areas potentially threatened by grazing activities, while distinguishing between grazing and climate change impacts, is an essential step in assessing and identifying grasslands with potential ecological restoration risks.
The integration of remote sensing monitoring models provides a basis for monitoring and assessing the spatiotemporal changes in ecological productivity (Robinson et al., 2018; Van Doninck and Tuomisto, 2018). GPP indicates the total amount of carbon dioxide fixed by plant photosynthesis and serves as a key indicator for estimating vegetation growth (Farquhar et al., 1980; Running and Coughlan, 1988). In recent decades, scientists have developed several models for assessing GPP (De Pury and Farquhar, 1997; Running et al., 2004; Zhang et al., 2016). The Vegetation Photosynthesis Model (VPM), as a typical model of photosynthetic efficiency, has been widely applied and validated in grassland ecosystems (Xiao et al., 2004a; Xiao et al., 2004b; Li et al., 2007; Jin et al., 2013; He et al., 2014). It shows effective assessment capabilities at both global and regional scales (Chen et al., 2014; Zhang et al., 2017), which provides strong support for estimating the impacts of human activities and climate change on vegetation dynamics. Currently, the residual trend method using multiple regression residuals between climate factors and vegetation metrics is often applied to quantify the impacts of human activities on vegetation dynamics, and its robustness has been verified in related studies (Qi et al., 2019; Yan et al., 2021; Zhang and Ye, 2021).
Based on satellite remote sensing and climatic data, this study explores the effectiveness of a series of grassland ecological conservation measures implemented over the past 20 years and provides new insights by quantitatively distinguishing the impacts of climate change and human activities on the spatiotemporal patterns of grassland productivity in the Xilingol grassland.

2 Materials and methods

2.1 Study area

Xilingol League is located in the north of China and the central part of Inner Mongolia, approximately 640 km from Beijing and 620 km from Hohhot. It is the nearest grassland pastoralism area to the Beijing-Tianjin-Hebei Economic Circle and serves as a crucial hub for national livestock production. Geographically, Xilingol League is positioned from 115°13′-117°06′E longitude and 43°02′-44°52′N latitude, and it experiences a typical temperate continental monsoon climate characterized by strong winds, drought and cold. The average annual temperature was around 3 ℃ in 2000-2020, with a freezing period lasting five months and a cold period extending for seven months. January marks the lowest temperatures, making it one of the coldest regions in North China, while July has the highest temperatures, averaging around 21 ℃ (Fig. 1c). The highest average annual temperatures are found in Sonid Right Banner and Erenhot City in the western part of Xilingol League. The average rainfall throughout the year is about 285 mm, with much of the rainfall concentrated in July, August and September. Geographically, the rainfall decreases from south-east to north-west, and Taibus Banner and Duolun County in the south of Xilingol League receive the most rainfall (Fig. 1b). The main vegetation type in Xilingol League is grassland, which accounts for more than 90% of the total area and is widely distributed throughout the League, while farmland is distributed in Taibus Banner and Duolun County, and forests and shrublands are distributed in East Ujimqin County and West Ujimqin Banner in the east (Fig. 1a). To improve the ecological environment, several ecological conservation measures have been successively implemented on the grassland since 2000, including the Beijing-Tianjin Sand Source Control Project (BTP), Returning Grazing Land to Grassland (RGG), Forage-Livestock Balance Management (F-L Balance), and the Grassland Ecological Protection Subsidy & Reward Program (GEPS&R) (Cai et al., 2020; Yan et al., 2021). Understanding the impacts of human activities on grassland across different policy periods and different grasslands types can guide the development and effective assessment of ecological conservation policies.
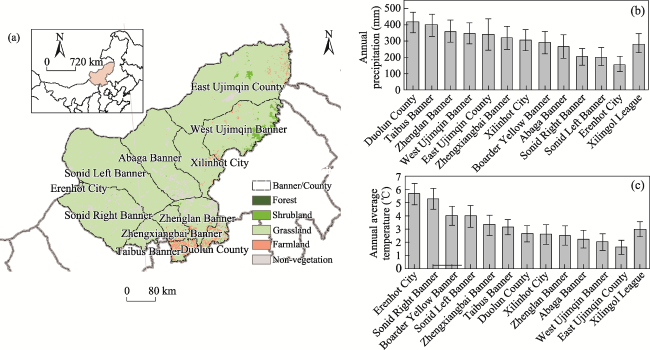
Fig. 1 Land use and land cover types, and spatial distribution of climatic factors in Xilingol League

Note: (a) Land use and land cover types. (b) Multi-year average precipitation from 2000 to 2020. (c) Multi-year average temperatures from 2000 to 2020.

2.2 Research data

(1) Actual observed GPP data
Values of CO2 net ecosystem exchange (NEE) were obtained from the flux observation station located at 43.55°N, 116.68°E in Inner Mongolia. On half-hourly time scales, three coordinate axis rotations, WPL corrections, and invalid data rejection were performed sequentially on the flux-observed NEE. Based on the calculated Re during the daytime and half-hourly NEE data, the actual GPP was determined by subtracting ecosystem respiration from NEP (Net Ecosystem Production) to calculate the half-hourly GPP values, which were summed to obtain daily production values.
(2) Remote sensing data
The VPM used LSWI (Land Surface Water Index) and EVI (Enhanced Vegetation Index) as input data, both derived from the reflectance products of MODIS (MOD09A1 V05, 500 m spatial resolution and 8 d temporal resolution, http://ladsweb.nascom.nasa.gov/).
(3) Meteorological data
The meteorological dataset (including precipitation and temperature) in the National Science & Technology Infrast-ructure (http://www.cnern.org.cn) was downloaded, which includes data from 1098 ground meteorological stations in China. The meteorological grid data were generated using ANUSPLIN interpolation based on data from the stations in Xilingol League.
(4) Livestock statistics
The livestock statistics were obtained from the Statistical Yearbook of Xilingol League from 2000 to 2020. To calculate grazing intensity effectively, the data for various types of livestock were converted into standard Sheep Units using conversion coefficients of Sheep: 1, Goats: 0.8, Cattle: 6, Horses: 5.5, and Camels: 8.5 (Yan et al., 2021). These standard Sheep Units and grassland areas were then normalized to derive the unit area livestock density (Yan et al., 2021).

2.3 Methods

(1) Separating the impacts of climate change and human activities
Human-driven GPP (GPPH) was distinguished by the difference between climate-driven GPP (GPPC) and actual GPP (GPPA) based on the residual trend method. This method relies on the observed correlation between the dominant climatic factors and vegetation dynamics in arid and semi-arid ecosystems. By removing the climate signature from the vegetation productivity time series, the remaining quantity is attributable to the influence of human activities. Additionally, trends in such residuals over the research period can differentiate between vegetation dynamics driven by human activities and those driven by climate change.
In this study, the GPPA from the VPM was influenced by both human activities and climate change. We calculated GPPC using an empirical formula for the relationship between GPPA and climate change, assuming GPPC is solely influenced by climate change, and the difference between GPPA and GPPC is the GPPH. Negative trends in GPPH suggest vegetation degradation primarily due to human activities, while positive trends indicate vegetation recovery resulting from human activities. We used the linear least square to calculate the slopes of GPPA, GPPH, and GPPC, which represent their trends. The ratio of the slope of GPPH to the slope of GPPA indicates the proportional contribution of human activities, and the same applies for GPPC.
G P P H = G P P A G P P C
where GPPH is human-driven GPP, GPPA is actual GPP, and GPPC is climate-driven GPP.
GPPC was calculated for each grassland type using the regression of GPPA on climatic variables. Trends in GPPC can indicate inter-annual changes in GPP influenced by climate change.
G P P C = a × C L I M + b
where CLIM is the main climatic variables, and a and b are the best-fitting parameters determined from the relationships between climatic variables and GPPA based on the linear least square regression method (Yan et al., 2021).
(2) Estimating actual GPP
The VPM is a satellite-based model of photosynthetic efficiency, which was established on the conceptual division between the photosynthetically active and non-photosynthetically active components. The model can be generated by equations 3 and 4:
G P P A = ε g × F P A R c h l × P A R
ε g = ε 0 × T s c a l a r × W s c a l a r × P s c a l a r
where εg is light use efficiency (µmol CO2/µmol PPFD); FPARchl is the fraction of PAR (Photosynthetically Active Radiation) absorbed by leaf chlorophyll in the canopy (µmol, photosynthetic photon flux density, PPFD), which is estimated as a linear function of EVI; and ε0 is maximum light use efficiency (CO2/PPFD). Tscalar, Wscalar, and Pscalar are scalars representing the impacts of temperature, moisture, and leaf phenology on vegetation light use efficiency, respectively. In this study, we used the regression between ε0 and the maximum EVI to determine ε0 for each pixel.
T s c a l a r = T T m i n × T T m a x T T m i n × T T m a x T T o p t 2
W s c a l a r = 1 + L S W I 1 + L S W I m a x
P s c a l a r = 1 + L S W I 2
where Tmin, Tmax, and Topt are the minimum, maximum, and optimal temperatures for photosynthesis, respectively; while LSWImax is the maximum LSWI for each pixel during the growing season.

3 Results

3.1 Xilingol grassland turned significantly greener from 2000 to 2020

GPPA showed a decreasing trend along the climatic gradient from southeast to northwest, which is consistent with the spatial decreasing trend of precipitation. The average GPPA for the grasslands of Xilingol League from 2000 to 2020 was approximately 177.69±33.51 g C m-2 yr-1. Among different regions, the highest GPPA were observed in Duolun County and Taibus Banner in the southern of Xilingol League, with values of 355.13±83.64 g C m-2 yr-1 and 311.78± 76.95 g C m-2 yr-1, respectively. In the eastern part of Xilingol League, West Ujimqin Banner and East Ujimqin County exhibited higher GPPA values of 273±66.60 g C m-2 yr-1 and 248.31±53.61 g C m-2 yr-1, respectively. The lowest GPPA values were found in the northwest of Xilingol League, specifically in Sonid Left Banner, Sonid Right Banner, and Erenhot City, which were all below 100 g C m-2 yr-1 (Fig. 2).
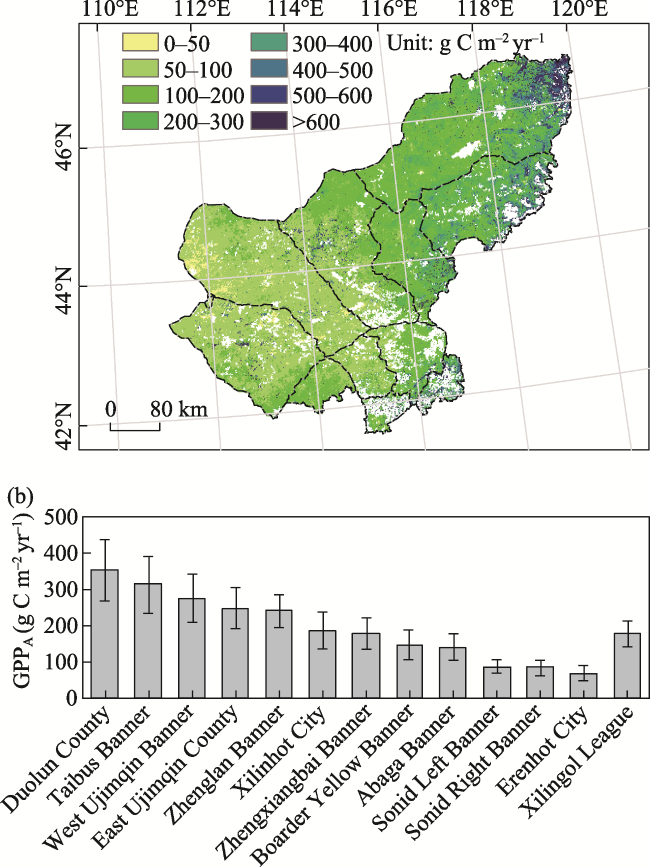
Fig. 2 (a) Spatial distribution and (b) statistical analysis of the average actual GPP in Xilingol League from 2000 to 2020
The GPPA of grassland in Xilingol League increased significantly during 2000-2020, with an average annual increase of 2.66 g C m-2 yr-1, representing a growth rate of 1.50% (P<0.05) (Fig. 3a). Regarding different regions, the GPPA increased faster in the eastern and southern Xilingol League and slower in the northwestern part. Specifically, Duolun County and Taibus Banner in the south experienced the fastest GPPA growth rates, increasing by averages of 10.58 g C m-2 yr-1 and 6.42 g C m-2 yr-1, respectively. Furthermore, the eastern regions including East Ujimqin County and West Ujimqin Banner had relatively higher growth rates of GPPA, with average annual increments of 4.53 g C m-2 yr-1 and 4.01 g C m-2 yr-1, respectively, while the growth rates of GPPA were slower in the western areas, particularly in Sonid Right Banner and Sonid Left Banner. However, the trend of GPPA in the southern region was decreasing, such as in Boarder Yellow Banner and Zhengxiangbai Banner with decreasing rates of -0.49 g C m-2 yr-1 and -0.90 g C m-2 yr-1, respectively.
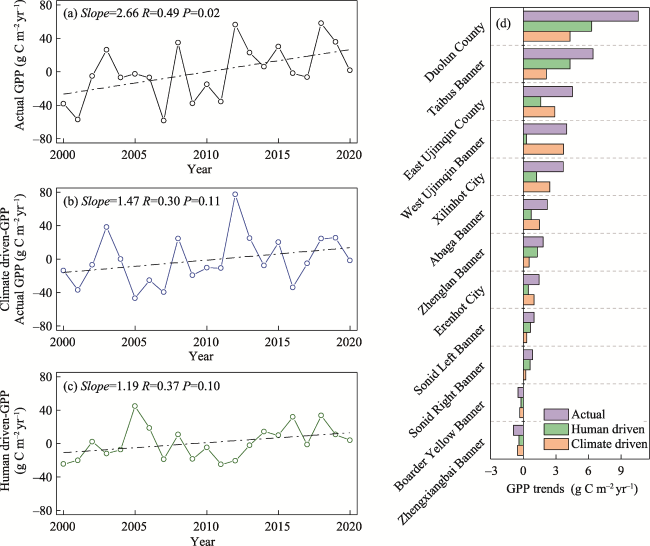
Fig. 3 Interannual trends of grassland (a) Actual GPP; (b) Climate-driven GPP; (c) Human-driven GPP in Xilingol League from 2000 to 2020; (d) Trends in grassland GPP in different regions of Xilingol League from 2000 to 2020

3.2 Climate change and human activities jointly promote the increasing trend of GPP

The primary productivity of grasslands in Xilingol League improved overall from 2000 to 2020, particularly in the eastern and southern regions, although there were also areas where primary productivity declined (Fig. 4a). Climate change and human activities jointly contributed to the increasing trend of grassland GPP in Xilingol League, resulting in increases of 1.47 g C m-2 yr-1 and 1.19 g C m-2 yr-1 in actual GPP, respectively, and the relative contributions of climate change and human activities were 55% and 45%, respectively. Climate change led to an increasing trend of GPP in most areas of the league, especially in the northeast where the impact of climate change on the GPP increase was most significant, while in the southwestern Xilingol League, climate change caused a non-significant decrease in GPP in Sonid Right Banner (Fig. 4b). Human activities were another major driver of the changes in GPP, and they significantly altered GPP in the western part of Xilingol League, where actual GPP is relatively low. In some areas, human activities led to a significant reduction in GPP in the eastern Xilingol League (Fig. 4c). Across the study area, the percentage of pixels showing a significant increase in human driven-GPP (91%) was higher than the percentage showing a significant decrease (9%), and the interannual variability in human driven-GPP mainly ranged from 0-5 g C m-2 yr-1, accounting for approximately 70% of all areas with significant changes (Fig. 4c).
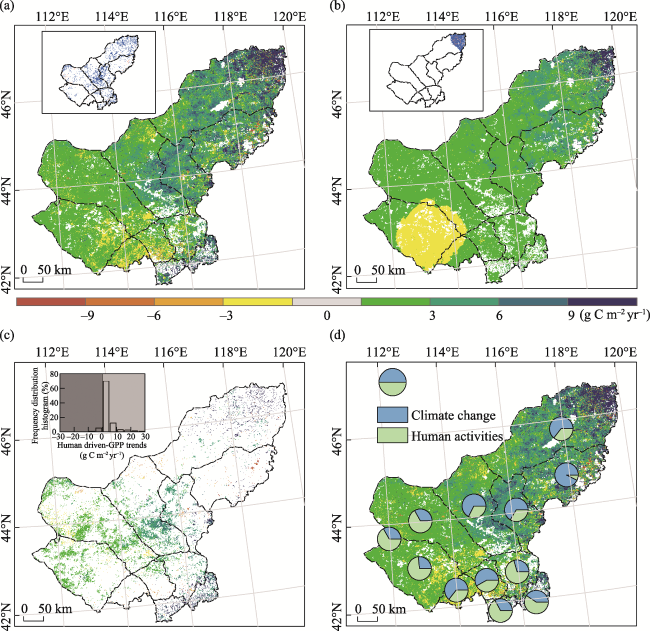
Fig. 4 Spatio-temporal patterns of the trends in Xilingol League from 2000 to 2020 for (a) Actual GPP, (b) Climate-driven GPP, and (c) Human-driven GPP. (d) Relative contributions of climate change and human activities to the changes in actual GPP in Xilingol League grasslands from 2000 to 2020

Note: The graphs in the top left corners of (a) and (b) represent the significance levels (P<0.05), and the graph in the top left corner of (c) represents the frequency distribution of the trend changes in human driven-GPP.

The relative contributions of climate change and human activities to GPP trends varied considerably in different regions (Fig. 4d). Climate change was the dominant factor driving the increase in actual GPP in areas with robust grass growth, such as in the east-central Xilingol League including East Ujimqin County, West Ujimqin Banner, Xilinhot City, and Abaga Banner, where its relative contribution exceeded 65%. Conversely, human activities were the dominant factors driving the change in actual GPP in areas with poorer grass growth, such as in the western Xilingol League including Sonid Left Banner, Sonid Right Banner, Zhenglan Banner, and Erenhot City and in the agro-pastoral ecotone including Taibus Banner and Duolun County, where the relative contribution was above 60%. Additionally, climate change was the primary driver of the reductions in actual GPP in Zhengxiangbai Banner and Boarder Yellow Banner Banner.

3.3 Grazing control policies and livestock impacts on grasslands

To mitigate grassland degradation and promote human well-being, the government has conducted a variety of ecological conservation programs since 2000 (Fig. 5). Frequent dust storms at the end of the twentieth century raised concerns about the desertified grasslands. The Beijing-Tianjin wind/sand source control program-I (BTP-I) was initiated in 2000, focusing on the management of desertified grasslands. The RGG was implemented in 2003, with the aim of restoring and managing degraded sandy grasslands in semi-pastoral and pastoral areas. The F-L balance was implemented in 2005, and it emphasized the regulation of livestock numbers based on grass production levels. It advocated for tailored grazing management designs according to the conditions of each pastoral area. The year-round grazing prohibitions were primarily enforced in ecologically degraded and fragile regions, which are mainly concentrated in the semi-arid and arid grasslands of the western regions. The Grassland ecological protection subsidy and reward program-I (GEPS&R-I) was launched in 2011, which covered almost all pastoral areas. This program divided grasslands into two categories based on degradation status: the no-grazing area in heavily degraded grasslands with stricter regulation and higher subsidies, and the forage-livestock balance area with lower subsidies covering all grasslands outside the no-grazing area. Comparing the trends of GPP changes attributed to grassland protection policies and human activities, it was evident that human activities contributed to an overall increase in GPP in the Xilingol League from 2000 to 2020, although with significant inter-decadal variations. Grassland GPPH in Xilingol League exhibited a pattern of increase followed by reduction, taking the major policy implementation years such as 2005 and 2011 as turning points.
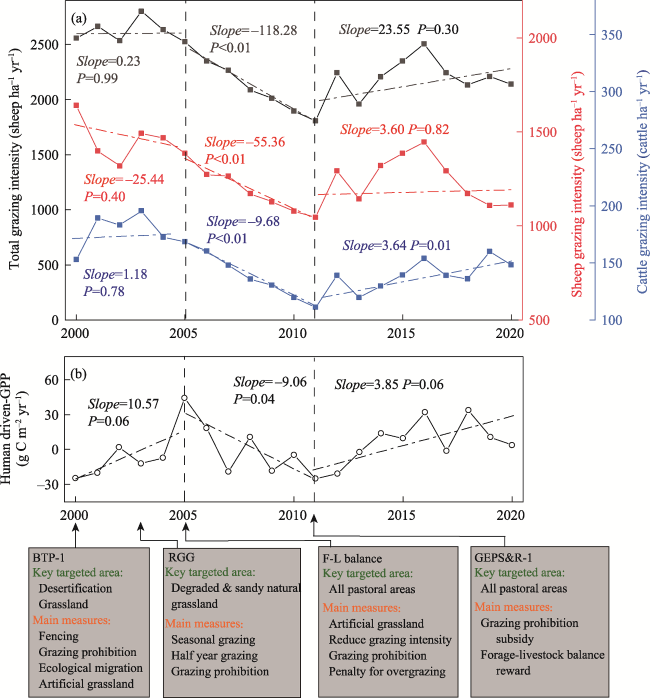
Fig. 5 Trends in Xilingol League grasslands from 2000 to 2020 for (a) grazing intensity and (b) human-induced GPP changes
Specifically, the overall grassland GPPH in Xilingol League showed an increasing trend in 2000-2005, with an average annual increase of 10.57 g C m-2 yr-1, during which BTP-I and RGG were mainly implemented. Although there was no significant change in overall grazing intensity during this period, sheep grazing intensity showed a non-significant decreasing trend, indicating that the implementation of policies such as grazing prohibition, fencing and rotational grazing gradually reduced the pressure of human activities on grassland productivity (Fig. 5). In high-quality grasslands at a relatively high actual GPP level, such as the eastern and southern Xilingol League including West Ujimqin Banner, East Ujimqin County, Xilinhot City, Duolun County and Taibus Banner, GPPH showed faster annual growth rates ranging from 15.11 g C m-2 yr-1 to 20.66 g C m-2 yr-1, with annual relative rates of increase ranging between 6% and 11% based on the multi-year average actual GPP as a reference. Meanwhile, the GPPH showed slower annual growth rates, with annual relative rates of increase below 6%, in the central and western Xilingol where the actual GPP was relatively lower, such as Abaga Banner, Erenhot City, Sonid Right Banner, Boarder Yellow Banner and Zhenglan Banner (Fig. 6).
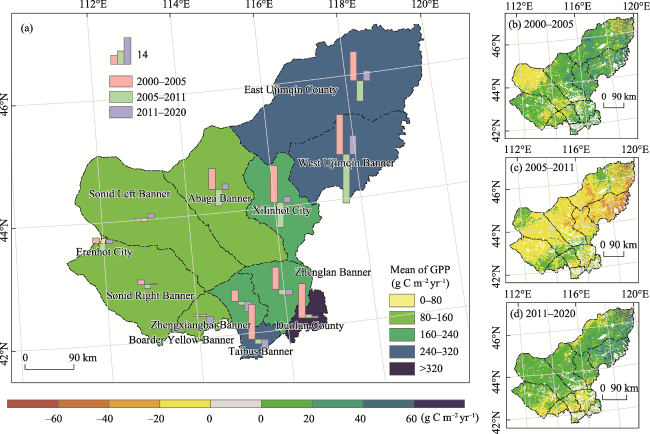
Fig. 6 (a) Intensities of human activity impacts on GPP changes in Xilingol League during different time periods, and spatial distribution patterns of trends in human-induced GPP changes from (b) 2000 to 2005, (c) 2005 to 2011, and (d) 2011 to 2020
A decreasing trend in grassland GPPH was found across the Xilingol League in 2005-2011, with an annual average reduction of 9.06 g C m-2 yr-1. The F-L balance was launched during this period, and its main measures were grazing prohibitions and grazing intensity reduction (Fig. 5). Statistical data indicated that grazing intensity decreased significantly in 2005-2011 (P<0.01), although social surveys in the region revealed that only 49.73% of herders were inclined to reduce their livestock numbers due to insufficient compensation for the ecological conservation, and that some herders even increased their livestock holdings in the context of the grazing control policies. Therefore, we inferred that the statistical grazing data could not correctly reflect the pressure of grazing on the grassland ecosystems. GPPH declined rapidly in the eastern high-quality grasslands such as East Ujimqin County, Xilinhot City and West Ujimqin Banner, with annual average reductions of 10.88 g C m-2 yr-1, 13.18 g C m-2 yr-1 and 25.38 g C m-2 yr-1, respectively, and average annual reduction rates of about 4% to 10%, using the multi-year average actual GPP as a reference. In addition, except for Duolun County and Xianghuang Banner, the other areas also showed decreasing trends in GPPH, with reduction rates ranging from 1.91 g C m-2 yr-1 to 8.69 g C m-2 yr-1 (Fig. 6). These results indicated that human activities had exerted significant constraints on grassland productivity in Xilingol League from 2005 to 2011, especially in the eastern high-quality grasslands.
In the next period, GPPH resumed an increasing trend across the Xilingol League grasslands, with an annual average increase of 3.85 g C m-2 yr-1 in 2011-2020. GEPS&R-I was implemented, and its main measures were grazing prohibition subsidies and forage-livestock balance rewards during this period. Meanwhile, the statistical data showed that despite a significant increase in cattle grazing intensity, overall grazing intensity remained significantly unchanged (Fig. 5). The trends of GPPH changes in different areas varied greatly. GPPH had faster increasing trends in the eastern high-productivity pastures with higher productivity, such as West Ujimqin Banner, East Ujimqin County and Xilinhot City, with average annual increases ranging from 3 g C m-2 yr-1 to 10 g C m-2 yr-1, and average annual increase rates of more than 2% compared with the multi-year average actual GPP (Fig. 6). The GPPH of East Ujimqin County, West Ujimqin Banner and Xilinhot City peaked in 2015, 2018 and 2018, respectively, followed by declining trends, although there was an overall increasing trend in GPPH from 2011 to 2020 (Fig. 7). The data also showed an increasing GPPH trend in the central and western grasslands with relatively low productivity, including Abaga Banner, Sonid Left Banner, Sonid Right Banner, and Erenhot City, where the rates of change were relatively slow and ranged from 0.54 g C m-2 yr-1 to 2.86 g C m-2 yr-1 (Fig. 6). In addition, Zhenglan Banner, Boarder Yellow Banner, Taibus Banner, and Zhengxiangbai Banner, which are located in the southern Xilingol League, displayed non-significant decreasing trends in GPPH, with average annual reductions ranging from 2.87 g C m-2 yr-1 to 5.11 g C m-2 yr-1 (Fig. 6), which suggested significant pressure from human activities on the local ecological environment. The impacts of human activities on GPP in 2011-2020 showed considerable spatial heterogeneity, and although the ecological protection policies had generally promoted the recovery of grasslands in the Xilingol League, grazing activities still exerted considerable ecological pressure on the eastern high-quality grasslands in recent years.
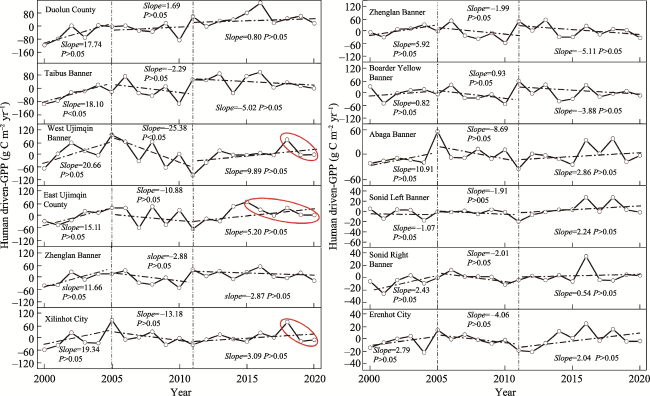
Fig. 7 Temporal trends in the impacts of human activities on GPP in different regions of Xilingol League during 2000-2005, 2005-2011, and 2011-2020

4 Discussion

Several studies have found that precipitation is the main factor influencing the spatial and inter-annual variations of vegetation productivity in the Xilingol grassland (Gu et al., 2012; Zhang et al., 2017). This study confirmed that the trend of GPPC was mainly dependent on the changes in precipitation. Studies on species composition have indicated that overgrazing might accelerate soil organic matter and species composition losses, leading to grassland degradation that can be difficult to restore, although climate change could mitigate degradation and enhance GPP (Wang et al., 2003; Wang and Wesche, 2016; Han et al., 2018). Additionally, grasslands can still be influenced by extreme climatic events such as droughts, while GPP is strongly correlated with precipitation (Zhang et al., 2013; Wagle et al., 2014). Successive extreme climatic events including droughts occurred in Inner Mongolia from 14 July 1999 to 10 June 2002, and in 2007, when precipitation fell by about 45% compared to the multi-year average (Wu et al., 2011), and the two serious droughts led to significant reductions in GPP in 2001 and 2007 (Fig. 3a). Meanwhile, a significant increase in the frequency of extreme climatic events is expected in the future, coupled with continuing reductions in precipitation (Tong et al., 2019b), which suggest that vegetation recovery due to increased precipitation might not be sustainable.
The negative effects of grazing on GPP have been demonstrated in Inner Mongolia and other regions (Yan et al., 2013; Du et al., 2018), but vegetation cover and grassland productivity recovered rapidly when grazing was excluded (Sasaki et al., 2011; Chen et al., 2012). This study found that grasslands have recovered through strict grazing control during the past 20 years. Other studies also found that degradation has continued due to intensive grazing activities, especially in certain non-degraded grasslands in relatively humid areas (Mu et al., 2013; Wieland et al., 2019). This implies that grassland conservation policies may have limited effectiveness in these areas, possibly due to conflicts between the livelihood aspirations of herders and ecological conservation objectives.
In fact, livestock numbers are increasing in rangelands around the world. The livestock numbers on the Mongolian Plateau increased from about 131 million sheep in 2000 to about 201 million sheep in 2016, marking a 62% increase (Dong et al., 2019). Similarly, the livestock statistics in Central Asia exhibited an increasing trend from 2000 to 2017, with the sheep population almost doubling from 2.9×10⁶ to 5.6×10⁶; and the total livestock numbers, including cattle, goats, and sheep, also increased in Africa (Tong et al., 2019a). Sheep and goat populations in 21 pastoral counties of Kenya increased by 76.3%, while species diversity significantly declined between 1977 and 2016 (Ogutu et al., 2016). These trends in livestock growth suggest a considerable risk of grassland degradation, emphasizing the urgent need to balance pastoral livelihoods with grassland protection. Therefore, there is necessary to adopt prospective policies before the ecological balance becomes disrupted. Future policies should account for the impact of grazing activities on grasslands, especially after productivity increases in wet years, and strict grazing controls to restore damaged grasslands should no longer be implemented due to their huge economic costs and impacts on herders’ livelihoods.

5 Conclusions

This study analyzed the effects of climate and human activities on the variation of GPP by separating the human-driven GPP and climate-driven GPP changes in Xilingol League grasslands from 2000 to 2020. The results indicated an overall greening trend during this period, while human activities and climate change jointly contributed to the trend of grassland status, with relative contributions of 55% and 45%, respectively. Significant regional differences were observed in the relative contributions of human activities and climate change to the trends in GPP variation. Climate change emerged as the principal driver in the central and eastern regions of Xilingol League with robust grass growth, accounting for more than 65% of the GPP enhancement. Conversely, human activities were the dominant factors in less verdant western regions and the agro-pastoral ecotone, representing more than 60% of the GPP change. The impact of human activities on grassland productivity exhibited significant temporal variations, leading to changes in the trend of GPP characterized by “an initial increase, a subsequent decrease, then a subsequent increase”. Specifically, measures such as wind/sand source control and returning grazing land to grassland from 2000 to 2005 significantly improved vegetation growth in high-quality grasslands by reducing grazing intensity, although they only had moderate effects on grasslands with lower productivity. Due to inadequate compensation for grassland ecological protection, the forage-livestock balance policy from 2005 to 2011 imposed significant limitations on grassland productivity in Xilingol League, especially in the eastern high-quality grasslands. The implementation of ecological protection policies from 2011 to 2020 generally facilitated the recovery of productivity in eastern and western Xilingol League grasslands, but significant ecological pressure has persisted in recent years, with human activities leading to reduced productivity in the agricultural-pastoral transition zone in the southern Xilingol League. Climate change and human activities collectively promoted the recovery of grassland productivity in Xilingol League, but high-intensity human activities continue to exert significant ecological pressure on traditional high-quality pastoral areas.
Therefore, it is imperative to rigorously consider the impact of human activities on grassland productivity and distinguish it from climate-driven productivity changes in order to improve the effectiveness of ecological management measures in the formulation of ecological restoration and conservation strategies. Human activities have mainly promoted grassland productivity in the central and western Xilingol League, indicating the obvious ecological benefits of the implemented grassland protection measures, and that attention should be paid to maintaining robust ecological management and protection. In the southern and eastern Xilingol League, the impacts of human activities on grassland productivity showed an increase in the negative effect and a reduction in the positive effect. Therefore, the grasslands management strategy in this region should strengthen the supervision of grazing prohibition and forage-livestock balance, and continuously improve the conservation measures according to their practical governance effects in the future.
[1]
Abu Hammad A, Tumeizi A. 2012. Land degradation: socioeconomic and environmental causes and consequences in the eastern Mediterranean. Land Degradation & Development, 23(3): 216-226.

[2]
Bryan B A, Gao L, Ye Y Q, et al. 2018. China’s response to a national land-system sustainability emergency. Nature, 559(7713): 193-204.

[3]
Cai D, Ge Q, Wang X, et al. 2020. Contributions of ecological programs to vegetation restoration in arid and semiarid China. Environmental Research Letters, 15: 114046. DOI: 10.1088/1748-9326/abbde9.

[4]
Chen H B, Shao L Q, Zhao M J, et al. 2017. Grassland conservation programs, vegetation rehabilitation and spatial dependency in Inner Mongolia, China. Land Use Policy, 64: 429-439.

[5]
Chen J Q, John R, Shao C L, et al. 2015. Policy shifts influence the functional changes of the CNH systems on the Mongolian Plateau. Environmental Research Letters, 10(8): 085003. DOI: 10.1088/1748-9326/10/8/085003.

[6]
Chen J Q, Yan H M, Wang S Q, et al. 2014. Estimation of gross primary productivity in Chinese terrestrial ecosystems by using VPM model. Quaternary Sciences, 34(4): 732-742.

[7]
Chen Y P, Li Y Q, Zhao X Y, et al. 2012. Effects of grazing exclusion on soil properties and on ecosystem carbon and nitrogen storage in a sandy rangeland of Inner Mongolia, Northern China. Environmental Management, 50: 622-632.

DOI PMID

[8]
De Haan C. 2006. Livestock’s long shadow: Environmental issues and options. Food and Agriculture Organization of the United Nations (FAO). http://www.virtualcentre.org/enlibrary/key_pub/longshad/A0701E00.pdf.

[9]
De Pury D G G, Farquhar G D. 1997. Simple scaling of photosynthesis from leaves to canopies without the errors of big-leaf models. Plant, Cell & Environment, 20(5): 537-557.

[10]
Delang C O, Yuan Z. 2015. China’s grain for green program:A review of the largest ecological restoration and rural development program in the world. Switzerland: Springer International Publishing,

[11]
Dong J W, Liu J Y, Zhang G L, et al. 2013. Climate change affecting temperature and aridity zones: A case study in Eastern Inner Mongolia, China from 1960-2008. Theoretical and Applied Climatology, 113: 561-572.

[12]
Dong Y, Yan H M, Du W P, et al. 2019. Spatio-temporal analysis of grassland carrying capacity in Mongolian Plateau based on supply-consumption relationship. Journal of Natural Resources, 34(5): 1093-1107. (in Chinese)

DOI

[13]
Du B Z, Zhen L, Hu Y F, et al. 2018. Comparison of ecosystem services provided by grasslands with different utilization patterns in China’s Inner Mongolia Autonomous Region. Journal of Geographical Sciences, 28(10): 1399-1414.

DOI

[14]
Evans D M, Villar N, Littlewood N A, et al. 2015. The cascading impacts of livestock grazing in upland ecosystems: A 10-year experiment. Ecosphere, 6(3): 1-15.

[15]
Farquhar G D, von Caemmerer S, Berry J A. 1980. A biochemical model of photosynthetic CO2 assimilation in leaves of C3 species. Planta, 149: 78-90.

DOI PMID

[16]
Gu R Y, Zhou W C, Bai M L, et al. 2012. Impacts of climate change on phenological phase of herb in the main grassland in Inner Mongolia. Acta Ecologica Sinica, 32(3): 767-776.

[17]
Han D M, Wang G Q, Xue B L, et al. 2018. Evaluation of semiarid grassland degradation in North China from multiple perspectives. Ecological Engineering, 112: 41-50.

[18]
He H L, Liu M, Xiao X M, et al. 2014. Large-scale estimation and uncertainty analysis of gross primary production in Tibetan alpine grasslands. Journal of Geophysical Research: Biogeosciences, 119(3): 466-486.

[19]
Hu Z M, Zhao Z, Zhang Y, et al. 2019. Does “Forage-Livestock Balance” policy impact ecological efficiency of grasslands in China? Journal of Cleaner Production, 207: 343-349.

[20]
Huang B B, Lu F, Wang X K, et al. 2023. The impact of ecological restoration on ecosystem services change modulated by drought and rising CO2. Global Change Biology, 29: 5304-5320.

DOI PMID

[21]
Huang L, Xiao T, Zhao Z P, et al. 2013. Effects of grassland restoration programs on ecosystems in arid and semiarid China. Journal of Environmental Management, 117: 268-275.

DOI PMID

[22]
Jin C, Xiao X M, Merbold L, et al. 2013. Phenology and gross primary production of two dominant savanna woodland ecosystems in Southern Africa. Remote Sensing of Environment, 135: 189-201.

[23]
Li Z Q, Yu G R, Xiao X M, et al. 2007. Modeling gross primary production of alpine ecosystems in the Tibetan Plateau using MODIS images and climate data. Remote Sensing of Environment, 107(3): 510-519.

[24]
Liu M, Dries L, Heijman W, et al. 2018. The impact of ecological construction programs on grassland conservation in Inner Mongolia, China. Land Degradation & Development, 29(2): 326-336.

[25]
Lu X Y, Kelsey K C, Yan Y, et al. 2017. Effects of grazing on ecosystem structure and function of alpine grasslands in Qinghai-Tibetan Plateau: A synthesis. Ecosphere, 8(1): e01656.

[26]
Mu S J, Chen Y Z, Li J L, et al. 2013. Grassland dynamics in response to climate change and human activities in Inner Mongolia, China between 1985 and 2009. The Rangeland Journal, 35(3): 315-329.

[27]
Ogutu J O, Piepho H P, Said M Y, et al. 2016. Extreme wildlife declines and concurrent increase in livestock numbers in Kenya: What are the causes? Plos One, 11(9): e0163249. DOI: 10.1371/journal.pone.0163249.

[28]
Qi X, Jia J, Liu H, et al. 2019. Relative importance of climate change and human activities for vegetation changes on China’s silk road economic belt over multiple timescales. CATENA, 180: 224-237.

[29]
Robinson N P, Allred B W, Smith W K, et al. 2018. Terrestrial primary production for the conterminous United States derived from Landsat 30 m and MODIS 250 m. Remote Sensing in Ecology and Conservation, 4(3): 264-280.

[30]
Rowntree K, Duma M, Kakembo V, et al. 2004. Debunking the myth of overgrazing and soil erosion. Land degradation & development, 15(3): 203-214.

[31]
Running S W, Coughlan J C. 1988. A general model of forest ecosystem processes for regional applications I. Hydrologic balance, canopy gas exchange and primary production processes. Ecological Modelling, 42(2): 125-154.

[32]
Running S W, Nemani R R, Heinsch F A, et al. 2004. A continuous satellite-derived measure of global terrestrial primary production. Bioscience, 54(6): 547-560.

[33]
Sasaki T, Okubo S, Okayasu T, et al. 2011. Indicator species and functional groups as predictors of proximity to ecological thresholds in Mongolian rangelands. Plant Ecology, 212: 327-342.

[34]
Shao Q Q, Liu S C, Ning J, et al. 2023. Remote sensing assessment of the ecological benefits provided by national key ecological projects in China during 2000-2019. Journal of Geographical Sciences, 33(8): 1587-1613.

DOI

[35]
Tälle M, Deák B, Poschlod P, et al. 2016. Grazing vs. mowing: A meta-analysis of biodiversity benefits for grassland management. Agriculture, Ecosystems & Environment, 222: 200-212.

[36]
Teague W R, Dowhower S L. 2003. Patch dynamics under rotational and continuous grazing management in large, heterogeneous paddocks. Journal of Arid Environments, 53(2): 211-229.

[37]
Tong L J, Liu Y Y, Wang Q, et al. 2019a. Relative effects of climate variation and human activities on grassland dynamics in Africa from 2000 to 2015. Ecological Informatics, 53: 100979.

[38]
Tong S Q, Li X Q, Zhang J Q, et al. 2019b. Spatial and temporal variability in extreme temperature and precipitation events in Inner Mongolia (China) during 1960-2017. Science of the Total Environment, 649: 75-89.

[39]
Van doninck J, Tuomisto H. 2018. A Landsat composite covering all Amazonia for applications in ecology and conservation. Remote Sensing in Ecology and Conservation, 4(3): 197-210.

[40]
Wagle P, Xiao X M, Torn M S, et al. 2014. Sensitivity of vegetation indices and gross primary production of tallgrass prairie to severe drought. Remote Sensing of Environment, 152: 1-14.

[41]
Waldron S, Brown C, Longworth J. 2010. Grassland degradation and livelihoods in China’s western pastoral region: A framework for understanding and refining China’s recent policy responses. China Agricultural Economic Review, 2(3): 298-320.

[42]
Wang G X, Cheng G D, Shen Y P, et al. 2003. Influence of land cover changes on the physical and chemical properties of alpine meadow soil. Chinese Science Bulletin, 48: 118-124.

[43]
Wang Y, Wesche K. 2016. Vegetation and soil responses to livestock grazing in Central Asian grasslands: A review of Chinese literature. Biodiversity and Conservation, 25(12): 2401-2420.

[44]
Wesche K, Ambarlı D, Kamp J, et al. 2016. The palaearctic steppe biome: A new synthesis. Biodiversity and Conservation, 25(12): 2197-2231.

[45]
Wieland R, Lakes T, Hu Y F, et al. 2019. Identifying drivers of land degradation in Xilingol, China, between 1975 and 2015. Land Use Policy, 83: 543-559.

[46]
Wu J G, Zhang Q, Li A, et al. 2015. Historical landscape dynamics of Inner Mongolia: Patterns, drivers, and impacts. Landscape Ecology, 30: 1579-1598.

[47]
Wu Z Y, Lu G H, Wen L, et al. 2011. Reconstructing and analyzing China’s fifty-nine years (1951-2009) drought history using hydrological model simulation. Hydrology and Earth System Sciences, 15(9): 2881-2894.

[48]
Xiao X M, Hollinger D, Aber J, et al. 2004a. Satellite-based modeling of gross primary production in an evergreen needleleaf forest. Remote Sensing of Environment, 89(4): 519-534.

[49]
Xiao X M, Zhang Q Y, Braswell B, et al. 2004b. Modeling gross primary production of temperate deciduous broadleaf forest using satellite images and climate data. Remote Sensing of Environment, 91(2): 256-270.

[50]
Yan H M, Xue Z C, Niu Z E. 2021. Ecological restoration policy should pay more attention to the high productivity grasslands. Ecological Indicators, 129: 107938. DOI: 10.1016/j.ecolind.2021.107938.

[51]
Yan L, Zhou G S, Zhang F. 2013. Effects of different grazing intensities on grassland production in China: A meta-analysis. Plos One, 8(12): e81466. DOI: 10.1371/journal.pone.0081466.

[52]
Yang Y, Wang Z Q, Li J L, et al. 2016. Comparative assessment of grassland degradation dynamics in response to climate variation and human activities in China, Mongolia, Pakistan and Uzbekistan from 2000 to 2013. Journal of Arid Environments, 135: 164-172.

[53]
Zhang G L, Biradar C M, Xiao X M, et al. 2018. Exacerbated grassland degradation and desertification in Central Asia during 2000-2014. Ecological Applications, 28(2): 442-456.

DOI PMID

[54]
Zhang Q Y, Zhao D S, Wu S H, et al. 2013. Research on vegetation changes and influence factors based on eco-geographical regions of Inner Mongolia. Scientia Geographica Sinica, 33(5): 594-601.

[55]
Zhang S W, Zhang R, Liu T X, et al. 2017. Empirical and model-based estimates of spatial and temporal variations in net primary productivity in semi-arid grasslands of Northern China. Plos One, 12(11): e0187678. DOI: 10.1371/journal.pone.0187678.

[56]
Zhang Y, Ye A. 2021. Quantitatively distinguishing the impact of climate change and human activities on vegetation in mainland China with the improved residual method. GIScience & Remote Sensing, 58(2): 235-260.

[57]
Zhang Y L, Song C H, Sun G, et al. 2016. Development of a coupled carbon and water model for estimating global gross primary productivity and evapotranspiration based on eddy flux and remote sensing data. Agricultural and Forest Meteorology, 223: 116-131.

[58]
Zhou W, Yang H, Huang L, et al. 2017. Grassland degradation remote sensing monitoring and driving factors quantitative assessment in China from 1982 to 2010. Ecological Indicators, 83: 303-313.

Outlines

/