
Journal of Resources and Ecology >
Driving Factors of Coordinated Development in Chinese Border Cities: A Case Study of Lincang City in Southwest China
|
XU Bingjie, E-mail: xubingjie21@mails.ucas.ac.cn |
Received date: 2023-09-27
Accepted date: 2023-11-08
Online published: 2024-07-25
Supported by
The National Natural Science Foundation of China(42130508)
In the context of the “Belt and Road Initiative”, the sustainable development of border cities is paramount for facilitating intergovernmental exchanges. Using the system dynamics approach, we integrated border policy factors to create the Border City Coordinated Development (BCCD-SD) model, encompassing three dimensions: Economic, Social, and Resource-Environment. Furthermore, a comprehensive evaluation indicator, the City Coordinated Development Index (CCDI), was devised. Using Lincang City in Southwest China as a case study, this article examines the trends in city development under three scenarios: Inertial Development, Rapid Development, and Green Development. The research findings demonstrate that the model adeptly captures trends in the city coordinated development indicators. Among the three scenarios, the rapid development scenario stands out, yielding the most favorable economic indicators, superior public infrastructure, and the highest employed population. However, the rapid development path, which is heavily focused on economic growth, intensifies resource and environmental pressures, giving rise to sustainability challenges. In contrast, although the green development scenario trails slightly in economic performance compared to rapid development, it fosters a larger urban population and transition of the employed population into citizens while excelling in resource and environmental aspects. Overall, the CCDI attains its highest score under the green development scenario, surpassing those of rapid and inertia development, signifying superior city development coordination along the green path. This scenario effectively combines economic growth, social progress, and resource-environment protection. This study also emphasizes the pivotal role of ports in the coordinated development of border cities and underscores the necessity of expediting the transition from a “gateway” economy to a “port+” economy. One objective of this article is to encourage border cities to serve as more effective windows to the outside world, promote regional coordination, and achieve high-quality development.
XU Bingjie , YOU Zhen , FENG Zhiming , LIAN Chenqin , QI Wei , YOU Shiqing , FAN Feifei . Driving Factors of Coordinated Development in Chinese Border Cities: A Case Study of Lincang City in Southwest China[J]. Journal of Resources and Ecology, 2024 , 15(4) : 951 -965 . DOI: 10.5814/j.issn.1674-764x.2024.04.016
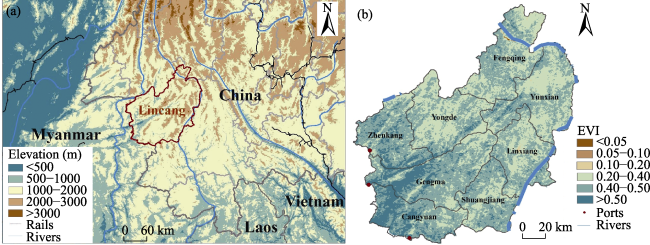
Fig. 1 Overview of the natural conditions of Lincang CityNote: (a) Displays the topographic elevation map of Lincang City and its location along the southwestern border of China, while (b) Illustrates the Enhanced Vegetation Index (EVI) in Lincang City. |
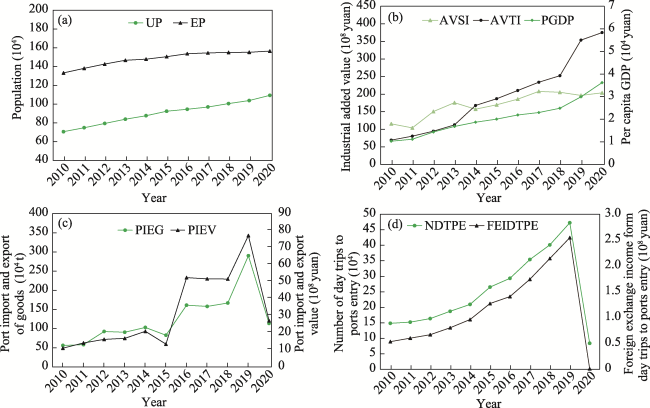
Fig. 2 Overview of the economic and social conditions in Lincang CityNote: (a) Depicts the urban population and employed population (UP, EP) of Lincang City; (b) Shows the per capita GDP and the value-added contributions of the secondary and tertiary industries (PGDP, AVSI, AVTI) in Lincang City from 2010 to 2020; (c) Displays the volumes and values of imports and exports through the ports (PIEG, PIEV) in Lincang City; and (d) Illustrates the number of inbound one-day tourists and the foreign exchange income generated from inbound one-day tourists (NDTPE, FEDTPE) at the ports. |
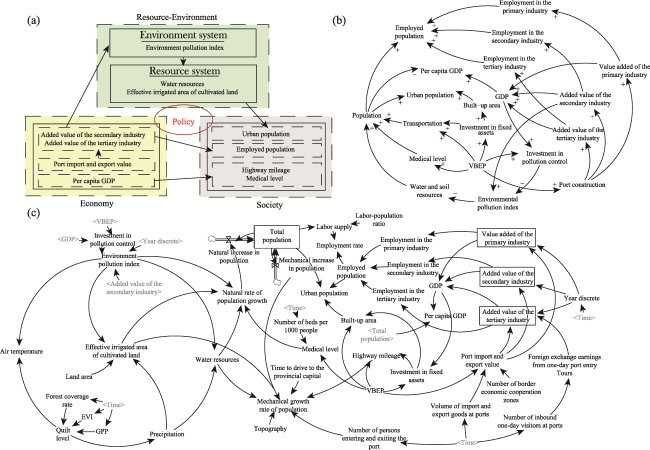
Fig. 3 BCCD-SD model construction diagramNote: (a) Depicts the conceptual model of BCCD-SD, listing only a subset of key indicators. (b) Presents the causal loop diagram of the model, with each arrow indicating the feedback direction. The polarity (“+” for positive, “-” for negative) on each connecting line represents the direction of change caused by that factor. (c) Shows the complete flowchart of the BCCD-SD model. In this figure, VBEP represents China’s “Vitalizing Border Areas and Enriching the People” policy, and the Environmental Pollution Index is synthesized by averaging the weighted values of solid waste emissions, wastewater emissions, and sulfur dioxide emissions. |
Table 1 BCCD-SD model variables and fitting formulas |
| Class | Variable | Abbreviation | Formula |
|---|---|---|---|
| Economy | Added value of the primary industry | AVPI | AVPI = -31732.40+15.82×YD+PIEV/3 |
| Added value of the secondary industry | AVSI | AVSI = 9.47×YD+0.05×PIEV-18916.10 | |
| Added value of the tertiary industry | AVTI | AVTI = 29.61×YD+0.24×PIEV-59474.10 | |
| Foreign exchange earnings from one-day port entry tours | FEDTPE | FEDTPE = 0.06×NIDVP-0.35 | |
| GDP | GDP | GDP =AVPI+AVSI+AVTI | |
| Number of border economic cooperation zones | NBECZ | NBECZ=1 | |
| Per capita GDP | PGDP | PGDP=GDP/TP | |
| Port import and export value | PIEV | PIEV=-7.69+0.16×VIEGP×VBEP×NBECZ | |
| Time to drive to the provincial capital | TDPC | TDPC=5.25 | |
| Investment in fixed assets | IFA | IFA=630.11-3.66×GDP×VBEP/2+0.0079×(GDP)2 | |
| Built-up area | BUA | BUA =23.24-4017.38/(IFA×VBEP) | |
| Number of inbound one-day visitors at ports | NIDVP | Table functions | |
| Number of persons entering and exiting the port | NPEP | ||
| Volume of import and export goods at ports | VIEGP | ||
| Society | Employed population | EP | EP=1815.79-0.70×EIPI+0.10×P×LA |
| Employment in the primary industry | EIPI | EIPI=AVPI-0.12+92.87 | |
| Employment in the secondary industry | ESI | ESI=AVSI×0.06+10.00 | |
| Employment in the tertiary industry | ETI | ETI=0.07×AVTI+36.40 | |
| Employment rate | ER | ER=EP/LS | |
| Highway mileage | HM | HM=14293.8+1.8788×IFA×VBEP/2+ 0.0002×(IFA)2 | |
| Labor supply | LS | LS=LPR×TP | |
| Labor-population ratio | LPR | LPR=0.645 | |
| Mechanical growth rate of population | MGRP | MGRP=((HM+WR/10+EIC+NPEP)/TDPC/8.5-T×4)/10000/240 | |
| Mechanical increase in population | MIP | MIP=MGRP×TP | |
| Number of beds per 1000 people | NBP | Table functions | |
| Medical level | ML | ML=VBEP×NBP | |
| Natural increase in population | NIP | NIP=NRPG×TP | |
| Natural rate of population growth | NRPG | NRPG=(0.012×ML+10/(1+EPI)+WR×0.0128+EIC×0.0084)/(3E+06)+0.0006 | |
| Total population | TP | TP=INTEG (MIP+NIP, 241.39) | |
| Urban population | UP | UP=-160.29+0.38×TP+1.46×BUA+ 0.88×EP | |
| Resource/ Environment | Air temperature | AT | AT=EPI×(6.76E-05)+QL×4.91+11.64 |
| Effective irrigated area of cultivated land | EIC | EIC=1815.79-0.70×EPI+0.10×P×LA | |
| Environment pollution index | EPI | EPI=2026.71+2×AVSI-20.03×IPC×8 | |
| Investment in pollution control | IPC | IPC=GDP×0.007×VBEP | |
| Land area | LA | LA=2.36 | |
| Precipitation | P | P=QL×750 | |
| Quilt level | QL | QL=EVI+GPP+FCR | |
| Topography | T | T=1631.54 | |
| EVI | EVI | Table functions | |
| Forest coverage rate | FCR | ||
| GPP | GPP | ||
| Water resources | WR | WR=108.51-0.03×EPI+0.05×P | |
| Policy | Vitalizing Border Areas and Enriching the People | VBEP | VBEP =2 |
| Others | Year discrete | YD | 2010—2030 |
| Time | Time | A time variable used to represent the dynamics |
Note: Due to space limitations, the table function formulas are no longer listed. |
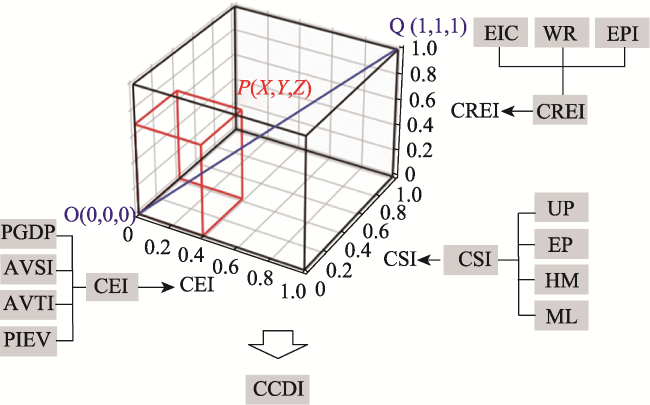
Fig. 4 Three-dimensional diagram of the CCDI based on the BCCD-SD model |
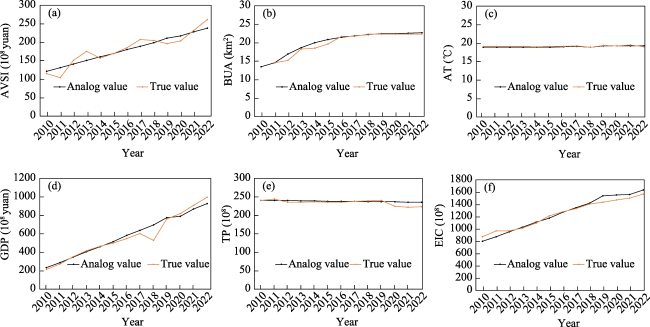
Fig. 5 Comparisons between the simulated values of six indicators under the inertia development scenario and their actual values from 2010 to 2022 |
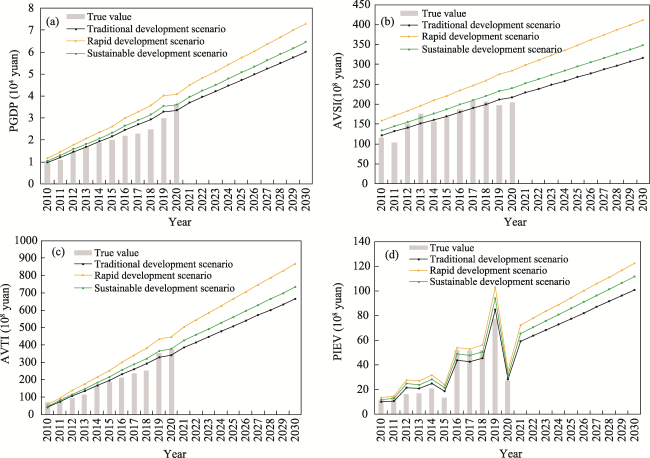
Fig. 6 The city economy subsystem under the three scenarios from 2010 to 2030 |
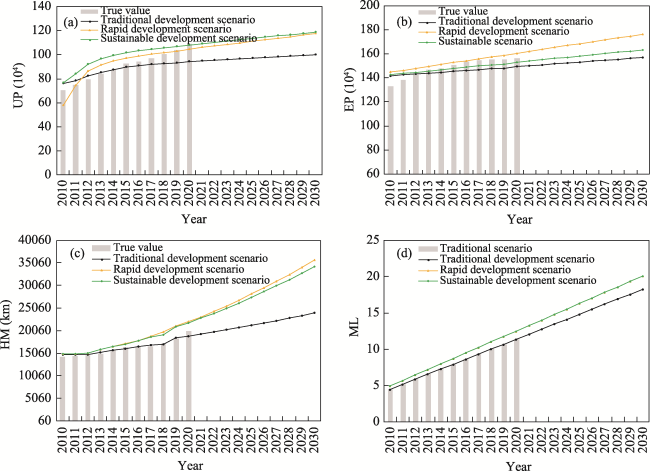
Fig. 7 The city society subsystem under the three scenarios from 2010 to 2030Note: In Fig. 7d, the curve representing the green development scenario overlaps with that of the rapid development scenario. |
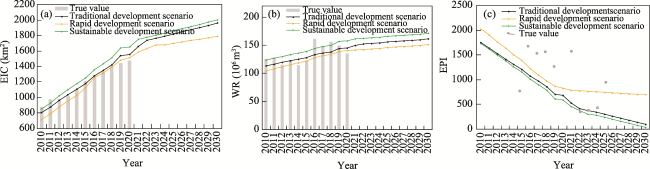
Fig. 8 The city resource-environment subsystem under the three scenarios from 2010 to 2030 |
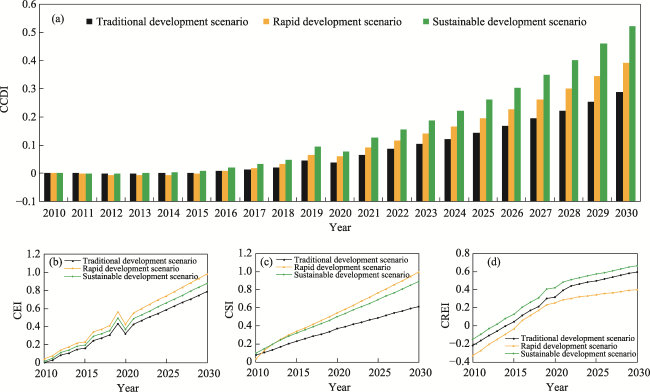
Fig. 9 The CCDI, CEI, CSI and CREI under the three scenarios from 2010 to 2030 |
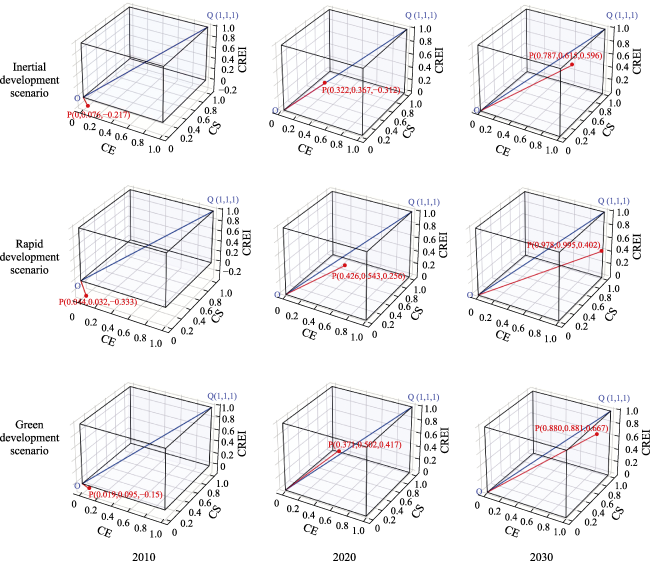
Fig. 10 Three-dimensional schematic diagrams illustrating the CCDI values in the three scenarios for the years 2010, 2020, and 2030 |
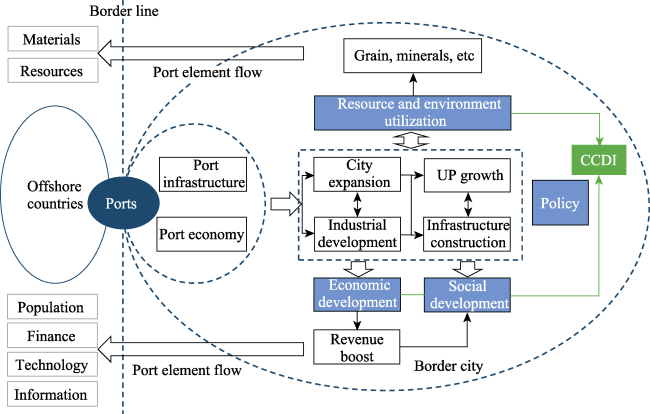
Fig. 11 Mechanism by which ports promote the coordinated development of border cities |
| [1] |
|
| [2] |
|
| [3] |
|
| [4] |
|
| [5] |
|
| [6] |
|
| [7] |
|
| [8] |
|
| [9] |
|
| [10] |
Department of Trade and Industry DTI. 2003. Energy white paper: Our energy future: Creating a low carbon economy. London, UK: HMSO.
|
| [11] |
|
| [12] |
|
| [13] |
|
| [14] |
|
| [15] |
|
| [16] |
|
| [17] |
|
| [18] |
|
| [19] |
|
| [20] |
|
| [21] |
|
| [22] |
|
| [23] |
|
| [24] |
|
| [25] |
|
| [26] |
|
| [27] |
|
| [28] |
|
| [29] |
|
| [30] |
|
| [31] |
United Nations UN. 2015. Transforming our world: The 2030 agenda for sustainable development. New York, USA: UN General Assembly.
|
| [32] |
|
| [33] |
|
| [34] |
|
| [35] |
|
| [36] |
|
| [37] |
|
| [38] |
|
| [39] |
|
| [40] |
|
| [41] |
|
| [42] |
|
| [43] |
|
| [44] |
|
| [45] |
|
| [46] |
|
| [47] |
|
| [48] |
|
| [49] |
|
| [50] |
|
| [51] |
|
| [52] |
|
/
| 〈 |
|
〉 |