Impact of Human Activities on Ecosystem

The Policy of Energy Saving, Pollution Control and Carbon Reduction based on the Cause Analysis of “Power Restriction” Event

  • YANG Churui , 1 ,
  • ZHOU Xiaolin 2 ,
  • LIU Zhu 1 ,
  • WANG Yu’an , 3, *
Expand
  • 1. Beihang University, Beijing 100191, China
  • 2. Gansu Agricultural University, Lanzhou 730070, China
  • 3. Beijing University of Technology, Beijing 100124, China
* WANG Yu’an, E-mail:

YANG Churui, E-mail:

Received date: 2023-12-01

  Accepted date: 2024-03-15

  Online published: 2024-07-25

Abstract

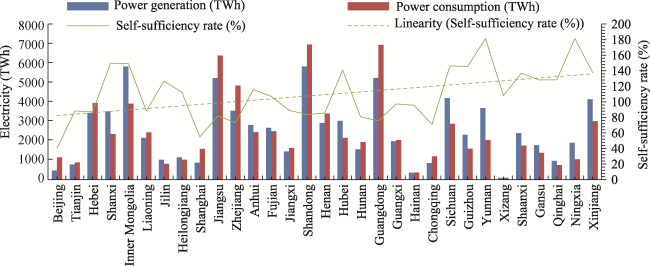
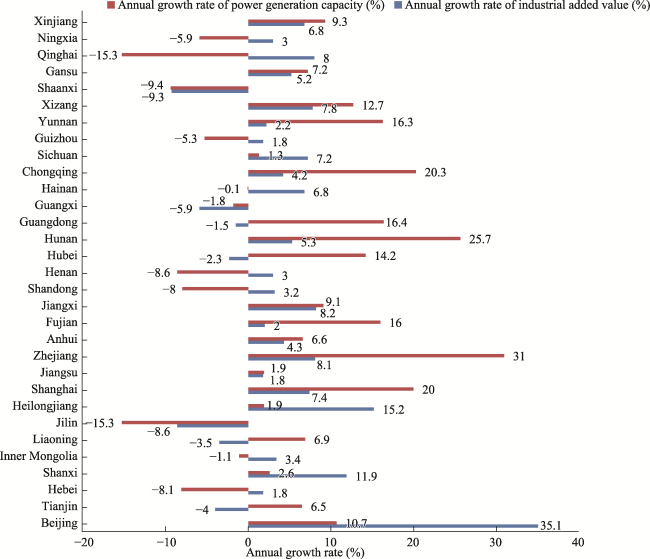
In recent years, the “power restriction” measures were taken in many localities, industrial electricity consumption was interrupted, mainly in the “two high” (high energy consumption and high pollutant emission) enterprises. Take the “power restriction” event in 2021 as an example, this event affected a wide range of regions and disrupted people’s livelihood. It not only refers to the power switch and rationing measures taken by individual regions, but also includes differentiated policies implemented by over 20 provinces to limit power supply and industrial production. This paper investigated in detail and summarized the different requirements of power restriction across the country, through the comparison of annual growth rates of power generation and industrial added value,the comparison results of energy intensity, electricity production, power consumption and the industrial growth rate in each province are analyzed. Industrial enterprises and related industrial chains were most heavily affected by the “power restriction” event,mainly in steel, cement, electrolytic aluminum, industrial silicon, textile printing and dyeing, chemical fiber, chemical and other enterprises with high energy consumption and high pollutants emission. The measures to limit electricity will affect the normal production of enterprises to a certain extent, leading to not only the decrease of production efficiency, but also the increase of energy consumption and pollutant emission per unit product. Energy management measures such as differentiated electricity price have limited effect on the output of “two high” industrial products, and the economic leverage of differentiated electricity price is gradually being diluted by the price rise of end products. This paper analyzed the reasons and explored several key problems that need special attention. then recommended certain countermeasures for its appropriate application in the future.

Cite this article

YANG Churui , ZHOU Xiaolin , LIU Zhu , WANG Yu’an . The Policy of Energy Saving, Pollution Control and Carbon Reduction based on the Cause Analysis of “Power Restriction” Event[J]. Journal of Resources and Ecology, 2024 , 15(4) : 889 -897 . DOI: 10.5814/j.issn.1674-764x.2024.04.010

1 Introduction

Since the middle and late Aug. 2021, a new wave of various power restriction has been staged in many localities, the restriction measures have various forms, orderly power consumption refers to power outages with prior notice and alternative plans, while power rationing involves direct power outages under emergency circumstances (Dai et al., 2021). The scope of power restriction was intended to apply to industries, but practice showed that it was extended to residents and non-industrial enterprises.
According to investigation, Guangdong, Jiangsu, Zhejiang and some other provinces adopted special measures such as orderly power consumption (Guo, 2021). In northeast China, electricity rationing was extended to residential use, which caused wide public controversy (Ge and An, 2020). This report investigated the policy requirements in detail and the reasons behind the power cut and limit in various regions (Jiang, 2011). On this basis, it analyzed several issues that deserve special attention before and after such “power restriction” events, and then recommended specific countermeasures (Han, 2022).
Under what circumstances could the power restriction measures be reasonably taken? The normal operating frequency of Chinese power grid is 50 Hertz, allowing the fluctuation within a certain range (He et al., 2022); But when the frequency of the grid is lower than 49.8 Hertz, it needs to activate the power limit, otherwise it will face the risk of a wider range of decommissioning accidents (Alastair et al., 2018). The most recent example was the widespread power outage in the afternoon of August 9th, 2019 in UK(① On August 9th, 2019, a large number of random outages of offshore wind and distributed photovoltaics in UK grid caused the system frequency to drop to 48.9 Hz, triggering the operation of low-frequency load reduction devices in the system, removing a large amount of power load and affecting 1 million electricity customers, including the city of London. When the power was cut off, the dispatching department of the power grid directly cut off the 10 kV voltage lines according to the preset switching sequence table; and 10 kV voltage grade lines normally provide access to residential power loads as well as industrial and commercial power loads. As a result, residents have to experience sudden power outages without prior notice.) (André and Lars, 2015; Moore, 2020).

2 Investigation into the requirements on the application of “power restriction”

The “power restriction” event in 2021 caused widespread influence (Rawlinson, 2022). it refers not only to the meas-ures taken in northeast China, but also includes the policies implemented by some other provinces to limit power use or even stop normal production (Wang et al., 2021). From mid-to-late August in Yunnan, Jiangsu and other provinces, to mid-September in Guangdong, Zhejiang and some other provinces, and finally at the end of September, the northeastern region adopted the widespread power cut-off. By the end of September, more than 20 provinces, autonomous regions and municipalities adopted measures to limit electricity use, suspend production or even pull power switches (Li, 2011; Ye, 2021), as shown in Table 1.
Table 1 Power restriction requirements formulated by different regions (incomplete statistics)
Number Region Related power restriction requirements
1 Tianjin In accordance with the principle of “limited demand response and minimum guarantee for orderly electricity use”, demand response and orderly electricity use were launched from Sept. 23 to 30, based on the actual power gap
2 Shanxi In accordance with the decision of the provincial Party Committee on Sept. 24, all municipalities were asked to organize high-energy-consuming enterprises to make full use of Shanxi spot market price signals and guide enterprises to proactively implement demand response during the night peak and avoid peak electricity consumption
3 Inner Mongolia A Report on Inner Mongolia Power Grid’s Orderly Power Consumption Decomposition Index in Aug. 2021 was released on Aug. 24, the proportion of orderly voltage limit load decomposition was adjusted in each city from August to December
4 Liaoning From Sept. 10 to 22, 6 rounds of Class III (load gap 5%-10%) and 3 rounds of Class IV (load gap 5% or less) were implemented. From Sept. 23 to 25, 3 rounds of Class II (load gap 10%-20%) orderly power consumption measures were taken. In individual or extreme periods when the highest off-peak power use reached 4.1692 million kW, a power supply gap in the grid occurred, 14 cities were implemented accident switching and power rationing in accordance with the “2021 Power Grid Accident Switching Sequence Table”. Starting from Sept. 29, the implementation of orderly power consumption was announced
5 Jilin From Sept.10, the orderly power use program was launched; On Sept. 23, the Northeast Power Grid took measures to cut power supply. On Sept. 24, orderly power use was adopted. On Sept. 29, the “Proposal on Orderly Electricity Consumption and Power Saving” was issued
6 Heilongjiang From Sept. 10 to 22, 13 times of orderly power consumption of grade Ⅲ (load gap 5%-10%) and grade Ⅳ (load gap 5% or less) were started; From Sept. 23, Class II (10%-20% load gap) orderly power consumption measures was initiated, while the Northeast power grid took power cutting measures; On Sept. 24, orderly power consumption measures were adopted
7 Shanghai A Notice on planned power outages was issued in September, with plans for routine overhaul and maintenance of power supply equipment to ensure power grid safety during peak hours
8 Jiangsu On Sept. 15, a notice was promulgated to the effect that the power limit order will be implemented in designated areas for 15 days tentatively: From Sept. 15 to September 30, industrial power supply would be cut, domestic electricity maintained, office air conditioning stopped, street lamp halved. On Sept. 16, the Initiative on “Electricity Saving helps Green Development” was issued to public
On Sept. 19, the “Double Control Plan on Energy Consumption Reduction” was released, requiring enterprises to limit production according to different levels
9 Zhejiang On Sept. 27, a “Notice on Launching the Plan of Orderly Power Consumption” was issued, the Class B plan of orderly power consumption was lunched from Sept. 28, curbing unreasonable demand for electricity
10 Anhui On Sept. 22, an “Emergency Notice on the Implementation of Orderly Electricity Use” was issued, initiating the plan for orderly electricity use across the province
11 Fujian Since Sept. 28, the government had started the orderly electricity use in a phased way. Such industrial users as those enterprises that would be eliminated or restricted and high-energy-consuming enterprises in accordance with the catalogue on industrial structure adjustment would receive electricity in an orderly way
12 Jiangxi On June 23, the “Notice on Further Improving the Time-segment Trading Mechanism of Electricity” was issued, proposing the trial implementation of the “benchmark ceiling price + floating mechanism” for time-segment trading of electricity from July to December
13 Shandong In September, the strictest measures would be taken to limit electricity consumption. According to the regulations of the state grid, the daily electricity consumption of the whole province would be limited to no more than 4 million kWh, and cities that failed to complete the distribution of electricity rationing measures would be shut power supply
14 Henan On Aug. 9, some aluminum processing enterprises were notified that large industrial enterprises would cut power supply by 50 percent, and all other industrial enterprises whose electricity consumption below 10000 kilovolts would suspend production, with power cuts expected for three weeks or more. All coal mines were required not to sell thermal coal to other provinces. In order to ensure the residential consumption of electricity, some enterprises and industrial users should stop production and strictly observe the order of electricity consumption
15 Hunan A safety orange alert was issued on Sept. 22 to keep the electricity load below 26 million kilowatts
16 Guangdong From Sept. 16, an orderly power consumption plan was launched, all industrial enterprises were required to avoid the electricity use peaks by “operation 3 days and suspension 4 days” or “operation 2 days and suspension 5 days” depending on the weekly electricity load. On Sept. 26, an Initiative for the Orderly Power Consumption and Power Saving was issued to all the local Power Users
17 Guangxi On Aug. 7, a notification was issued to all electrolytic aluminum enterprises, urging them to avoid or off-peak power consumption, in order to limit the total power load by enterprises
On Aug. 23, the Notice on Strengthening the Work of Conserving Electricity was issued. From Sept. 16, all electrolytic aluminum enterprises were required to further reduce their monthly electricity load by 35% in the whole period based upon the average monthly electricity load from January to June
18 Chongqing A “Urgent Notification on the Implementation of Orderly Power Consumption” was issued on Oct. 4, all high-energy-consuming enterprises and general industrial enterprises listed in Plan 5 attached to the Chongqing’s Plan for Orderly Power Consumption in the Wet Season 2021 were put under the orderly power consumption mechanism, so that the electricity supply to residents and public service facilities (schools, hospitals, public transportation stations, etc.) could be guaranteed from 11:00 to 21:00 on Oct. 5
19 Sichuan An initiative on saving electricity and advocating off-peak power consumption was issued on Aug 3. It called for the suspension of non-essential production, lighting and office loads
20 Guizhou The “Notice on the Plan of Orderly Electricity Consumption in 2021” was issued in early September, the power grid enterprises were required to give early warning according to the scale of power gap. On Sept. 10, according to the scale of the power gap, four levels of early warning were conducted, and the corresponding levels of response were activated
21 Yunnan On May 10, the “Notice on Further Expanding the Scale of Orderly Power Consumption in Yunnan Power Grid” was issued, special arrangements were made public: From May 10 to May 31, the big off-peak power consumption would not exceed 6 million kW; In the first 10 days of June, the big off-peak power consumption would be gradually reduced to no more than 4 million kW; In mid-June, it would be gradually reduced to no more than 2 million kW. By the end of June, the orderly power consumption would be suspended. On Sept. 11, production restrictions were imposed on steel, cement, yellow phosphorus, green aluminum, industrial silicon and coal power
22 Shaanxi From September to December, the newly completed “two high” projects shall not be put into production, and the newly built “two high” projects already in production this year shall limit production by 60 percent on the basis of last month’s output. Other “two high” enterprises shall implement measures such as reducing the operating load of production lines and stopping operation of mineral heat furnaces to limit production, so as to reduce the production by 50 percent in September
23 Qinghai On Aug 20, some electrolytic aluminum enterprises received early warning notice from State Grid Xining, reminding them to prepare for electricity use in an orderly way in advance
24 Ningxia On Aug. 18, a video meeting on dual-control work of energy consumption in the region was held, requiring all parties strengthen analysis and early warning. On Sept. 29, the Development and Reform Commission of the Autonomous Region issued the Notice on Further Improving the Off-peak Power Consumption in Key Enterprises, requiring establishing the mechanism of off-peak power consumption, and conducting statistics of off-peak power consumption in enterprises
25 Xinjiang On Aug. 25, Changji Prefecture Development and Reform Commission issued a Reminder Letter on strict management and control of electrolytic aluminum production capacity. According to production compliance requirements, since August, the total monthly output of five electrolytic aluminum enterprises in the prefecture shall not exceed 238000 t
The affected regions can be classified into 3 categories: The relatively developed provinces in the east (such as Zhejiang and Jiangsu), the less developed regions where the power demand is not stronger but the installed power gener-ation capacity is adequate (such as the three provinces in northeast China) (Xue et al., 2013; Wang, 2021b), and the areas such as Yunnan Province, which has unique advantages in hydropower resources.
The restriction measures vary from region to region. In northeast China, after the implementation of orderly power consumption for non-residents use (Lu and Jia, 2021), there was a risk of power grid collapse due to power shortage, so further measures were taken to limit power supply. In other provinces, industrial power consumption was restricted mainly in steel, electrolytic aluminum, industrial silicon, textile printing and dyeing, chemical fiber, chemical and other enterprises with high energy consumption and high pollutants emission (Makhotilo et al., 2019). Guangdong, Jiangsu, Fujian, Sichuan, Jilin and other provinces also urged the general public to save electricity (Su, 2021). In addition, some provinces including Shanxi and Guizhou, did not specify the requirements for power restriction, but in September high energy consuming enterprises were asked to proactively implement demand response during peak periods and avoid peak consumption (Björn et al., 2019).
This “power restriction” event aroused wide attention and caused multiple effects. According to Baidu’s index, the search index for “power cut” peaked on Sept. 27 (with a search index of 32021).
Industrial enterprises and related industrial chains were most heavily affected by the “power restriction” event (Alcasena et al., 2021). Some safety accidents occurred due to the power restriction (Yue, 2021). In a steel plant in Liaoning, the furnace gas leaked due to the sudden power cutting, resulting in 23 worker’s poisoning. Local residents’ lives were seriously disrupted (Guo et al., 2021a; Guo et al., 2021b). In northeast China in particular, there were many online reports complaining cooking without power, family members trapped in elevators (Li, 2020), no cell phone signal, traffic lights out of service, shops business by candle, shopping malls close early, water utilities unable to supply water normally, flood warning software malfunctioning.

3 Analysis of the reasons behind the measures of power restriction

Objective analysis of the reasons for over 20 provinces to restrict electricity would help guide all localities to promote pollution control and carbon reduction in an orderly way, as well as coordinate energy security, stability of industrial chain and supply chain (Tang et al., 2021).
From the national level, this large scale “power restriction” is different from “power shortage” caused by insufficient installed generation capacity in the past (Wolf and Wenzel, 2015). Observed from the facial phenomenon, the power restriction can be classified into different situations, such as the high energy consuming industry-induced power restriction, the climate-induced power restriction, the power grid risk prevention-induced restriction (Guan and Xue, 2021). Based on the practice of various regions, the reasons can be roughly divided into 5 factors.

3.1 Pressure from the “Dual Control” targets on energy consumption is the direct factor

The central government of China introduced the “Dual Control” targets on energy consumption of both the total load and the intensity. In the first half of 2021, Zhejiang, Guangdong, Jiangsu, Shaanxi, Xinjiang, Fujian, Guangxi, Qinghai and Ningxia were given the First-level Warning by the central authority for the slow progress in the annual “Dual Control” targets. Anhui, Jiangxi, Henan and Yunnan were given the Second-level Warning (Zhou, 2021). Failure to active the annual targets would lead to severe accountability against local officials (Gao and Li, 2020).
In practice, statistics from power sector showed that the annual growth rate of power generation in September was significantly higher than that of the industrial added value (Du and Zhou, 2021). In other words, the power supply can roughly meet the demand from industries (Zhu, 2018). Under this background, the main reason for the power restriction was not power shortage, it was the pressure for meeting the strict “dual-control” target of energy consumption by the end of the year (Zhu, 2018). The special pressure forced localities to took measures to limit power supply and production in specific industries (He et al., 2021).

3.2 The price gap between coal and the coal-fired power is the economic factor

The demand for coal for power generation and the supply of coal reached new high in 2020 (Fig. 1). The coal price was soaring while the electricity price was under stringent State control, so most of the thermal power plants suffered heavy losses, resulting in insufficient electricity output (Lin et al., 2021; Khan et al., 2022). Influenced by such factors as the overcapacity reduction policy in coal sector started 2016, the intensification of coal-related anti-corruption, safety supervision and environmental protection in Inner Mongolia from 2020 to 2021, as well as the punishment on overcapacity production, a large volume of coal production capacity was reduced (Wang, 2021a). For example, from January to Sept. 2021, the raw coal production in the three northeastern provinces and Shandong declined by 14.4% and 17.5% respectively compared with that in 2016, coal import was also greatly restricted (Liu et al., 2020).
Fig. 1 Self-sufficiency rate, power generation and power consumption in 2020
These factors resulted in the coal stock reaching a record low, meanwhile the thermal coal prices kept rising from around 600 yuan t-1 at the beginning of the year and it increased all the year to a record high at 1600 yuan t-1. As the logic result, the profit of thermal power plants continued to decline or suffered losses (Liu et al., 2019; Yuan and Li, 2015), the utilization hours of the generation capacity remained at a low level, causing a huge gap of power generation.

3.3 The recovery of economy during the covid-19 crisis is the objective factor

The periodic industrial recovery during the epidemic led to the rise of demand for the energy consumption. Investigations show that the industrial added value in Heilongjiang, Shanxi and Qinghai increased by 15.2%, 11.9% and 8% respectively in September, reaching the highest points since the outbreak of the epidemic. Ningxia, Guizhou, Henan and Sichuan also showed that the industrial growth rate was higher than that of electricity production. However, the cumulative growth rate of electricity production was lower than that of industrial added value (Kumar et al., 2021). The rapid industrial growth and shortage of power supply in these provinces together forced them to adopt the orderly power consumption or power rationing measures (Fig. 2).
Fig. 2 Annual growth rates of power generation and industrial added value in September 2021

3.4 The large percentage of “two high” industries is the fundamental factor

Statistics showed that the “two high” (high energy consumption and high pollutant emission) industries amount to very high percentage in various regions, they consumed large volume of energy and emitted most of the pollutants. Based on the energy endowment in Shaanxi, Xinjiang, Fujian, Guangxi, the energy intensity in the first half of 2021 increased remarkably instead of going down. It’s reported some backward enterprises resumed production, many factories went into production at full capacity, the control on “two high” project was weak. In Yunnan, Jiangxi, Anhui, the annual growth of power generation was considerable, but because of the huge demand from the “two high” industries, the electricity still showed the trend of supply shortage, the localities had to introduce power restriction.

3.5 The failure of renewable energy to fill in the gap of coal-fired power shortage is the structural factor

The renewable energy such as wind, photovoltaic power is unstable, and energy storage technology is still a short slab. Both hydro and wind power generation in Qinghai declined 2.9% instead of rising, wind power generation in Yunnan decreased either. In recent years, the proportion of thermal power continues to decline, wind, solar and other renewable energy continues to grow, but in the absence of sufficient energy storage technology, it brings challenges to the stability of the entire power system. For example, due to the effect of climate in September, the wind power generation decreased by 16.4% in the three provinces in northeast China, the growth rate of wind power generation in Inner Mongolia also slowed down significantly. Nevertheless, the thermal electricity failed to provide the necessary power supply in a timely way. So the industrial power consumption had to be restricted so as to ensure the residential electricity demand.

4 Several key issues deserving special attention

4.1 Resumption of coal production capacity and energy conservation, pollution control and carbon reduction in a coordinated way

At present, China’s photovoltaic, wind power and nuclear power account for a limited proportion, as the leading renewable energy, hydropower is confronted with the low water in the drought period. The reliable solution in the foreseeable future is the thermal power and the coal. While eliminating the polluting coal mines, the State has made a series of arrangements for increasing coal production and ensuring supply. China has optimized the layout of advanced coal production capacity, and promoted the green and high-quality development of five major coal production bases—Shanxi province, western Inner Mongolia, eastern Inner Mongolia, northern Shaanxi and Xinjiang. For example, in July, Inner Mongolia approved land use procedures for 38 open-pit coal mines in Erdos City, the production capacity is 66.7 million t yr-1, and all of them have resumed production. At the same time, coal prices are expected to fall faster, which is very likely to trigger a rebound in coal consumption, which will affect energy conservation and carbon reduction in the thermal power sector and related coal consuming industries. In promoting the resumption of coal production capacity, and in the process of energy conservation, pollution control and carbon reduction, how to make overall consideration has become a key difficulty for the concerned departments.

4.2 Uninterrupted electricity supply and the pursuit of energy saving, pollution control and carbon reduction in a well-planned way

The “One-size-fits-all” approach appears to be effective in short term, its side effects decided that it can’t sustain. The measures to limit electricity will affect the normal production of enterprises to a certain extent, leading to not only the decrease of production efficiency, but also the increase of energy consumption and pollutant emission per unit product. Because enterprises may use emergency power supply, including diesel power generation. Practice showed the emergency power supply tends to have higher energy consumption and lower pollution control efficiency. For the public, they will find other ways to ease the inconvenience. For example, during the power cut, the production of candles and matches was increasing. A candle seller in Jinhua, Zhejiang Province, said, “Our orders for lighting candles have increased by 10 times.”

4.3 Environmental management to promote pollution control and carbon reduction in a scientific way

According to statistics, China ranks first in the world in terms of output of more than 220 kinds of major industrial products, making it the “factory of the world”. However, some of the products are still in the middle and low end of the global industrial chain and value chain, and its dependence on coal and other fossil fuels is too high. From January to Aug. 2023, China’s output of downstream steel products such as metal containers increased by 170.2%, and domestic shipyards’ orders for new ships increased by 227.2%. Economic recovery at home and abroad is strong, and industrial demand for energy remains high. On the one hand, energy management measures such as differentiated electricity price have limited effect on the output of “two high” industrial products, and the economic leverage of differentiated electricity price is gradually being diluted by the price rise of end products. On the other hand, the tension between supply and demand in the coal market tends to be eased, and the coal burning in the power industry has rebounded. For example, Northeast Electric Power Co., Ltd. of the State Power Investment Group said the available days of coal stock are more than 2 weeks, the operation rate of thermal power units is more than 90%. At the same time, entering the late October, combined with static stability of atmosphere, high humidity, temperature inversion and other adverse meteorological conditions, the air pollution in key regions is not optimistic. For example, since October 21, the central and eastern regions have experienced wide range PM2.5 pollution for the first time since the beginning of autumn this year. How to further optimize the means of environmental management, while promoting the industrial recovery and restraining the output growth of the “two high” industries shall be studied, so as to reduce pollution and carbon emission, needs special attention.

4.4 Suitable path for new energy development in an environmentally friendly way

Taking into account the “dual carbon” target, it’s particularly important to develop nuclear energy as well as renewable energy such as wind, photovoltaic and water power, which also highlights the importance of exploring a pathway for new energy development which is suitable for China’s conditions and environmentally friendly. For a long time, the environmental assessment and remediation plans of China’s wind power and other renewable energy projects have been dominated by local governments. The projects are segmented, lack long term and systematic planning, and the attention paid to the ecological environment is insufficient. For example, during the construction period, wind power projects have a certain impact on surface vegetation, soil environment, animal activity range, migration route and habitat. The development of nuclear power is no exception. In recent years, a number of serious Marine organisms have invaded the cooling water intakes in some nuclear power plants, such as jellyfish invasion at Hongyan River nuclear Power Plant, shrimp invasion at Lingao Plant, sea cucumber invasion at Ningde Plant, phaeocystis invasion at Fangchenggang Plant. The harmonious development between new energy and natural ecology has become indispensable. So enough attention should be paid to the ecological environment in the development of new energy.

5 Recommendations on the appropriate application of power restriction

The power restriction event in 2021 affected a wide range of areas and people’s livelihood. The State attached great importance to it and repeatedly instructed that various factors related to power restriction should be considered as a whole, and relevant policies and measures should be adjusted in time and improved to ensure public’s normal life and the stable operation of the economy. Based on the analysis of the requirements on power restriction in various regions and the reasons behind, the following suggestions are recommended for its possible application in the future.

5.1 Push the work of the carbon peaking and carbon neutrality in a systematical manner

The implementation of the “double carbon” goal is based on the reality that China’s coal-based energy structure will not change in short term. It is intended to promote economic and social transformation and upgrading. Therefore a series of actions must be taken: First, a comprehensive review of the current relevant environmental systems which were formulated before the announcement of the “double carbon” goal in 2020, in order to identify and rectify the stipulations and practice that do not fit the goal; Second, taking into full account the “La Nina Phenomenon” and other extreme climate events, as well as the seasonal characteristics of renewable energy power generation and its impacts on the production in some industries, before the annual reduction targets on carbon emission intensity is set. Third, strictly control new coal-fired power projects and phase out outdated coal-fired power production capacity as planned, push key coal consuming industries to reduce coal use, and speed up energy conservation and flexibility upgrading of existing coal-fired power units. Fourth, in addition to industrial use, expand the scope of treatment on bulk coal use from industries to service and agricultural sectors, gradually reduce until the prohibition of bulk coal burning; Fifth, speed up technological innovation for the clean and efficient coal combustion, and constantly improve the utilization level of coal resources.

5.2 Assess the overall effects of power restriction on energy conservation, pollution control and carbon reduction in an objective way

Theoretically, the measures of power restriction can reduce power consumption and thus achieve the goal of energy conservation and emission reduction. The practice demonstrated there is great uncertainty about whether the expected effect of energy conservation and emission reduction can be achieved sustainably. So it’s suggested to clarify the actual level of energy consumption during the implementation of power restriction, investigate whether enterprises use self-provided power supply and other alternative methods including diesel power generation, identify whether the output of non-targeted industrial products increases significantly and whether the related pollutants emission rises accordingly. On this basis, the evaluation on the effect of energy saving and carbon reduction brought by the measures of power restriction can be conducted scientifically, so as to avoid the unreasonable situation where the actual effect of energy saving and carbon reduction is not as expected, but the economic and social cost is too high.

5.3 Optimize management to promote pollution control and carbon reduction through a comprehensive approach

First, the environmental impact assessment should be extended. For new, rebuilt and expanded projects with high energy consumption and high emissions, the impact from carbon emission should be incorporated into the environmental assessment. Second, the carbon intensity assessment and early warning mechanism should be introduced. Since the “dual carbon” goal has become a national strategy, the assessment indicators and corresponding management methods for control of total carbon emissions shall apply to the “two high” industries. Attention should be paid to the quarterly changes in carbon intensity in various regions and key industries, the prediction and early warning of carbon emission shall be established.
The energy administration should coordinate efforts of various players to guarantee uninterrupted power supply during peak consumption, the specific measures for key regions, critical timeframes, and crucial aspects of natural gas supply, along with corresponding work requirements shall be outlined. Third, the accountability shall be strict. Once the reasonable target is set, inspections and enforcement shall follow to ensure the compliance, and the illegal projects shall be investigated and punished. Fourth, the unified carbon emission trading market shall be established. As the necessary supplement to carbon regulation, the market mechanism shall be given full play.

5.4 Promote the development of new energy and environment protection in a coordinated way

Over the past decade, the ever-evolving and expanding energy supply system has rapidly shifted toward green, low-carbon alternatives. The comprehensive development of energy resources such as coal and renewable energy shall be pursued in harmony with the environment. In this process, certain environmental baselines shall be upheld. First, to evaluate systematically the status of the development and utilization of wind, photovoltaic, hydropower and other renewable energy resources, in order to identify the environmental problems and the responsible units, then supervise the rectification. Second, to comply strictly with the “Ecological Red Line” for all kinds of renewable energy projects, and investigate and punish environmental violations of energy projects in accordance with the law. Thirdly, to improve the environmental assessment methodology for renewable energy projects and promote its application. Fourth, to pay due attention to marine organisms especially the alien species for the safety of nuclear power plants.
[1]
Alastair H, Dan E, Ken M, et al. 2018. Power rationing in a long-term power shortage. Energy Policy, 121: 202-210.

[2]
Alcasena F, Rodrigues M, Gelabert P, et al. 2021. Fostering carbon credits to finance wildfire risk reduction forest management in mediterranean landscapes. Land, 10(10): 1104-1104.

[3]
André W, Lars W. 2015. Welfare implications of power rationing: An application to Germany. Energy, 84: 53-62.

[4]
Björn C, Anna D, Svante M, et al. 2019. EU ETS emissions under the cancellation mechanism-effects of national measures. Energy Policy, 129: 816-825.

[5]
Dai X H, Zhu H, Wu T. 2021. Power cuts in many places? Whether the subsequent power supply can be guaranteed? Xinhua Daily Telegraph, 2021-09-29 ( 005). (in Chinese)

[6]
Du M Y, Zhou Y N. 2021. How to look at the “power cut”. Zhongguancun, (10): 26-27. (in Chinese)

[7]
Gao G, Li Z C. 2020. “Power out” time. The Economic Observer, 2020-12-21 (001). (in Chinese)

[8]
Ge L T, An N. 2020. From uninterrupted power rationing to an energy Internet. North China Power, (11): 49-51. (in Chinese)

[9]
Guan X P, Xue P. 2021. Power rationing highlights the urgency of upgrading industrial structure. China Discipline Inspection and Supervision News, 2021-09-29 (004). (in Chinese)

[10]
Guo L Q, Liang C, Zocca A, et al. 2021a. Line failure localization of power networks part I: Non-cut outages. IEEE Transactions on Power Systems, 36(5): 4140-4151.

[11]
Guo L Q, Liang C, Zocca A, et al. 2021b. Line failure localization of power networks part II: Cut set outages. IEEE Transactions on Power Systems, 36(5): 4152-4160.

[12]
Guo Y F. 2021. Northeast China needs to use more forward-looking and market-oriented means to ensure electricity consumption for people’s livelihood. 21st Century Business Herald, 2021-09-28 (003). (in Chinese)

[13]
Han H P. 2022. Research on the carbon peak and carbon neutralization model in colleges and universities: Taking China University of Geosciences (Beijing) as an example. Journal of Contemporary Educational Research, 6(12): 30-37.

[14]
He Y X, Liu P L, Zhou L, et al. 2021. Competitive model of pumped storage power plants participating in electricity spot market, in case of China. Renewable Energy, 173: 164-176.

[15]
He Y X, Liu Y, Li M X, et al. 2022. Benefit evaluation and mechanism design of pumped storage plants under the background of power market reform--A case study of China. Renewable Energy, 191: 796-806.

[16]
Jiang L. 2011. The action logic behind the phenomenon of power rationing —On the right path choice of energy saving and emission reduction. Administrative Tribune, 18(6): 82-85. (in Chinese)

[17]
Khan S A, Mir N, Kul A, et al. 2022. Renewable energy for carbon footprint reduction of green geopolymers material’s production for built-environment. Energy Reports, 8(13): 852-858.

[18]
Kumar K, Saraswat S, Jindal S K, et al. 2021. Experimental validation of an IoT based device selective power cut mechanism using power line carrier communication for smart management of electricity. Journal of Electrical Engineering & Technology, 16(1): 67-77.

[19]
Li H. 2020. The power cut ends, light up the capital with sweat. North China Power, (11): 46-48. (in Chinese)

[20]
Li W. 2011. 17 provinces may face a new round of power cuts. South Reviews, (24): 72-73. (in Chinese)

[21]
Lin R, Ren Z, Liu Y P. 2021. Many economies face a new problem: shortages. Global Times, 2021-09-28 (001). (in Chinese)

[22]
Liu C J, Ma C B, Xie R, et al. 2020. Structural, innovation and efficiency effects of environmental regulation: Evidence from China’s carbon emissions trading pilot. Environmental and Resource Economics, 75(4): 1-28.

[23]
Liu L, Xu S, Cui L Z, et al. 2019. Power rationing for tradeoff between energy consumption and profit in multimedia heterogeneous networks. IEEE Journal on Selected Areas in Communications, 37(7): 1642-1655.

[24]
Lu J X, Jia M. 2021. After the power rationing, enterprises should be more firm on the road of low-carbon transformation. National Business Daily, 2021-09-29(002). DOI: 10.28571/n.cnki.nmrjj.2021.003562. (in Chinese)

[25]
Makhotilo K, Chervonenko I, Saad E M A H, et al. 2019. Development of a renewable hybrid power plant with extended utilization of pumped storage unit equipment. Eastern-European Journal of Enterprise Technologies, 2(898): 30-37.

[26]
Moore S K. 2020. Chiplets are the future of processors: Three advances boost performance, cut costs, and save power. IEEE Spectrum, 57(5): 11-12.

[27]
Rawlinson N. 2022. Use less power and cut your bills. Computer Active, 631: 60-61.

[28]
Su S X. 2021. The “pot” of power rationing should not be backed by “dual control of energy consumption”. National Business Daily, 2021-09-28 (006). DOI: 10.28571/n.cnki.nmrjj.2021.003551. (in Chinese)

[29]
Tang K, Zhou Y, Liang X Y, et al. 2021. The effectiveness and heterogeneity of carbon emissions trading scheme in China. Environmental Science and Pollution Research, 28(14): 17306-17318.

[30]
Wang H, Wang L Q, Duan C. 2021. Several key issues behind power rationing. Economic Data Translation, (1): 54-64. (in Chinese)

[31]
Wang W Y. 2021a. Power rationing in many places is a concern, All parties actively respond to ensure people’s livelihood electricity. Shanghai Securities News, 2021-09-28 (001). DOI: 10.28719/n.cnki.nshzj.2021.004475. (in Chinese)

[32]
Wang Y C. 2021b. Flexible adjustment of summer peak electricity consumption. Economic Daily, 2021-07-21 (008). DOI: 10.28425/n.cnki.njjrb.2021.005406. (in Chinese)

[33]
Wolf A, Wenzel L. 2015. Welfare implications of power rationing: An application to Germany. Energy, 84: 53-62.

[34]
Xue S, Hong Y, Chen X. 2013. The nature of equity ownership, political relations and power rationing by local governments: Empirical evidence from the non-ferrous metals industry. Finance Research, (3): 130-142. (in Chinese)

[35]
Ye C. 2021. From the perspective of power supply and demand, power rationing will be implemented in 2021. China Power Enterprise Management, (25): 40-44. (in Chinese)

[36]
Yuan K H, Li H J. 2015. Official characteristics, incentive mismatch and government regulation behavior distortion: An empirical analysis of power rationing in Chinese cities. Public Administration Review, 8(6): 59-82, 186-187. (in Chinese)

[37]
Yue H. 2021. “Power cut”: Old disease or new disease? China Power Enterprise Management, (28): 34-36. (in Chinese)

[38]
Zhou X S. 2021. Power rationing poses a challenge to the stable price and supply of relevant industries. China Economic Times, 2021-09-29 (002). DOI: 10.28427/n.cnki.njjsb.2021.002175. (in Chinese)

[39]
Zhu L. 2018. Research on local government-to-government relations in government performance appraisal—Based on the analysis of a county’s “power rationing” event. Economic and Trade Practice, (5): 40-41. (in Chinese)

[40]
Zu Q W. 2012. An analysis of local government’s policy implementation behavior: Taking “power rationing” as an example. Journal of Xian Jiaotong University (Social Science Edition), 32(2): 40-46. (in Chinese)

Outlines

/