
Journal of Resources and Ecology >
Patterns, Causes and Perceptions of Human-Large Carnivore Conflict in the Chitwan National Park, Nepal
|
Parwati TIWARI, E-mail: parwatitiwari94@gmail.com |
Received date: 2023-04-22
Accepted date: 2023-12-29
Online published: 2024-07-25
One of the major management problems in and around protected areas is the intensifying conflict between local people and wildlife, especially large carnivores. Livestock depredation and human fatalities caused by attacks of carnivores are found to be serious obstacles in conflict management. This study aims to explore the patterns, costs, causes and perceptions of human large carnivore conflict in the Nawalpur area of Chitwan National Park. The patterns of livestock loss and human casualties due to large carnivores (Panthera tigris and Panthera pardus) were analysed using the secondary data reported to Chitwan National Park from 2001 to 2019. To understand the people’s perception towards carnivores and wildlife conservation, 150 victim respondents were asked, with one household selected from each grid. During 19-year study period, a total of 521 incidents caused by large carnivores were reported, which included 33 human casualties and 488 livestock depredations. Tiger was responsible for the maximum conflict incidents in Nawalpur. The total relief provided for human deaths and injuries was US\$17524.41, whereas US\$13702.18 was used to compensate for livestock depredation in the Nawalpur area by authorities of the Chitwan National Park. More than 64% of the respondents liked the presence of carnivores in their area and had a positive attitude toward the conservation of large carnivores, even though the carnivores were responsible for livestock depredation and human injury and death. People’s satisfaction with the relief scheme provided by the government depended on ethnicity, gender, age class, occupation, education, insurance, and livestock ownership, but they believed the scheme was not effective. Hence, an effective relief scheme and awareness about the process of relief funding should be conducted in conflict areas. Conducting awareness programs for local communities about large carnivores, their behavior, and preparing predator-proof corrals would be helpful in minimizing conflict in the study area.
Key words: depredation; human wildlife conflict; leopard; tiger; relief fund
Parwati TIWARI , Bishnu Prasad BHATTARAI , Jagan Nath ADHIKARI , Binod BHATTARAI . Patterns, Causes and Perceptions of Human-Large Carnivore Conflict in the Chitwan National Park, Nepal[J]. Journal of Resources and Ecology, 2024 , 15(4) : 838 -849 . DOI: 10.5814/j.issn.1674-764x.2024.04.005
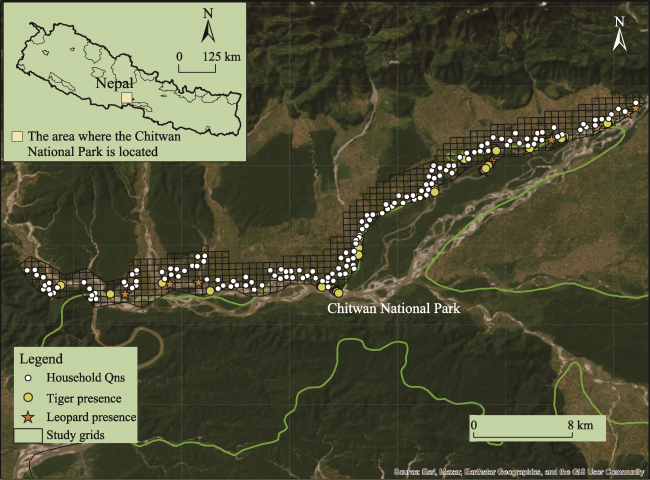
Fig. 1 Map of study area showing sampling locations for questionnaire survey along with tiger and leopard presence locations |
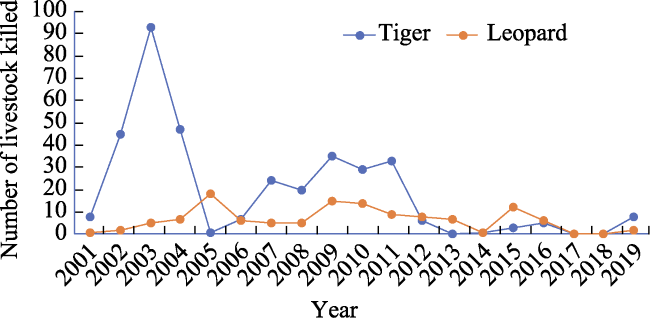
Fig. 2 Livestock depredation during 19-year period in the buffer zones of Nawalpur |
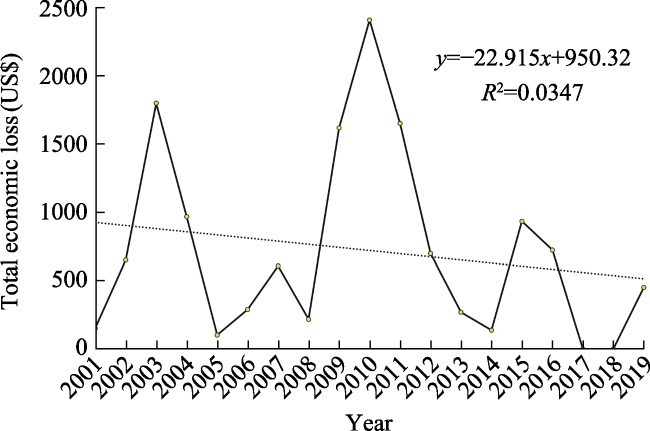
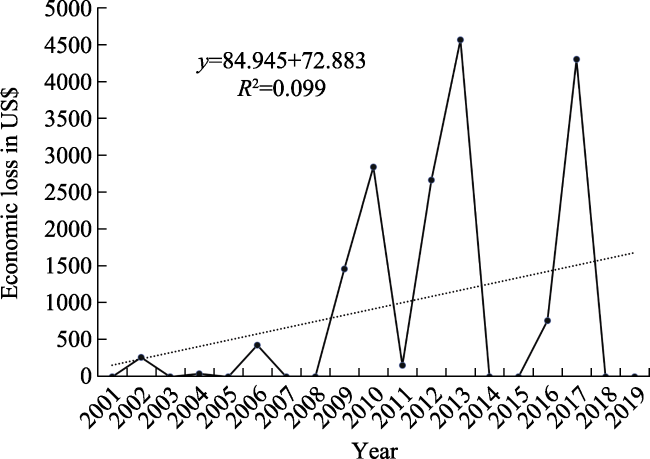
Fig. 3 Total economic loss from livestock depredation between 2001 to 2019 |
Table 1 Generalized linear model with binomial distribution and logit function showing livestock selectivity of tiger and leopard in buffer zones of Nawalpur |
| Item | Estimate | Z-value | P-value |
|---|---|---|---|
| Tiger | |||
| Goat/Sheep | 0.5032 | 1.449 | 0.1473 |
| Pig | -1.0133 | -1.784 | 0.0745 |
| Cattle/Buffalo | 4.4664 | 6.878 | <0.0001 * |
| Leopard | |||
| Goat/Sheep | 1.6594 | 6.654 | <0.0001 * |
| Pig | 3.8747 | 8.549 | <0.0001 * |
Note: ‘*’ means P<0.001. |
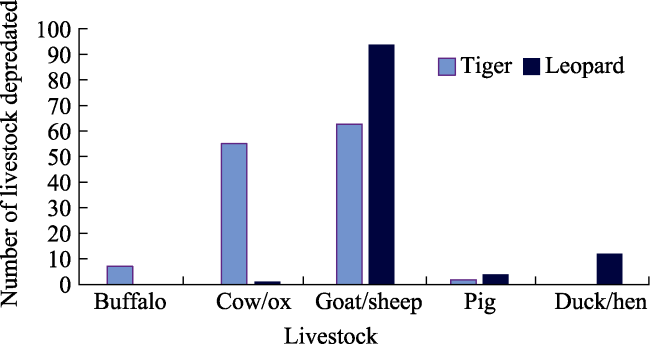
Fig. 4 Number of different livestock depredated by tiger and leopard in the study area on 2020 |
Table 2 Estimated economic loss in US\$ from livestock depredation by large carnivores |
| Livestock | Number of killed | Farm get price | Total loss |
|---|---|---|---|
| Buffalo | 7 | 862.07 | 6034.483 |
| Cow/Ox | 56 | 431.03 | 24137.93 |
| Goat/Sheep | 157 | 86.21 | 13534.48 |
| Pig | 6 | 86.21 | 517.2414 |
| Hen/Duck | 12 | 8.62 | 103.4483 |
| Total | 238 | 44327.59 | |
| Per HH | 1.5867 | 295.5172 |
Note: exchange rate: 1 US\$= NRs 116; HH= Household. |
Fig. 5 Loss from large carnivores over years, Number of human deaths and injury between 2001-2019 |
Table 3 People’s perception towards large carnivores |
| Questions | Education | Age | Occupation |
|---|---|---|---|
| Wildlife have right to live in forest | χ2=13.67, P=0.032 | χ2=16.48, P=0.011 | χ2=2.76, P=0.83 |
| Large carnivores attract tourist and bring revenue to park | χ2=13.7, P=0.032 | χ2=12.82, P=0.04 | χ2=9.18, P=0.16 |
| Participation in the buffer zone management program | χ2=32.31, P<0.0001 | χ2=10.14, P=0.11 | χ2=22.58, P=0.0009 |
| In case of severe conflict, problem animal should be terminated | χ2=13.5, P=0.035 | χ2=31.75, P<0.0001 | χ2=12.46, P=0.052 |
| Tiger and leopard population should be increased in future | χ2=14.62 P=0.024 | χ2=16.99, P=0.0093 | χ2=14.05, P=0.02 |
| Government relief for loss done by large carnivores is helping victims | χ 2=16.38, P=0.012 | χ2=12.95, P=0.04 | χ2=19.14, P=0.003 |
| Mitigation measure for conflict is adequate | χ2=12.8, df=6, P=0.046 | χ2=30.9, df=6, P<0.0001 | χ2=15.86, df=6, P=0.014 |
Table 4 Generalized linear models to identify the factors related to the people’s satisfaction about the relief scheme provided by the government |
| Covariates | Intercept | Ethnicity | Insurance | Livestock | Gender | K | AICc | ∆AICc | Wi |
|---|---|---|---|---|---|---|---|---|---|
| Ethnicity +Insurance | 1.07 | -0.352 | 17.08 | 3 | 191.4 | 0.00 | 0.062 | ||
| Insurance | 0.4 | 17.09 | 2 | 191.8 | 0.39 | 0.051 | |||
| Ethnicity+Insurance+No of Livestock | 1.425 | -0.424 | 17.14 | 4 | 192.0 | 0.65 | 0.045 | ||
| Ethnicity+Insurance+Gender | 0.972 | -0.360 | 17.14 | -0.043 | 0.269 | 4 | 192.9 | 1.54 | 0.029 |
| Ethnicity+Insurance+Livestock Number+ Gender | 1.345 | -0.445 | 17.22 | -0.049 | 0.359 | 4 | 193.2 | 1.81 | 0.025 |
| Education+Ethnicity+Insurance | -0.199 | -0.344 | -0.344 | 193.2 | 1.82 | 0.025 |
Note: People’s satisfaction was used as the dependent variable. The covariates used were ethnicity, gender, age class, occupation, family size, no of livestock owned, insurance and education. K is the number of parameters and, ∆AICc is the difference between the AICc value of the best supported model and successive models, and Wi is the Akaike model weight |
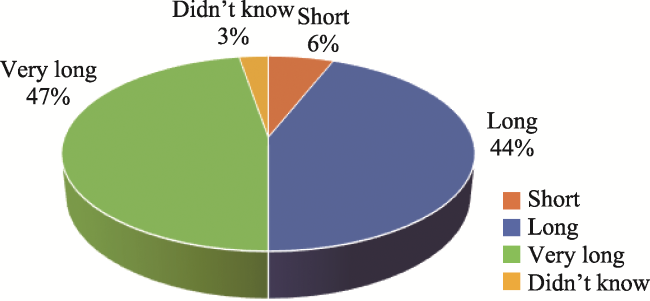
Fig. 6 Perception of respondent on duration of relief distributed |
Table 5 Model-averaged parameter estimates at 95% confidence level describing the satisfaction of local people about the relief scheme for HLCC in Chitwan National Park. |
| Coefficients | Estimate | Std. Error | t value | P (>|t|) |
|---|---|---|---|---|
| Intercept | 0.97 | 0.232 | 4.175 | 0.0000052 |
| Gender | 0.096 | 0.092 | 1.046 | 0.297 |
| Ethnicity | -0.1 | 0.053 | -1.86 | 0.065 |
| Age class | 0.049 | 0.137 | 0.358 | 0.72 |
| Age | -0.003 | 0.006 | -0.501 | 0.617 |
| Occupation | -0.024 | 0.094 | -0.255 | 0.798 |
| Family size | 0.001 | 0.015 | 0.112 | 0.911 |
| Livestock number | -0.011 | 0.008 | -1.294 | 0.197 |
| Insurance | 0.4 | 0.171 | 2.434 | 0.016 |
| Education | -0.07 | 0.1 | -0.709 | 0.479 |
| Feeding place | -0.0008 | 0.001 | -0.904 | 0.367 |
Note: Significant effects are in bold fonts |
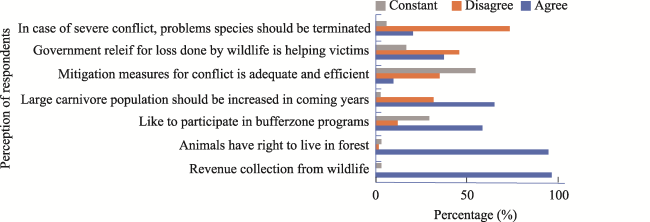
Fig. 7 Perception of peoples towards large carnivores and conflict |
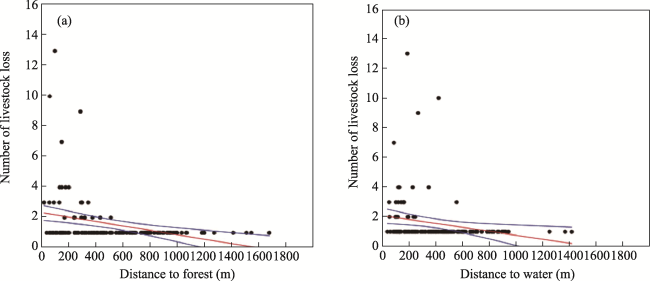
Fig. 8 Relation between the livestock loss and distance to forest (a) and distance to water sources (b) |
| [1] |
|
| [2] |
|
| [3] |
|
| [4] |
|
| [5] |
|
| [6] |
|
| [7] |
|
| [8] |
|
| [9] |
|
| [10] |
|
| [11] |
|
| [12] |
DNPWC. 2022. Protected Areas of Nepal. Department of National Parks and Wildlife Conservation, Nepal. Kathmandu, Nepal: DNPWC.
|
| [13] |
DNPWC Department of National Park and Wildlife Conservation, DFSC Department of Forests and Soil Conservation. 2022. Status of tigers and prey in Nepal 2022. Kathmandu, Nepal: Ministry of Forests and Environment.
|
| [14] |
|
| [15] |
|
| [16] |
|
| [17] |
|
| [18] |
|
| [19] |
|
| [20] |
|
| [21] |
|
| [22] |
|
| [23] |
|
| [24] |
|
| [25] |
|
| [26] |
|
| [27] |
|
| [28] |
|
| [29] |
|
| [30] |
|
| [31] |
|
| [32] |
|
| [33] |
|
| [34] |
|
| [35] |
|
| [36] |
|
| [37] |
|
| [38] |
|
| [39] |
|
| [40] |
|
| [41] |
|
| [42] |
|
| [43] |
|
| [44] |
|
/
| 〈 |
|
〉 |