Tourism Resources and Its Integration with Cultural and Creative Industries

The Spatial Differences and Influencing Factors of Tourism Resources in Ningxia, China

  • ZHANG Shengrui , 1 ,
  • CHI Lei 1 ,
  • ZHU He 2 ,
  • ZHANG Tongyan , 1, * ,
  • JU Hongrun 3
Expand
  • 1. Management College, Ocean University of China, Qingdao, Shandong 266100, China
  • 2. Institute of Geographic Sciences and Natural Resources Research, Chinese Academy of Sciences, Beijing 100101, China
  • 3. School of Tourism and Geography Science, Qingdao University, Qingdao, Shandong 266071, China
* ZHANG Tongyan, E-mail:

ZHANG Shengrui, E-mail:

Received date: 2023-11-07

  Accepted date: 2024-02-06

  Online published: 2024-07-25

Supported by

The Natural Science Foundation of Shandong Province(ZR2020QD008)

The Natural Science Foundation of Shandong Province(ZR2022QD132)

The Fundamental Research Funds for the Central Universities(202213002)

The Rural Revitalization Project of Ocean University of China(ZX2024007)

Abstract

The analysis of the spatial distribution of tourism resources and the identification of its influencing factors are crucial for supporting the sustainable development of regional tourism. This study established a comprehensive database of tourism resources in Ningxia Hui Autonomous Region (Ningxia) through a combination of literature review and field research. It examined the quantitative, qualitative, and categorical characteristics of tourism resources in Ningxia, and determined the spatial patterns based on kernel density and spatial association analysis. This study also comprehensively evaluated the societal, economic, and environmental factors influencing the spatial distribution of tourism resources in the entire region by employing the geographical detector model to quantify the influence of each factor. The following results were obtained. (1) There were 29218 individual tourism resources in Ningxia, comprising eight main types, 23 subtypes, and 105 fundamental types, and they exhibit a hierarchical pyramidal structure. (2) The tourism resources in Ningxia displayed characteristics of “widespread regional dispersion and limited regional agglomeration”. The spatial distribution of tourism resources was highly imbalanced, and most types of tourism resources exhibit strong positive spatial correlation. (3) The altitude, annual precipitation, population density, distance from urban centers, urbanization rate, and per capita GDP were identified as significant factors influencing the spatial distribution of tourism resources in Ningxia. Based on the results, we recommend that the government should formulate tourism development policies in Ningxia based on local conditions to effectively address the spatial imbalances, enhance the sustainability of tourism development, and continue to promote high-quality tourism development in Ningxia.

Cite this article

ZHANG Shengrui , CHI Lei , ZHU He , ZHANG Tongyan , JU Hongrun . The Spatial Differences and Influencing Factors of Tourism Resources in Ningxia, China[J]. Journal of Resources and Ecology, 2024 , 15(4) : 1068 -1082 . DOI: 10.5814/j.issn.1674-764x.2024.04.025

1 Introduction

As the foundation of tourism activities, tourism resources significantly influence the development of regional tourism and shape the images of tourism destinations (Ndubisi and Nair, 2023). However, as natural assets, tourism resources alone cannot foster tourism development without being imbued with tourism value. Hence, conducting surveys and evaluations of tourism resources constitutes the fundamental work that is pivotal to facilitating tourism development. Surveying regional tourism resources and quantitatively delineating their spatial patterns not only helps in identifying the foundation and conditions of regional tourism resources but also enhances the efficacy of tourism resource development. These efforts facilitate the integration of regional factor resources, drive the optimization and upgrading of the regional industrial structure, and bolster regional tourism competitiveness (Zhang et al., 2023a).
In recent years, as the global tourism industry has continued to grow, tourism has emerged as a crucial driver of regional economic and social development. National strategies and local policies have played a pivotal role in guiding the development of regional tourism resources (Deok and Wu, 2013). Particularly in China, with the comprehensive advancement of national strategies such as the Western Development Strategy, the Belt and Road Initiative, the ecological civilization strategy, and the rural revitalization strategy, tourism resource development has assumed a key role in propelling the sustainable economic and social advancement of western China (Zhang et al., 2022a). China’s Ningxia Hui Autonomous Region faces the pressing imperatives of developing and accessing tourism resources, enhancing regional tourism competitiveness, and fostering economic and social development.
Ningxia Hui Autonomous Region (Ningxia) is situated in the western minority areas of China, setting it apart from the economically developed regions along the eastern coast. This region’s economic development level and overall tourism strength are comparatively underdeveloped. Positioned in the transition zone from the Loess Plateau to the Inner Mongolia Plateau, Ningxia boasts a distinctive natural landscape characterized by mountains and dispersed basins. As an area of historical ethnic convergence, Ningxia is endowed with rich and diverse ethnic and regional cultures, imparting high developmental value to its cultural tourism resources. Nevertheless, owing to national policies, the regional level of tourism development, and limited accessibility of transportation, a comprehensive census of cultural and tourism resources was not undertaken until the establishment of the Ministry of Culture and Tourism in 2018. Subsequently, the ethnic areas in the Northwest began leveraging the national strategic advantages to actively propel the development of their cultural and tourism resources. In 2021, the “14th Five-Year Plan for Cultural and Tourism Development” released by Ningxia Hui Autonomous Region explicitly underscored the significance of conducting surveys and assessments of tourism resources, along with implementing the rational and orderly development of cultural and tourism resources as crucial measures for advancing high-quality tourism development in the region. Consequently, the regional cultural and tourism resources survey project was promptly initiated.
Despite these measures, the regional distribution of tourism resources in Ningxia remains unbalanced owing to background conditions, regional development policies, and other factors. This imbalance accentuates the disparity between resources and the economy, and has emerged as a pivotal factor that constrains the high-quality development of tourism in Ningxia. Consequently, against the backdrop of the establishment of the Yellow River Basin ecological protection and high-quality development pilot zone and the global tourism construction in China, there is an urgent need to systematically collate and analyze tourism resources, quantitatively characterize the spatial pattern of tourism resources, and discern the mechanisms governing that spatial pattern. This approach can furnish decision-making references for the development of tourism resources and tourism-related economic advancement in Ningxia, effectively mitigating the haphazard and incongruous aspects of tourism development, and ultimately fostering the sustainable, high-quality development of tourism in Ningxia.
Thus far, the evaluation of Ningxia’s tourism resources has primarily relied on qualitative research methods, with inadequate utilization of spatial quantitative research methods. Furthermore, the incomplete coverage of census data has undermined the formulation of comprehensive and macroscopic guidance for Ningxia's tourism development. Therefore, this study established a Ningxia tourism resource database through the big data of tourism resources obtained by field investigation and other methods. Subsequently, it employed methods such as kernel density analysis and spatial association to quantitatively depict the regional disparities in tourism resources within Ningxia. By using geographic detectors, this study quantitatively measured the formation mechanism of the spatial patterns of various types of tourism resources from three dimensions: nature, society, and economy. It then proposes corresponding optimization strategies. This approach was designed to furnish comprehensive and macroscopic scientific guidance for the development and utilization of tourism resources in Ningxia in the new era, in order to advance the high-quality development of tourism in Ningxia.

2 Literature review

As the essential foundation for sustainable tourism development and the catalyst for enhancing tourism competitiveness, tourism resources have garnered significant attention from scholars domestically and internationally. Over nearly 70 years of development, research on tourism resources has attained a high level of maturity (Zhang et al., 2022b). As the research in this field has deepened, the scope and objects of tourism resource research have expanded. Currently, numerous definitions of tourism resources exist worldwide, yet a fundamental consensus has been established. Among these definitions, the United Nations Environment Program defined tourism resources as “the natural environment and conditions that can generate economic value to enhance current and future well-being within specific temporal and spatial contexts”. This definition serves as a robust cornerstone for subsequent research on tourism resources.
In the 1950s, scholars embarked on the study of tourism resources, although at that time, the field had not yet coalesced into distinct characteristics and themes. However, with the continuous growth of the global tourism industry in the early 21st century, research on tourism resources surged. This research has primarily centered on the qualitative analysis of tourism resource types (Cosgrove, 1990), the evaluation of tourism resource development (Gelbman and Timothy, 2010), sustainable tourism resource management (Wang, 1997), and the assessment of tourism resource development potential (Stepanova, 2017).
For instance, Wieckowski’s study in 2021 focused on the two border tripoints in the Carpathian Mountains in central Europe, and considered them as the research subjects. By engaging in informal communications and discussions with tourists, he discovered that the border tripoints held substantial symbolic significance as a tourism resource, with the two regions boasting significant tourism development potential (Wieckowski, 2021). Subsequent studies delved into the interplay between tourism resource development and local economic development, cultural heritage preservation, and protection (Medina, 2003). Conflicts frequently arise between tourism resource development and conservation, so it is imperative to investigate how to reconcile this relationship, and this has consequently become a paramount research focus (Singh et al., 2021). Li et al. (2008) identified challenges in the development of local heritage tourism resources, such as population pressure, economic constraints, and funding shortages, all of which posed threats to the conservation of cultural heritage tourism resources.
In another study, Zhuang et al. (2003) conducted a literature analysis to pinpoint the existing issues in the development of wetland ecotourism resources in China, and proposed a development model that integrates both development and conservation efforts to advance the sustainable development of China’s wetland ecotourism resources. Overall, international research on tourism resources has demonstrated a trend characterized by multidisciplinary integration, with an emphasis on sustainable development as the guiding principle and advocating for a balanced approach between resource development and conservation.
In recent years, the rapid advancement of geographic information systems (GIS) has transformed the study of tourism resources, and it has evolved from traditional qualitative analysis to spatial quantitative analysis, particularly in China. The focus of research in China has shifted from resource development and assessment to the spatial distribution of resources and the factors influencing it. The spatial pattern of tourism resources has emerged as a key feature of research in this field, yielding significant global research outcomes.
The primary spatial quantitative research methods include spatial variability assessment (Zhang et al., 2019), kernel density analysis (Wu and Chen, 2022), spatial overlay analysis (Wang et al., 2022b), spatial association analysis (Zhang et al., 2022c), multiple linear regression (Zhang et al., 2022a), and Geo-detector analysis (Qiu et al., 2021). This research area has been predominantly concentrated in China, spanning from the eastern coast to the western interior (Xie et al., 2021; Mou et al., 2020; Chang et al., 2022). Concurrently, border tourism resources, which serve as the foundation for cross-border tourism activities, have increasingly played a pivotal role in stimulating local economies and fostering cultural exchanges between nations (Zhang et al., 2019; Zhang et al., 2023b).
Various types of tourism resources have been the subjects of exploration, including sports tourism resources (Zuo et al., 2021), rural tourism resources (Ma and Fang, 2021), religious tourism resources (Zhu et al., 2018), weather-related tourism resources (Boulais, 2017), biological tourism resources (Bentz et al., 2016), and industrial tourism resources (Wang et al., 2020). It is noteworthy that the existence and development of tourism resources, as integral components of nature-linked tourism activities, are inevitably influenced by both natural and societal factors. For instance, Zhu et al. determined that altitude, slope, and water system distribution are key influences shaping the spatial pattern of religious tourism resources in Qinghai Province (Zhu et al., 2018). Meanwhile, Zhang and Ju scientifically investigated the impacts of population size, per capita GDP, and road network density on tourism resources and the spatial distribution of tourism development in Hainan Province by creating an indicator system (Zhang and Ju, 2021).
China’s economic and cultural development has led to a surge in public demand for tourism resources. Recognizing the crucial importance of the conservation and development of tourism resources, the Chinese government has enacted pertinent policies and implemented various protective measures. Consequently, regions across the country are vigorously advancing the development and utilization of their tourism resources. Notably, the eastern coastal area has emerged as a focal point for tourism resource development, driving the flourishing domestic research on tourism resources.
In summary, both domestic and foreign scholars typically utilize a blend of qualitative and quantitative methods to investigate tourism resources. Research in foreign countries primarily concentrates on ecological and cultural tourism resources, while the research focused on domestic tourism resources centers on cultural, ecological, and geological tourism resources. Foreign research emphasizes the “human” perception and delves into tourism resources based on tourists’ perceptions garnered through interviews or questionnaires. Conversely, domestic research primarily centers on the inherent study of tourism resources, including their classification, principles, spatial patterns, and influencing factors.
Specifically, the existing studies on regional variations in tourism resources predominantly revolve around A-level scenic spots, and there has been insufficient exploration of global tourism resources constructed through resource census approaches. The research scope has been confined to the prefecture-level, with minimal analysis at the county-level and inadequate attention given to the classification, integration, and development of tourism resources in western ethnic minority and economically disadvantaged areas. Consequently, to address these knowledge gaps, this study aims to enrich the relevant theories pertaining to tourism resource development and spatial pattern optimization. It endeavors to achieve this by describing and analyzing the spatial pattern of tourism resources and their influencing factors based on the establishment of the Ningxia tourism resource database. Ultimately, the objective is to furnish comprehensive systematic guidance for the development and management optimization of tourism resources in Ningxia.

3 Methods and data sources

3.1 Study area

Ningxia Hui Autonomous Region, situated in the inland northwest of China, is one of the country’s five major ethnic minority autonomous regions. It covers a total area of 66400 km2. Within Ningxia, there are five prefecture-level cities: Yinchuan, Shizuishan, Wuzhong, Guyuan, and Zhongwei. Additionally, there are 22 county-level administrative districts, comprising nine city districts, two county-level cities, and 11 counties (Fig. 1). This region exhibits a distinctive geographical transition, characterized by shifting landforms that evolve from rolling terrain in the south to wind-eroded formations in the north. Positioned between the Loess Plateau and the Inner Mongolian Plateau, Ningxia’s topography gradually ascends in the south and descends in the north. This area boasts diverse features, such as elevated mountains, scattered hills, alluvial plains formed by stratigraphic subsidence and sediment deposition from the Yellow River, as well as terraces and sand dunes. These intricate and varied landforms, coupled with the region’s unique humanistic landmarks, have contributed to the abundance of captivating tourism resources that Ningxia offers.
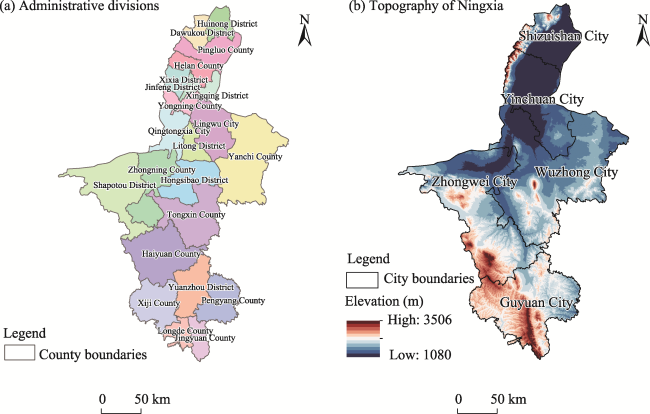
Fig. 1 Administrative divisions and topography of Ningxia

3.2 Methods

3.2.1 Kernel density

Kernel density analysis is a non-parametric statistical technique employed to estimate the density within a given dataset. It functions by assigning higher densities to central point elements within a specified bandwidth range, while peripheral density values are relatively lower (Wang et al., 2022a). This methodology facilitates the examination of spatial clustering patterns related to tourism resources. The equation for calculating kernel density is:
$f\left( s \right)=\underset{i=1}{\overset{n}{\mathop \sum }}\,\frac{1}{r} K \left( \frac{{{d}_{is}}}{r} \right)$
where f(s) is the kernel density value at s; r refers the analysis radius; n refers the number of tourism resources less than or equal to r at s; dis is the distance from i to s; and the K function refers the distance decay function. The density value of tourism resources decreases with an increase in distance (dis). When the distance is r, the density value of tourism resources is 0.

3.2.2 Spatial association indicators

(1) Global indicators of spatial association
In this study, the global Moran’s I index was used to examine the overall spatial association of tourism resources in Ningxia in order to determine the global association among various types of tourism resources (Moran, 1948). The equation for this expression is:
$ Global Moran’s Ⅰ =\frac{n}{\sum\limits_{i=1}^{n}{\sum\limits_{j=1}^{n}{{{\omega }_{ij}}}}}\times \frac{\sum\limits_{i=1}^{n}{\sum\limits_{j=1}^{n}{{{\omega }_{ij}}}}\left( {{X}_{i}}-\bar{X} \right)\left( {{X}_{j}}-\bar{X} \right)}{\sum\limits_{i=1}^{n}{{{\left( {{X}_{i}}-\bar{X} \right)}^{2}}}}$
where Global Moran’s I denotes the global association coefficient; n denotes the number of administrative units in Ningxia; Xi and Xj represent the numbers of tourism resources of the i-th and j-th administrative units;$\bar{X}$ represents the mean value; and ωij represents the spatial weight. The Moran’s I index value is in the range of [–1, 1]. Values greater than zero indicate that there is a global positive correlation and tourism resources are in a spatial agglomeration state. Negative values indicate a global negative correlation and the spatial difference of tourism resources is large. Results close to 0 indicate that tourism resources tend to be distributed randomly in space.
(2) Local indicators of spatial association (LISA)
The local association depicts the local clustering status of tourism resources in Ningxia, encompassing four possible scenarios: H-H (high-high cluster), H-L (high-low outlier), L-H (low-high outlier), and L-L (low-low cluster) (Anselin, 1993). The expressions for these cases are:
Local Moran’s =$\frac{{{X}_{i}}-\bar{X}}{S_{i}^{2}}\times \underset{j=1,j\ne i}{\overset{n}{\mathop \sum }}\,{{\omega }_{ij}}\left( {{X}_{j}}-\bar{X} \right)$
where Local Moran’s I denotes the Local association coefficient; $S_{i}^{2}$ represents the variance of tourism resources in different administrative units in Ningxia; n denotes the number of administrative units in Ningxia; Xi and Xj represent the numbers of tourism resources of the i-th and j-th administrative units; $\bar{X}$ represents the mean value; and ωij represents the spatial weight. Values greater than zero indicate that two cases of H-H or L-L occur. The former indicates that the amounts of tourism resources in the administrative unit and surrounding administrative units are both large, while the latter indicates that the amounts of tourism resources are both low. Values less than zero indicate that two cases of H-L and L-H occur, where the former means that the number of tourism resources in the region is large, while the number of the surrounding areas is small, and the latter is the opposite.

3.2.3 Geo-detector

This paper presents a thorough analysis of the factors influencing the spatial distribution of tourism resources in Ningxia. It introduces an index system that incorporates natural, social, and economic environmental factors to evaluate their impacts on resource distribution. Additionally, this study adopted the Geo-detector’s factor detector to measure the explanatory powers of the different factors on the spatial distributions of various types of tourism resources (Wang et al., 2010), represented by the q value. The formula used for this calculation is:
$q=1-\frac{\sum\limits_{h=1}^{L}{\sigma _{h}^{2}{{N}_{h}}}}{N{{\sigma }^{2}}}$
where N and σ2 respectively represent the variance of the number of units and Y in the study area. The population Y consists of L layers (h=1, 2,..., L). q represents the explanatory ability of each influencing factor to Y, and its value is strictly within [0,1]. The larger the value of q, the stronger the explanatory ability of independent variable X to dependent variable Y, and vice versa.

3.3 Data sources

The tourism resource database developed in this study consists of various information, including the name, type, spatial coordinates, transportation accessibility, development status, township, and resource grade of each resource object. The data sources encompassed the tourism development plan of Ningxia, official tourism websites, relevant academic literature, toponymic information, local histories of cities and counties, as well as fieldwork. The fieldwork was conducted between July and September 2021, covering all 22 county-level administrative districts in the region. The final compilation resulted in 29218 individual tourism resources, encompassing eight main types, 23 subtypes, and 105 fundamental types. From these, 16405 resource objects were obtained through field research, accounting for approximately 56.15% of the total, while 12813 resource objects were acquired through data compilation, constituting approximately 43.85% of the total.
This study used vector data from the Data Center for Resource and Environmental Sciences of the Chinese Academy of Sciences (CAS) to incorporate administrative boundaries at the municipal and county levels, government sites at various tiers, as well as raster data such as the annual precipitation and topography of Ningxia. The vector data for major transportation roads, railway stations, airports, and others were derived from the 1: 250000 basic geographic database. Statistical information regarding the population, administrative area, urbanization rate, and GDP (Gross Domestic Product) of each district and county were sourced from the statistical yearbook of Ningxia, as well as the statistical yearbooks of each city. Some additional data were obtained from the work reports of the district and county governments and the statistical bulletins on the development of the national economy and society.

4 Results

4.1 Overall quantity of tourism resources in Ningxia

The Ningxia tourism resources database compiled in this study consisted of 29218 tourism resource objects. The classification and evaluation of these resources were conducted in accordance with the national standard “Tourism Resources Classification, Investigation, and Evaluation” (GB/T18972-2017). The tourism resources in Ningxia were organized into eight main types, 23 subtypes, and 105 fundamental types, as shown in Table 1.
Table 1 Quantities and types of tourism resources in Ningxia
Main types Subtypes Number of
fundamental types
Types Number Proportion (%) Types Number
A Geological landscapes 5989 20.50 AA. Natural landscape complex 5168 4
AB. Geological and tectonic features 278 4
AC. Surface morphology 488 6
AD. Natural markers and natural phenomena 55 3
B Water landscapes 1874 6.41 BA. Rivers 552 3
BB. Lakes 1124 3
BC. Groundwater 127 2
BD. Ice and snow 12 2
BE. Sea 59 1
C Biological landscapes 752 2.57 CA. Vegetation landscape 591 4
CB. Wildlife habitat 161 4
D Astronomical phenomena and
meteorological landscapes
69 0.24 DA. Astronomical landscape 30 2
DB. Weather and climate phenomena 39 3
E Buildings and facilities 15736 53.86 EA. Cultural landscape complex 10074 9
EB. Practical buildings and facilities 4259 16
EC. Landscape architecture 1403 14
F Ruins and remains 3502 11.99 FA. Material cultural remains 2903 2
FB. Intangible cultural remains 599 5
G Tourism commodities 571 1.95 GA. Agricultural products 367 5
GB. Industrial products 7 1
GC. Hand-made crafts 197 7
H Human activities 725 2.48 HA. Personnel activity record 388 2
HB. Festivals 337 3
Total 29218 100.00 29218 105
The numbers of tourism resources among the different types showed significant variation. Among the main types, buildings and facilities stood out with the highest count, comprising 15736 objects, which accounted for approximately 53.86% of the total. This is followed by geographic landscapes, ruins and remains, water landscapes, biological landscapes, human activities, tourism commodities, and astronomical phenomena and meteorological landscapes. Among the subtypes, the largest number of tourism resources fell under the category of cultural landscape complex, followed by natural landscape complexes, utilitarian buildings and core facilities. Among the fundamental types, the recreation and leisure resort had the highest count, with 3547 resources, making up around 12.14% of the total. Additionally, there were other fundamental types like hill landscapes, architectural monuments, places of religious and ceremonial activities, ravine-type landscapes, and construction works and production sites, with more than 1000 objects each.
Regarding the quality of tourism resources, they existed in a hierarchical structure resembling a pyramid, ranging from low to high. The fifth level boasted the highest count of tourism resources, whereas the first level had the lowest count. Among them, there were 8130 resources of excellent grade (Grade V, Grade IV, Grade III), making up approximately 27.83% of the total. The hierarchical structure of the different types of tourism resources also followed a pyramidal pattern, with buildings and facilities having the highest count for each grade, while astronomical phenomena and meteorological landscapes had the lowest count. In terms of geological landscapes, the number of ordinary grade resources (Grade I and Grade II) was around 5089, accounting for roughly 84.93% of the total count for this tourism resource type. This suggested that the quality of this type of tourism resource was relatively low and that the structure of the resource grades is imbalanced. Conversely, the hierarchical structure of ruins and remains tourism resources was more balanced, with less prominent pyramidal characteristics (Fig. 2).
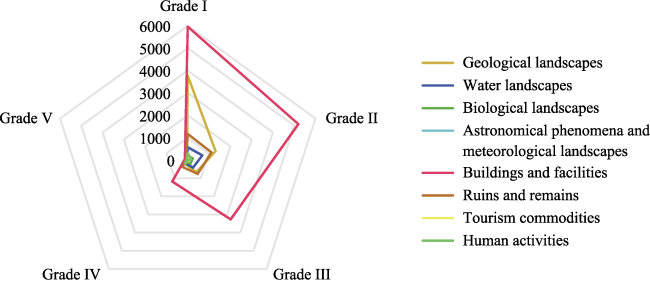
Fig. 2 Quality grade structures of the various types of tourism resources in Ningxia

4.2 Analysis of the spatial pattern of tourism resources in Ningxia

4.2.1 Kernel density analysis of tourism resources

Based on kernel density analysis, the spatial pattern of tourism resources in Ningxia is visually represented in Fig. 3. Among them, considering the mobility and non-physical nature of tourism commodities and human activity resources, this study identified the primary locations where these tourism resources exist by referring to relevant information, thus physically representing the functioning of the tourism resources. Figure 3 shows that all types of tourism resources in Ningxia exhibited a multi-core agglomeration distribution, with notable variations in regional spatial density. This indicated a significant spatial imbalance in the distribution of tourism resources.
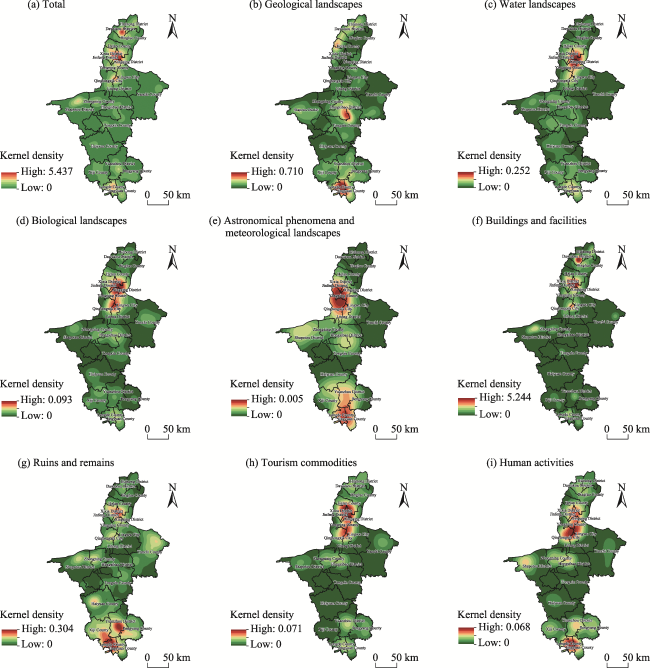
Fig. 3 Distribution of the kernel density of different types of tourism resources in Ningxia
Overall, the tourism resources in Ningxia showed a clustered distribution, with Yinchuan City (specifically Jinfeng District and Xixia District) serving as the core, forming a first-level core area, two second-level core areas, two third-level core areas, and several fourth-level core areas. The first-level core area was situated at the intersection of Jinfeng District and Xixia District, with central kernel density values ranging from 4.79 to 5.43. The second-level core areas were located in the southern part of Dawukou District and the northern part of Litong District. The third-level core areas predominantly extended across the northern part of Shapotou District and the central part of Longde County. In contrast, the fourth-level core areas exhibited a more dispersed distribution. Additionally, Ningxia’s tourism resources followed a distribution pattern characterized by “along the line, around the city, beside the water” and the spatial distribution features were “scattered in large areas and concentrated in small areas”. Most resources were concentrated around county government centers, while a few were situated in areas with challenging terrain conditions and limited transportation accessibility. In Jinfeng District, for example, the seat of the district government is the political and cultural center of the entire Ningxia region. It possessed comprehensive infrastructure, excellent transport connectivity, a dense population, and a rich historical and cultural heritage, which are all beneficial for the formation and development of tourism resources. Moreover, transportation networks played a crucial role in resource accumulation. Convenient transportation not only enhanced accessibility for tourism resource development, but the transportation routes themselves can be developed into distinctive scenic corridors and other tourism attractions (Fig. 3a).
In terms of the main types of tourism resources, the geographical landscape in Ningxia was widely spread, primarily forming three high-density core areas. Longde County, Hongsibao District, and Helan County, which relied on Liupan Mountain, Daluo Mountain, and Helan Mountain, respectively, were blessed with abundant geographical landscape tourism resources. The nuclear density value for these three regions was significantly higher than in other areas, with a central core density of 0.2519 (Fig. 3b).
Water landscapes had a considerable dependence on the water system, particularly the Yellow River, which is China’s second-largest river. The main course of the Yellow River traverses eight county-level administrative regions in Ningxia, including Shapotou District, Yongning County, and Xingqing District, offering a wealth of water landscape tourism resources. This gave rise to prominent clustering characteristics in the water landscapes of Xingqing District, Yongning County, and Shapotou District. Moreover, diverse types of water landscapes can be found along the various levels of Yellow River tributaries, such as Qingshui River and Zuli River, which generally exhibit an irregular zonal distribution (Fig. 3c).
The high-density core areas of biological landscapes were predominantly found in Xingqing District and Litong District, which are characterized by abundant vegetation landscapes and wildlife habitats. The central core density value reached 0.093 (Fig. 3d).
Ningxia had a limited number of astronomical phenomena and meteorological landscape resources, which are mainly concentrated in the border regions of Yongning County and Qingtongxia City, as well as Longde County and Jingyuan County. The nuclear density values for these resources ranged between only 0.0027 and 0.0045 (Fig. 3e).
The agglomeration characteristics of buildings and facilities as tourism resources were significant, particularly in the core areas and sub-core areas. Since buildings and facilities accounted for a substantial portion of the tourism resources in Ningxia, their spatial pattern mirrors that of tourism resources in general. They exhibited a radial distribution with Jinfeng District as the core area, and a core density value of 5.244 (Fig. 3f). This pattern was primarily attributed to Jinfeng District serving as the political, economic, and cultural center of the entire region.
Ruins and remains were concentrated in the southern region of Ningxia, primarily in Longde County. The high-density core areas also included Yuanzhou District, Yanchi County, and Jinfeng District (Fig. 3g). Extensive prehistoric human activities have endowed these areas with the natural conditions for abundant ruins and remains as tourism resources. Notably, Yuanzhou District and Longde County have unveiled numerous Neolithic sites and ancient city ruins, creating a high-density core area for ruins and remains as tourism resources.
Tourism commodities and human activities demonstrated a distinct dot-and-strip distribution in space, which was mainly concentrated in Yongning County, Jinfeng District, Qingtongxia City, and Longde County. This was primarily due to the high population density, a substantial tourism market, and the potential for resource development in these areas (Fig. 3h, 3i).

4.2.2 Spatial association analysis of tourism resources

In terms of global spatial association, a significant clustering pattern was observed for the total of tourism resources, including geographical landscapes, water landscapes, biological landscapes, astronomical phenomena and meteorological landscapes, buildings and facilities, ruins and remains, and human activities. This was evident from the Global Moran’s I statistic, which was significant at a level of 0.1, and the Z score, which exceeded 1.65. These findings suggested that the tourism resources tended to exhibit spatial clustering and aggregation.
However, the Global Moran’s I value for tourism commodities was negative and failed to pass the significance test. This indicated that the distribution of tourism commodities tended to be random and lacked a discernible clustering pattern in space.
Table 2 Global Moran’s I and Z scores of various tourism resources in Ningxia
Index GL WL BL APML BF RR TC HA Total
Moran’s I 0.2862 0.0926 0.1116 0.0218 0.2318 0.2811 -0.0808 0.1111 0.1170
Z score 5.7119 2.4195 1.5965 1.1649 4.6135 5.5658 -0.5679 2.7259 1.5363

Note: GL, WL, BL, APML, BF, RR, TC and HA represent geological landscapes, water landscapes, biological landscapes, astronomical phenomena and meteorological landscapes, buildings and facilities, ruins and remains, tourism commodities and human activities, respectively.

The analysis of global association revealed that local association does not apply to the tourism resources of tourism commodities, and various types of tourism resources exhibited different spatial clustering patterns (Fig. 4). Considering the overall view of tourism resources, Ningxia did not exhibit an H-H phenomenon. Instead, the L-L phenomenon was primarily observed in Dawukou District, Pingluo line, and Xingqing District. Local spatial negative correlations manifested as two kinds of phenomena: H-L and L-H. The H-L phenomenon was mainly distributed in Helan County and Xixia District, while the L-H phenomenon was concentrated in Pengyang County and Jingyuan County (Fig. 4a).
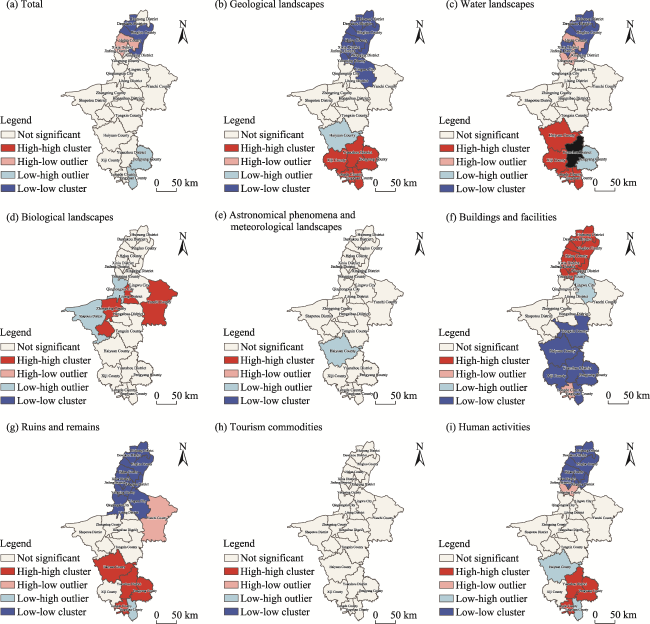
Fig. 4 Local spatial associations of various types of tourism resources in Ningxia
Regarding the main types of tourism resources, the H-H phenomenon of geological landscapes was primarily concentrated in the southern part of Ningxia, including Longde County, Yuanzhou District, Pengyang County, Xiji County, and Jingyuan County, with all of them exhibiting significant clustering at a 0.05 level. Conversely, the L-L phenomenon was more prominent in northern Ningxia, encompassing Pingluo County, Helan County, Xixia District, Jinfeng District, Xingqing District, and Lingwu City. Haiyuan County was the only area showing the L-H phenomenon for both geographical and cultural landscape tourism resources (Fig. 4b). The H-H phenomenon for water landscapes tourism resources was dispersed in Haiyuan County, Longde County, Xiji County, and Yuanzhou District in the southern part of Ningxia, while the L-L phenomenon was more pronounced in the north, including Dawukou District, Huinong District, Pingluo County, Xixia District, and Xingqing District. Regions exhibiting negative spatial correlation mainly included Pengyang County, Helan County, and Jinfeng District (Fig. 4c). For biological landscapes, the H-H phenomenon was observed in Yanchi County, Litong District, and Zhongning County, while the L-H phenomenon was found in Qingtongxia City and Shapotou District (Fig. 4d). Astronomical phenomena and meteorological landscapes exhibited only one distribution feature, which was the L-H phenomenon in Haiyuan County (Fig. 4e). The local association of buildings and facilities was generally the opposite of those observed in geological landscapes and water landscapes. The H-H phenomenon was primarily found in northern Ningxia, including Pingluo County, Xixia District, Jinfeng District, and Yongning County. The L-L phenomenon was mainly distributed in the southern part of Ningxia (Fig. 4f). Regarding ruins and remains, the H-H phenomenon was distributed in Longde County, Pengyang County, Haiyuan County, and Yuanzhou District in the south of Ningxia, while the L-L phenomenon was concentrated in most districts and counties in the north, including Huinong District, Dawukou District, Pingluo County, Helan County, Xixia District, and Jinfeng District. Yanchi County and Jingyuan County exhibited the only H-L and L-H phenomenon, respectively (Fig. 4g). The H-H phenomenon of human activities was mainly distributed in Yuanzhou District, Pengyang County, and Longde County. The H-L phenomenon was observed in Yongning County, while the L-H phenomenon was present in Jingyuan County and Haiyuan County. The northern part of Ningxia still shows the L-L phenomenon, covering seven districts or counties (Fig. 4i).

4.3 Factors influencing the spatial patterns of tourism resources in Ningxia

4.3.1 Selection and modeling of the indicators of influencing factors

The spatial pattern of tourism resources is influenced by numerous factors. Based on previous research findings (Wang et al., 2022b), and after conducting several rounds of expert opinion consultations and considering data availability, this study developed an index system to assess the factors affecting the spatial pattern of tourism resources. The index system comprises three dimensions: natural, social, and economic (Table 3). It is important to note that, due to the limited number of astronomical phenomena and meteorological landscapes, this study does not investigate the driving factors influencing their spatial pattern. This decision was made to avoid potential research errors and maintain the scientific rigor of this study.
Table 3 Index system of factors influencing the tourism resource spatial patterns in Ningxia
Index system Detection factors Factor interpretation (Where the tourism resources are located)
Natural factors Altitude Altitude of the region
Annual precipitation Annual precipitation of the region
Landform Topography of the region
Social factors Distance from traffic lines Closest distance to the main road
Population density Population density of the county
Tourist density Tourist density of the county
Urbanization rate Urbanization rate of the county
Economic factors Per capita GDP Per capita GDP of the county
Distance from city center Closest distance to each city government

4.3.2 Analysis of factor detection results

This study analyzed the driving factors behind the spatial patterns of various types of tourism resources using the Geo detector method. The results (Table 4) revealed the explanatory power of the different factors on the spatial patterns of these resources. Clearly, there are variations in the influence of each factor depending on the type of tourism resource.
Table 4 Spatial pattern factor detection results and q values of tourism resources in Ningxia
Index system Detection factors GL WL BL BF RR TC HA Total
Natural factors Altitude 0.400 0.399 0.514 0.282 0.263 0.023 0.032 0.308
Annual precipitation 0.133 0.197 0.202 0.156 0.465 0.014 0.027 0.136
Landform 0.361 0.242 0.325 0.191 0.061 0.102 0.132 0.184
Social factors Distance from traffic lines 0.014 0.091 0.098 0.054 0.023 0.217 0.291 0.063
Population density 0.271 0.559 0.448 0.593 0.087 0.316 0.219 0.451
Tourist density 0.326 0.576 0.483 0.442 0.224 0.369 0.305 0.448
Urbanization rate 0.286 0.306 0.299 0.457 0.211 0.283 0.327 0.403
Economic factors Per capita GDP 0.219 0.126 0.217 0.241 0.204 0.277 0.202 0.189
Distance from city center 0.050 0.322 0.416 0.578 0.104 0.341 0.203 0.475

Note: GL, WL, BL, BF, RR, TC and HA represent geological landscapes, water landscapes, biological landscapes, buildings and facilities, ruins and remains, tourism commodities and human activities, respectively.

The dominant driver differs among the categories. The primary factor driving the spatial differentiation of the overall tourism resources was the distance from the city center. Altitude emerged as the dominant driver for geological and biological landscapes, while tourist density played a crucial role in shaping water landscapes and tourism commodities. Population density emerged as the main driving force for buildings and facilities, while annual precipitation was the key factor influencing ruins and remains. The urbanization rate took precedence in shaping human activities.
Furthermore, the P-values of all the detected factors are less than 0.001, indicating their statistical significance. Hence, these nine factors demonstrated a robust ability to elucidate the spatial differentiation of tourism resources in Ningxia.
(1) Total tourism resources
In analyzing the factors impacting the spatial distribution of tourism resources in Ningxia, several notable insights emerged. Firstly, the distance from the city center emerged as the most influential factor, signifying a significant “central city dependency” in Ningxia’s tourism resources. In other words, resources closer to the city center tended to possess higher endowments, while their number decreased as distance increased.
Furthermore, population density and tourist density exhibited strong explanatory power, underscoring the pivotal role of human activity in shaping the spatial pattern of tourism resources. Altitude also emerged as a key factor, particularly in relation to the natural resources in Ningxia. As altitude increased, the landform became more diverse, resulting in a greater variety of natural landscapes.
Moreover, the urbanization rate and regional per capita GDP demonstrated significant explanatory ability regarding the spatial distribution of tourism resources. This suggested an economy-oriented distribution of tourism resources in Ningxia. Overall, the spatial distribution of tourism resources in the region showed characteristics of central city dependency, population dependence, and an economy-driven orientation.
(2) Geological landscapes
Among the factors influencing the spatial arrangement of geological landscape tourism resources, altitude, annual precipitation, and tourist density emerged as robust indicators. Notably, altitude accounted for a substantial 40% of the variance in the distribution of geological landscape tourism resources, primarily due to the prevalence of intricate terrains where such resources were found.
The areas encompassing Liupan Mountain, Daluo Mountain, Helan Mountain, Longde County, and Hongsibao District, as well as the northwestern part of Helan, boasted abundant geographic and cultural landscape tourism resources, collectively constituting 27.82% of the total resources of these types. Conversely, Jinfeng District and Xingqing District featured mostly flat terrains, leading to a relatively minimal number and variety of landscape resources, accounting for only 1%.
Furthermore, the specific landform type significantly influenced the spatial distribution of these landscapes. Mountainous terrains and adjacent valleys supported the clustering of similar tourism resources. Conversely, the explanatory power of socioeconomic factors, such as the level of economic development and transportation accessibility, was relatively low, barely exceeding 0.1. This suggested a limited correlation between the spatial pattern of landscape tourism resources and economic development.
(3) Water landscapes
Tourist density, population density, and distance from the city center emerged as the primary factors with significant explanatory power for the spatial distribution of water landscape tourism resources. This indicated a close correlation between the distribution of these resources and human activities. Notably, recreational lake tourism resources, predominantly comprised of artificial lakes, contributed 43.97% of the total water landscapes resources. Moreover, natural factors such as altitude and landform exhibited a strong reliance on the spatial distribution of water landscape resources. The intricate terrain and landforms not only gave rise to unique landscapes but also encompassed a diverse array of water landscapes, including modern glaciers, snow fields, mountain valleys, and river flats. On the contrary, the influence of the closest distance to the main road on the spatial pattern of water landscape was low, indicating that the water landscape was not sensitive to the spatial dependence of traffic lines.
(4) Biological landscapes
This study identified altitude, tourist density, population density, and distance from the city center as the top four factors exerting the greatest influence on the spatial pattern of biological landscape tourism resources in Ningxia. These resources were predominantly connected to and derived from wetland, forest, and mountain landscapes, thereby underscoring the substantial explanatory power of landform and other related factors. Notably, 37.63% of all biological landscapes existed within the landform of the mid-altitude alluvial plain.
Furthermore, as mass tourism has continued to grow, artificial biological landscapes have assumed a pivotal role as a means of fostering the interaction between humans and nature. The spatial distribution and forms of these artificial landscapes were closely intertwined with social and economic development. Simultaneously, the distribution of urbanization levels aligned with that of the biological landscape tourism resources.
(5) Buildings and facilities
In Ningxia, buildings and facilities constituted the primary tourism resources. The impact factors for influencing the spatial pattern of these resources exhibited a similar explanatory ability to that of the overall tourism resources. However, the interpretative power of factors affecting building and facility tourism resources was relatively lower compared to natural factors such as altitude. This was primarily because natural tourism resources (geological landscapes, water landscapes, biological landscapes, astronomical phenomena, and meteorological landscapes) exert a lesser influence on the humanistic tourism resources (such as buildings and facilities, ruins and remains, tourism commodities, and human activities).
Population density (0.593) emerged as the dominant factor affecting the spatial pattern of building and facility tourism resources, surpassing the impact of distance from the city center (0.578). The cultural landscape complex occupied a prominent position within these resources, encompassing religious and sacrificial activity sites, construction projects and production sites, as well as recreation and leisure resorts. The target audience for these resources is primarily comprised of residents and tourists; therefore, population density becomes the strongest explanatory indicator among the impact factors.
(6) Ruins and remains
The explanatory powers of the various factors for ruins and remains can be ranked as follows: annual precipitation (0.465), altitude (0.263), tourist density (0.224), urbanization rate (0.211), per capita GDP (0.204), distance from the city center (0.104), population density (0.087), topography (0.061), and distance from traffic lines (0.023). All these factors passed the significance test.
Among these factors, the precipitation held the strongest explanatory power, accounting for 47% of the variation. This was because annual precipitation plays a crucial role in regional divisions for agricultural and animal husbandry production. Notably, prominent ruins and remains such as the beacon towers and military castles in Ningxia are primarily located in areas with varying annual rainfall.
Altitude also exhibited significant explanatory ability. This can be attributed to the influences of traditional customs and ancient human activities, with many sites and tombs constructed on the mountains.
(7) Tourism commodities
Considering that tourists constitute the primary target audience for tourism products, the dominant factor influencing their spatial distribution was tourist density. This factor had a significant explanatory power of 0.369, indicating that the spatial pattern of tourism commodities changes in accordance with the movement of tourists and exhibited characteristics of tourist dependence.
Other factors, namely distance from the city center, population density, and urbanization rate, also demonstrated strong explanatory power. Areas near the city center not only had high urbanization rates and tourist densities but also served as relatively concentrated residential areas. Consequently, there were notable similarities between these factors and the spatial distribution of tourism resources related to tourism products.
(8) Human activities
The urbanization rate had a significant explanatory power of 32.7% at a significance level of 0.01 in the spatial differentiation of tourism resources related to human activities, indicating a strong spatial consistency between human activities and the level of urbanization. This can be attributed to the fact that China’s traditional intangible cultural heritage is often preserved in rural areas, leading to the concentration of intangible cultural heritage inheritors, traditional performing arts, and agricultural festivals in regions with lower levels of urbanization. The field research findings in Longde County served as an example, revealing that around 70% of human activities were concentrated in non-urban areas such as Yanghe Township and Zhangcheng Township.
Furthermore, tourism resources related to human activities tended to be concentrated in areas near transportation routes. Convenient transportation enhances the efficiency of tourism activities and reduces the time costs for tourists. Like tourism commodities, tourism resources linked to human activities also exhibited features of tourist dependence. Tourist density was therefore a crucial factor in determining the spatial pattern of these resources, with an explanatory power of 0.305.

5 Discussion

Given the complex interplay between resource exploitation, environmental conservation, and economic growth, as well as the opportunities arising from the 14th Five-Year Plan for Cultural and Tourism Development of Ningxia Hui Autonomous Region, it has become imperative to examine the spatial distribution of tourism resources and identify the factors influencing it. This comprehensive analysis of tourism resources will offer scientific insights to support the sustainable development of regional tourism in Ningxia. Therefore, within the broader context of establishing an ecological protection and high-quality development pilot area in the Yellow River Basin, and with a focus on enhancing tourism infrastructure, the government of Ningxia should proactively undertake systematic categorization and analysis of the available tourism resources. Additionally, quantitatively evaluating the various factors influencing the spatial distribution of these resources is crucial. By doing so, Ningxia can foster the quality-oriented and efficient advancement of its tourism industry.
In recent years, Ningxia has garnered significant attention as a tourism research destination, primarily because of its abundant resources. However, the absence of a comprehensive survey and systematic analysis of tourism resources throughout the entire region, coupled with the lack of robust theoretical support and macro-level planning guidance, has led to a pronounced spatial disparity between the development of tourism resources and overall economic growth. Consequently, this region encounters challenges such as haphazard tourism development and asynchronous progress in regional tourism and collaboration, primarily stemming from an inadequate understanding of the underlying resource conditions. To overcome these obstacles, it is crucial to conduct a comprehensive survey and systematic analysis of the tourism resources in Ningxia. This initiative will provide a solid foundation for developing an elaborate theoretical framework and formulating efficient macro-level plans to guide the sustainable growth of tourism resources and overall tourism development in the region. By addressing these shortcomings, Ningxia can strive towards achieving a harmonious and synchronized development of its tourism industry while leveraging its unique resource background. The spatial imbalance and indiscriminate development of tourism resources poses significant challenges to the coordinated and sustainable growth of tourism in Ningxia. On one hand, this imbalance has not only led to uneven economic development in different regions, but the excessive concentration and distribution of tourism resources can erode the local culture. On the other hand, without a clear tourism positioning based on its own resource characteristics and advantages, blindly developing tourism resources can result in the degradation of existing sites and even harm the local natural environment.
This study can offer decision-making insights for Ningxia's tourism resource development and economic growth. It aims to mitigate the haphazard and incongruous nature of tourism development, enhance the sustainability of tourism, and facilitate the efficient allocation of tourism resources, regional human resources, capital, and other factors. Ultimately, it aims to contribute to the high-quality advancement of China’s tourism industry. Here are four specific recommendations for policy makers and industry professionals involved in the tourism sector in Ningxia. Firstly, the government should leverage the trickle-down effect of tourism resource concentration zones to stimulate the development of neighboring areas. Secondly, the government must establish a clear development roadmap for regional tourism resources and carefully demarcate the tourism development zones. Thirdly, the government should explore untapped areas and address the scarcity of certain types of tourism resources. Fourthly, the government should proactively enhance the transportation network layout within the primary tourism resource area.

6 Conclusions

Through a quantitative examination of the spatial distribution pattern of tourism resources, using techniques such as kernel density and spatial association, this study sheds light on the underlying mechanisms of influence through the application of geographic detectors. The findings of this study not only contribute to the development and enrichment of tourism resource theories but also provide valuable insights for the overall planning and design of Ningxia’s tourism resources. The main conclusions are as follows.
(1) Tourism resources in Ningxia were characterized by their abundant quantities and diverse types. A total of 29218 resource objects were identified, encompassing eight main types, 23 subtypes, and 105 fundamental types according to the national standard. Among these, the subtype with the highest number was cultural landscape complexes, while the fundamental type with the highest number was recreation and leisure resorts, comprising a total of 3547 resource objects. In terms of quality, the tourism resources exhibited a hierarchical “pyramid” structure, ranging from low to high. The fifth level tourism resources were the least represented, whereas the first level tourism resources were the most prevalent in number.
(2) The tourism resources in Ningxia had distinct characteristics of “large regional dispersion, small regional agglomeration”. The spatial distribution density varied significantly, resulting in a serious imbalance in the distribution of tourism resources. Generally, there was one first-level core area, two second-level core areas, two third-level core areas, and several fourth-level core areas. In terms of spatial association, the distribution of tourism commodities tended to be random, but all the other types of tourism resources were positively correlated in space. Overall, the tourism resources in Ningxia displayed a spatial pattern with higher concentrations in the northern and southern regions, and a lower concentration in the central region.
(3) The spatial pattern of tourism resources in Ningxia was influenced by various natural, social, and economic factors. These factors included altitude, annual precipitation, population density, distance from traffic lines, urbanization rate, and distance from the city center. Specifically, altitude, landform, and annual precipitation were the primary factors driving the spatial differentiation of natural tourism resources in Ningxia. Tourist density, population density, urbanization rate, and distance from the city center were key factors influencing the spatial differentiation of humanistic tourism resources. Overall, the spatial pattern of tourism resources in Ningxia was a result of the complex interplay between natural, social, and economic factors, which shaped the distributions of the different types of tourism resources throughout the region.
It is important to acknowledge that the construction of the Ningxia tourism resource database in this paper has certain limitations due to the lack of comprehensive data and constraints in field research time. Therefore, there is ample room for improvement, particularly in aspects such as astronomical phenomena and meteorological landscapes and human activities. Furthermore, the evaluation index system of the factors influencing the spatial pattern of tourism resources constructed in this study lacks sufficient economic indicators due to the challenges associated with obtaining tourism economic data in relatively underdeveloped regions of China, like Ningxia. However, as more detailed tourism economic data becomes available at the county level, the integrity and scientific rigor of the index system can be further enhanced in future research. In addition, the increasing negative impacts of the resource curse effect on tourism development in Ningxia is worth noting. Future studies can address this issue by conducting a coupling and coordinated analysis of tourism development based on more comprehensive tourism resources and tourism economic data. Utilizing panel data spanning multiple years can help to capture the spatio-temporal characteristics of tourism development, uncover its underlying mechanisms, and facilitate simulation and optimization analysis. This multifaceted approach is crucial for promoting the sustainable development of tourism in Ningxia.
[1]
Anselin L. 1993. The Moran scatterplot as an ESDA tool to assess local instability in spatial association. Morgantown, USA: Regional Research Institute, West Virginia University.

[2]
Bentz J, Lopes F, Calado H, et al. 2016. Sustaining marine wildlife tourism through linking limits of acceptable change and zoning in the wildlife tourism model. Marine Policy, 68: 100-107.

[3]
Boulais C M. 2017. When severe weather becomes a tourist attraction: Understanding the relationship with nature in storm-chasing tourism. Weather Climate and Society, 9(3): 367-376.

[4]
Chang Y, Li D B, Simayi Z, et al. 2022. Spatial pattern analysis of Xinjiang tourism resources based on electronic map points of interest. International Journal of Environmental Research and Public Health, 19: 7666. DOI: 10.3390/ijerph19137666.

[5]
Cosgrove D. 1990. Landscape studies in geography and cognate fields of the humanities and social sciences. Landscape Research, 15: 1-6.

[6]
Deok C Y, Wu Y S. 2013. A study on the revitalization of public relations for foreign tourists’ Korean trip for medical purpose focused on designs for tourist information. Journal of Korean Society of Communication Design, 16: 165-174.

[7]
Gelbman A, Timothy D J. 2010. From hostile boundaries to tourist attractions. Current Issues in Tourism, 13(3). DOI: 10.1080/13683500903033278.

[8]
Li M M, Wu B H, Cai L P. 2008. Tourism development of world heritage sites in China: A geographic perspective. Tourism Management, 29(2): 308-319.

[9]
Ma S M, Fang X Q. 2021. Research on traditional villages tourism resources analysis based on GIS: A case study on Zichuan District, Zibo City, Shandong Province, China. Asia-Pacific Journal of Convergent Research Interchange, 7: 1-10.

[10]
Medina K. 2003. Commoditizing culture: Tourism and maya identity. Annals of Tourism Research, 30(2): 353-368.

[11]
Moran P A P. 1948. The interpretation of statistical maps. Journal of the Royal Statistical Society, 10(2): 243-251.

[12]
Mou N X, Zheng Y H, Makkonen T, et al. 2020. Tourists’ digital footprint: The spatial patterns of tourist flows in Qingdao, China. Tourism Management, 81: 104151. DOI: 10.1016/j.tourman.2020.104151.

[13]
Ndubisi N O, Nair S. 2023. International tourism: Inimitable vs imitable core tourism resources and destination image. Journal of Destination Marketing& Management, 27: 100756. DOI: 10.1016/j.jdmm.2022.100756.

[14]
Qiu Y H, Yin J, Zhang T, et al. 2021. Spatiotemporal dynamic analysis of A-level scenic spots in Guizhou Province, China. ISPRS International Journal of Geo-Information, 10: 568. DOI: 10.3390/ijgi10080568.

[15]
Singh S, Bhat J A, Shah S, et al. 2021. Coastal resource management and tourism development in Fiji Islands: A conservation challenge. Environment Development and Sustainability, 23(3): 3009-3027.

[16]
Stepanova S V. 2017. Russia’s north-west borders: Tourism resource potential. Baltic Region, 9(2): 76-87.

[17]
Wang J F, Li X H, Christakos G, et al. 2010. Geographical detectors-based health risk assessment and its application in the neural tube defects study of the Heshun Region, China. International Journal of Geographical Information Science, 24(1): 107-127.

[18]
Wang Q, Bing H, Wang S Q, et al. 2022a. Study on the spatial distribution characteristics and influencing factors of famous historical and cultural towns or villages in Hubei Province, China. Sustainability, 14(21): 13735. DOI: 10.3390/su142113735.

[19]
Wang Q J, Wang Z H, Zhou J L, et al. 2020. Spatial identification and development sequence of coal mine tourism resources. Sensors and Materials, 32(11): 3867-3878.

[20]
Wang X Z. 1997. The patterns of development tourism resources and the concept of sustainable development of tourism areas in China. Scientia Geographica Sinica, 17(3): 218-223. (in Chinese)

[21]
Wang Y W, Wu X Y, Liu Z Z, et al. 2022b. Spatial patterns of tourist attractions in the Yangtze River Delta Region. Land, 11(9): 1523. DOI: 10.3390/land11091523.

[22]
Wieckowski M. 2021. The border as a resource—New places for tourism development: Evidence from two Carpathian tripoints. Baltic Journal of Health and Physical Activity, 13: 179-186.

[23]
Wu X Y, Chen C Y. 2022. Spatial distribution and accessibility of high level scenic spots in Inner Mongolia. Sustainability, 14: 7329. DOI: 10.3390/su14127329.

[24]
Xie X, Zhang L, Sun H, et al. 2021. Spatiotemporal difference characteristics and influencing factors of tourism urbanization in China’s major tourist cities. International Journal of Environmental Research and Public Health, 18: 10414. DOI: 10.3390/ijerph181910414.

[25]
Zhang S R, Chi L, Zhang T Y, et al. 2022a. Spatial pattern and influencing factors of tourism resources in northwestern ethnic areas in China—A case study of Longde County. International Journal of Environmental Research and Public Health, 19: 16684. DOI: 10.3390/ijerph192416684.

[26]
Zhang S R, Chi L, Zhang T Y, et al. 2023a. Optimization of tourism management based on regional tourism competitiveness evaluation: Evidence from Ningxia Hui Autonomous Region, China. Sustainability, 15: 9591. DOI: 10.3390/su15129591.

[27]
Zhang S R, Chi L, Zhang T Y, et al. 2023b. Spatial pattern and influencing factors of land border cultural heritage in China. Heritage Science, 11(1): 187. DOI: 10.1186/s40494-023-01037-9.

[28]
Zhang S R, Ju H R. 2021. The regional differences and influencing factors of tourism development on Hainan Island, China. Plos One, 16(10): e0258407. DOI: 10.1371/journal.pone.0258407.

[29]
Zhang S R, Zhong L S, Ju H R, et al. 2019. Land border tourism resources in China: Spatial patterns and tourism management. Sustainability, 11(1): 236. DOI: 10.3390/su11010236.

[30]
Zhang T Y, Wang Y J, Wang Y Y, et al. 2022b. Spatial structure and development of tourism resources based on point pattern analysis: A case study in Hainan Island, China. Journal of Resources and Ecology, 13(6): 1058-1073.

[31]
Zhang T Y, Wang Y J, Zhang S R, et al. 2022c. An estimation and development model of tourism resource values at the township scale on Hainan Island, China. Plos One, 17(1): e0262837. DOI: 10.1371/journal.pone.0262837.

[32]
Zhu L T, Su H M, Zhang P, et al. 2018. A study on the spatial distribution of religious sites in Qinghai Province and the impact on tourism. Journal of Zhejiang University (Science Edition), 45: 625-633. (in Chinese)

[33]
Zhuang D C, Ding D S, Ren X S. 2003. Research on ecological tourism resources protection and exploitation of the wetland resources in China. Economic Geography, 23(4): 554-557. (in Chinese)

[34]
Zuo Y F, Chen H, Pan J C, et al. 2021. Spatial distribution pattern and influencing factors of sports tourism resources in China. ISPRS International Journal of Geo-Information, 10(7): 428. DOI: 10.3390/ijgi1007 0428.

Outlines

/