Tourism Resources and Its Integration with Cultural and Creative Industries

The Characteristics and Driving Factors of the Spatio-temporal Dynamic Evolution of Tourism Ecological Security in the Silk Road Economic Belt

  • WANG Shu , 1 ,
  • LIU Fenglian , 1, * ,
  • YANG Lei 1 ,
  • CAI Wei 2
Expand
  • 1. Institute of Land & Resources and Sustainable Development, Yunnan University of Finance and Economics, Kunming 650221, China
  • 2. Institute of Economic Research, Yunnan University of Finance and Economics, Kunming 650221, China
* LIU Fenglian, E-mail:

WANG Shu, E-mail:

Received date: 2023-07-21

  Accepted date: 2024-01-16

  Online published: 2024-07-25

Supported by

The Scientific Research Fund Project of Yunnan Education Department(2021J0592)

The Yunnan University of Finance and Economics Programme(2022D13)

The Graduate Student Innovation Fund Project of Yunnan University of Finance and Economics(2022YUFEYC10)

Abstract

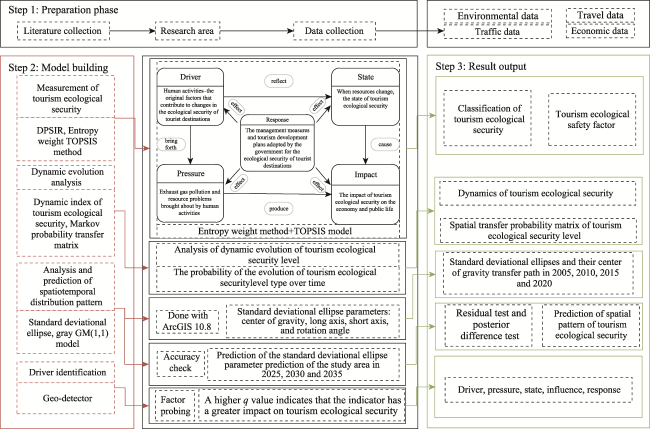
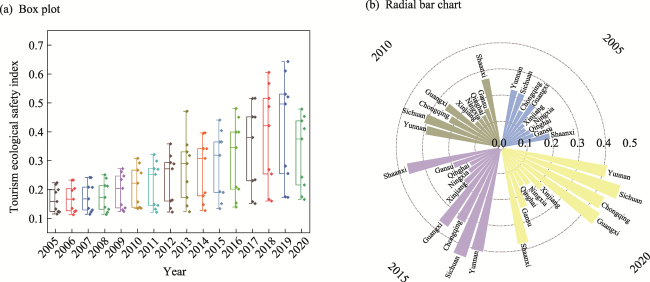
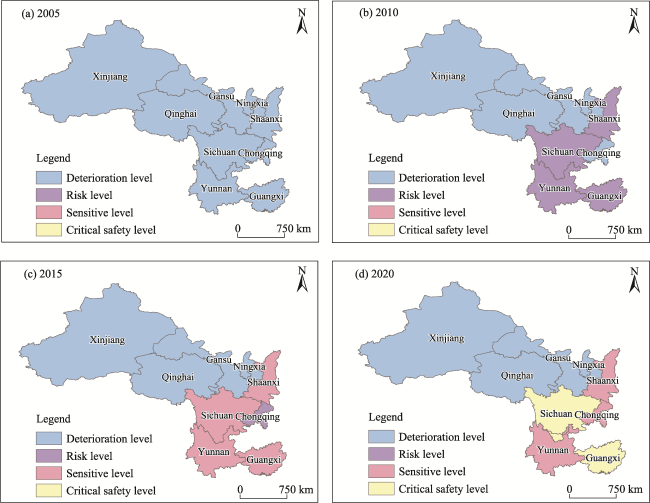
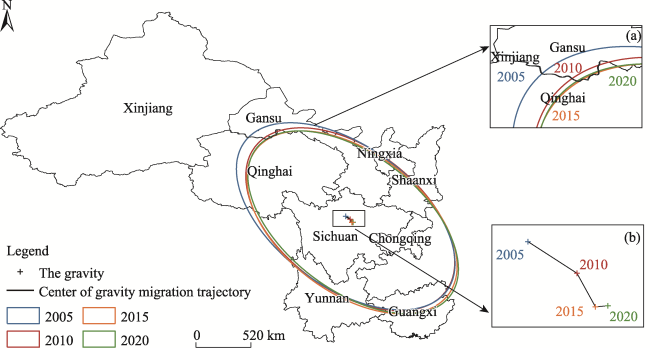
The exploration of ecological safety in tourism sites can provide a concrete path for sustainable tourism development in a region. Based on the “Driver-Pressure-State-Impact-Response” (DPSIR) model, we constructed an index system for the evaluation of tourism ecological security (TES) in the Silk Road Economic Belt (SREB) from 2005 to 2020. This index system was used to explore the characteristics of spatial and temporal dynamic evolution with the help of entropy weight TOPSIS method, dynamic index of TES and Markov probability transfer matrix, and a standard deviational ellipse (SDE) model and GM(1,1) model were constructed for spatial pattern analysis and prediction. The results indicate four key aspects of this system. (1) In terms of spatiotemporal evolution, the tourism ecological safety index (TESI) of the SREB increased, the TES levels of the northwestern and southwestern provinces and cities differed significantly, and the quality conditions of TES in the southwestern provinces and cities were better than in the northwest. (2) In terms of dynamic evolutionary characteristics, the speed of change at each level of the SREB was slow, but the level of TES has improved. The TES level has not shifted by leaps and bounds, and the shifts in the level type show “path dependence” and “self-locking” effects. (3) In terms of spatial and temporal distribution patterns, the spatial pattern of TES in the SREB is a “northwest-southeast” movement trend, and the spatial distribution appeared as “aggregation” from 2005 to 2020. The prediction results show that the center of gravity of TES in the SREB will shift to the southeast from 2025 to 2035, and the spatial spillover effect will be reduced. (4) In terms of driving factors, the number of star-rated hotels, and the amounts of industrial wastewater emissions, tourism foreign exchange earnings, forest coverage, and other parameters are the key factors affecting TES, and the booming tourism industry requires the interconnection and interpenetration of various factors. The results of this study can provide a reference for tourism development and ecological environmental protection in the Silk Road Economic Belt.

Cite this article

WANG Shu , LIU Fenglian , YANG Lei , CAI Wei . The Characteristics and Driving Factors of the Spatio-temporal Dynamic Evolution of Tourism Ecological Security in the Silk Road Economic Belt[J]. Journal of Resources and Ecology, 2024 , 15(4) : 1054 -1067 . DOI: 10.5814/j.issn.1674-764x.2024.04.024

1 Introduction

Tourism is a pivotal sector for global economic development and is leading the economic sector as far as the growth rate is concerned (Ahmad et al., 2018). It has been called “the smokeless industry” and “invisible trade” (Liu and Yin, 2022), and it is significant for solving the employment problem (Kronenberg and Fuchs, 2021), stimulating consumption, promoting investment, and enhancing foreign exchange (Sun et al., 2022). Because of its unique cross- cutting nature, tourism makes a significant contribution to the UN’s mission, particularly in achieving the Sustainable Development Goals (SDG) (United Nations, 2020). As a growth pole, tourism brings huge social and economic benefits, but it has also posed serious threats to the ecological environment. In addition, COVID-19 brought great challenges to the SDG of tourism (Villacé-Molinero et al., 2021). Therefore, promoting the harmonious development of tourism and ecology has become a worldwide concern.
Since the reform and opening up, China has created a variety of programs to encourage the expansion of tourism, which has enabled unprecedented tourism growth. If the relationship between tourism and ecology is not handled properly, the conflict between the two will become increasingly prominent, and it will be difficult for tourism to maintain a healthy development trend. Government intervention can advance tourism, and enhance the harmony between conservation and development, and China has made efforts to this end. These regulations are crucial for increasing the efficiency with which tourist resources are utilized and preventing ecological impacts (Ma and Tang, 2022). The Belt and Road (B&R) is an important practice platform for building a community with a shared future for mankind. More than 30 countries along the route have signed cooperation agreements on ecological protection while achieving the “Green Silk Road” construction (China Central Government Portal, 2018). Therefore, the issue of TES in the provinces along the SREB has certain practical significance.
Research on sustainable tourism development needs ecology as an important theoretical support (Zhang and Zhong, 2019). Ecological safety was first described as the fundamental right to ensure human life, health, and well-being, and to ensure that the ability of human beings to adapt to environmental change is not threatened (Lu and Hu, 2004). TES has been proposed by scholars based on the concept of “ecological safety”, which can be summarized as: the tourism destination ecosystem tends to be stable in structure and complex in function after reasonable tourism resource development and ecological environmental management. Moreover, TES is a material prerequisite for tourism development and can provide a broad environmental space for it. In addition, TES maintains the coordination and sustainability of the complex natural-social-economic ecosystem (Chen et al., 2022). Since the introduction of the term TES, its research content has been constantly updated, ranging from TES evaluation and measurement analysis (Zhang et al., 2008; Li et al., 2013) to the evolution of spatial and temporal patterns (Xiao et al., 2022), driving mechanism research (Ruan et al., 2019; Chen et al., 2020), obstacle factor identification (Zheng et al., 2017; Shi and Guan, 2022), trend prediction, and early warning (Xu et al., 2017; Wei and Li, 2021). The research perspective has integrated ecology, geography, tourism, and other disciplines, and the research scale has been refined from large-scale countries to provinces (Li and Chen, 2012; Xu et al., 2021).
On a finer scale, some scholars have systematically studied the TES of the Yangtze River Economic Belt (YREB) (Ma et al., 2021; Wang and Chen, 2021), watersheds (Mu et al., 2022), old revolutionary areas (Zhao and Guo, 2022), geoparks (Chen et al., 2022), nature reserves (Cao, 2006), mountain islands (Zhou et al., 2016), and river valley (Yang and Cao, 2020). The evaluation index system, which mainly evaluates the ecological safety of tourism, has been constructed by the following models: the “Pressure-State-Response” (PSR) model, “Pressure-State-Response and Social- Economic-Environment” (PSR-SEE) model, “Threat-Quality- Regulation” (TQR) model, “Carrying-Support-Attraction- Evolution-Development” (CSAED) model, and the “Driver- Pressure-State-Impact-Response” (DPSIR) model. Based on quantitative research, the most common methods used to conduct the measurement analysis are the linear weighting method, entropy-weighted TOPSIS method, improved TOPSIS method, and object element model. SDE, spatial autocorrelation analysis, spatial variance model, and Markov chains are frequently used to analyze the spatial patterns of ecological safety and their evolutionary aspects in tourist locations. To predict the trends of changes in TES, the radial basis function (RBF) or the GM(1,1) model is commonly used. Many scholars use the obstacle degree model, regression analysis method, gray correlation, and Geo-detector to pinpoint the driving factors affecting TES and investigate the driving mechanisms behind them. Although many scholars have provided abundant research results, they all focus on the static relationship between tourism development and environmental quality, with less attention to the dynamic process of the tourism system (Xu et al., 2022).
In view of this limitation, first, we built on previous research on the TES. The characteristics of spatial-temporal evolution and dynamic evolution in the SREB were assessed by the DPSIR model, the entropy-weight TOPSIS method, the dynamic index of TES, and the Markov probability transfer matrix. Second, we used SDE to map the spatial pattern of TES of the SREB from 2005 to 2020 and constructed the GM(1,1) model to predict the spatial pattern in the next 15 years (tthrough 2035) and analyzed its trends. Third, we selected the Geo-detector to identify the key factors affecting TES. Figure 1 shows the specific research framework. The research results can provide a theoretical foundation for decision-makers and a guide for advancing tourism and maintaining ecological security.
Fig. 1 The research framework for tourism ecological security in the Silk Road Economic Belt

2 Materials and methods

2.1 Study area

The regions along the northwest-southwest SREB consist of Shaanxi, Xinjiang, Gansu, Ningxia, Qinghai, Chongqing, Sichuan, Yunnan, Guangxi provinces and cities, covering an area of about 4.29×10⁶ km2 and including a variety of climate types such as subtropical monsoon climate, temperate monsoon climate, high-land mountain climate, and others. The total population of the region at the end of 2020 was 337.01×10⁶ people, with a GDP of 17.62×10¹² yuan. The SREB borders Mongolia, Russia, Kazakhstan, Kyrgyzstan, Tajikistan, Afghanistan, and Pakistan in the northwest, and Myanmar, Laos, and Vietnam in the southwest. There are 47 ethnic minorities living in the provinces and cities along the SREB. The diverse climate and colorful ethnic customs have created rich tourism resources in the region, and they have also nurtured a long-standing regional culture. By the end of 2020, there were 3631 national scenic spots in the provinces, with 80 5A tourist attractions. However, the shortage of natural resources due to the crude development of the tourism industry, coupled with the impact of the epidemic on tourism, led to a 38.64% reduction in tourism revenue in the region in 2020 compared to 2019.

2.2 Data sources

The DEM digital elevation data (90 m resolution) of the SREB were obtained from the Geospatial Data Cloud (http://www.gscloud.cn), and the administrative division data were obtained from the National Geographic Information Resources Catalogue Service (https://www.webmap.cn/). The panel data were mainly obtained from the statistical yearbooks of the nine provinces and cities along the SREB from 2006 to 2021, as well as the national economic and social development bulletins, environmental bulletins, and government websites; the China Tourism Statistical Yearbook, the China Transportation Statistical Yearbook, the China Environmental Statistical Yearbook, the China Regional Economic Statistical Yearbook, and the China City Statistical Yearbook. The linear interpolation method was used to calculate the missing data within the study period.

2.3 Index system and security level classification

2.3.1 Indicator system construction

A tourism destination is an ecosystem that integrates multiple factors such as resources, population and economy, and the quality of TES depends on these factors acting together and continuously. The DPSIR model is a model formed by the cyclic action of multiple factors (Cao, 2005). In this study, the DPSIR model was combined with TES to construct a theoretical framework for the evaluation of TES in SREB. In light of the existing studies and the actual conditions in the site, following the principles of scientific validity, coordination and data accessibility, 24 indicators were selected, and the significance of each indicator was analyzed to build a TES indicator system around the cycle and interactions of multiple subsystems such as economic- driven, population-driven and resource-driven parameters (Table 1).
Table 1 Evaluation index system of tourism ecological security in the Silk Road Economic Belt based on the DPSIR model
Target layer Guideline layer Metrics layer Unit Weight Indicator meaning
Driver Economically driven GDP per capita yuan 0.0366 Impact of economic conditions on the ecological
environment of tourist destinations
Population driven Natural population growth rate % 0.0116 Influence of population growth on the ecological
environment of tourist destinations
Resource driven Annual water consumption per capita m3 0.1068 Influence of resource use on the ecology of tourist places
Tourist driven Number of scenic spots above 3A level - 0.0657 Reflects the impact of tourism development on the ecological environment of tourist destinations
Pressure Environmental stress Industrial wastewater discharge t 0.0011 Impact of sewage discharge on the ecology of
tourist places
Sulfur dioxide emissions t 0.0130 Impact of sulfur dioxide emissions on air quality
in tourist destinations
Traffic stress Passenger volume person 0.0056 Pressure of the development of the transport industry on tourist destinations
Space index 104
person km-2
0.0041 Reflects the pressure that tourists put on the destination (number of tourists divided by the totalarea of the region)
Social pressure Visitor density % 0.0100 Reflects the degree of influence of tourists on the
destination (number of tourists divided by the
number of permanent residents in the area)
Population density 104
person km-2
0.0168 Reflects the occupation of tourist premises by
local residents (number of residents divided by the total area of the area)
State Environmental quality Forest coverage % 0.0552 Reflect the environmental quality of the tourist destination
Area of park green space per capita m2 0.0224
Greening coverage area in built-upareas ha 0.0418
Economic sources Tourism foreign exchange earnings million yuan 0.1048 Reflect the economic capacity of the tourist destination
Domestic tourism revenue million yuan 0.1011
Tourism resources Number of travel agencies - 0.0338 Reflects the pick-up capacity of the tourist place
Number of star-rated hotels - 0.0315
Social state Total number of tourists person 0.0820 Level of tourism development of the tourist site
Effect Tourism development Tourism revenue index % 0.0277 Extent to which tourism contributes to the local
economy
Proportion of tertiary industry % 0.0307 Macroeconomic situation of tourism development
Natural disaster Direct economic losses caused by natural disasters 104 yuan 0.0850 Macroeconomic impact of natural disasters
Response Talent response Number of students enrolled in
ordinary colleges and universities
person 0.0493 Reflects the level of talent supply
Environmental response Urban sewage treatment rate % 0.0093 Sewage treatment capacity
Government regulation Investment in environmental pollution
control
104 yuan 0.0541 Funding efforts to protect the environment

Note: “Weights” are calculated from formulas (1) to (3) in 2.4.1. The weight of an indicator denotes the relative importance of that indicator in the overall evaluation indicator system.

2.3.2 Security level classification

Since the classification standard for the evaluation of TES is not unified, drawing on the research results of other scholars (Li et al., 2017) and accounting for the realistic conditions of the SREB, TES was divided into seven levels. Table 2 shows the TESI and the corresponding safety level.
Table 2 Classification standards of tourism ecological security in the Silk Road Economic Belt
TESI 0<TESI≤0.25 0.25<TESI≤0.35 0.35<TESI≤0.45 0.45<TESI≤0.55 0.55<TESI≤0.65 0.65<TESI≤0.75 0.75<TESI≤1
Security status Deterioration level Risk level Sensitive level Critical safety level General security level Relative security level Very secure level

2.4 Methods

2.4.1 Measurement method of TESI—The Entropy TOPSIS method

(1) Entropy-weighted method
Firstly, we constructed a system of indicators of TES in the SREB, distinguishing between positive and negative indicators.
Secondly, we constructed the matrix and unified the indicator types, including n evaluation objects and m evaluation indicators composed of the matrix, and all indicators were index normalized.
Thirdly, we normalized the data and then calculated the entropy value Ej:
${{P}_{ij}}=\frac{{{X}_{ij}}}{\sqrt{\sum\limits_{i=1}^{n}{X_{ij}^{2}}}}$
${{E}_{j}}=\frac{1}{\ln n}\underset{i=1}{\overset{n}{\mathop \sum }}\,{{P}_{ij}}\ln {{P}_{ij}}\left( i=1,\ 2,\ \cdots \,\ n;j=1,\ 2,\ \cdots,\ m \right)$
where n stands for the evaluation object; Pij stands for the weight of the i-th evaluation object with respect to the j-th indicator; and Xij stands for the standardized indicator.
Finally, the weights of each index were calculated by the entropy value ${{\omega }_{j}}$:
${{\omega }_{j}}=\frac{{{E}_{j}}}{m\sum\limits_{j=1}^{m}{{{E}_{j}}}}$
(2) TOPSIS model
The weighting matrix Z was constructed,
Z=${{\left( {{z}_{ij}} \right)}_{n\times m}}$
${{z}_{ij}}={{\omega }_{j}}\times {{P}_{ij}}$
Positive and negative ideal solutions were determined, where the positive ideal solution $Z_{j}^{+}$ and the negative ideal solution $Z_{j}^{-}$ are the maximum and minimum values of the weighted matrix Z=${{\left( {{z}_{ij}} \right)}_{n\times m}}$, respectively.
The distance between the evaluation object and the maximum value was calculated.
$D_{i}^{+}=\sqrt{\underset{j=1}{\overset{m}{\mathop \sum }}\,{{\omega }_{j}}{{\left( Z_{j}^{+}-{{z}_{ij}} \right)}^{2}}}$
The distance between the evaluation object and the minimum value was calculated.
$D_{i}^{-}=\sqrt{\underset{j=1}{\overset{m}{\mathop \sum }}\,{{\omega }_{j}}{{\left( Z_{j}^{-}-{{z}_{ij}} \right)}^{2}}}$
The proximity (${{S}_{i}}$) was calculated as follows:
${{S}_{i}}=\frac{D_{i}^{-}}{D_{i}^{+}+D_{i}^{{}}}\begin{matrix} {} & {} \\ \end{matrix}(0\le {{S}_{i}}\le 1)$
where Si represents the TESI. The larger the Si, the closer it is to the maximum value, which means that the quality of TES is better.

2.4.2 Analysis of the dynamic evolution of TES-dynamic index of TES and Markov probability transfer matrix

(1) TES dynamic index (TDI)
We applied the index of land use dynamics to the study of TES, which can reflect the rate of change of its level in the SREB (Li et al., 2017). The expression is:
$~~~TD{{I}_{{{\theta }_{s}}=}}\frac{{{N}_{{{\theta }_{s}},t}}{{N}_{{{\theta }_{s}},0}}}{{{N}_{{{\theta }_{s}},0}}}\times \frac{1}{T}\times 100\%$
where T represents the study period; ${{\theta }_{s}}$ represents the TES level; and ${{N}_{{{\theta }_{s}},0}}$ and ${{N}_{{{\theta }_{s}},t}}$ represent the numbers of provinces and cities in the initial and final stages of the T, respectively.
(2) Markov transfer probability matrix
The Markov shift probability matrix can determine the probability of a change in the type of TES level over time. The matrix is denoted as $={{({{m}_{xy}})}_{a\times b}}$, and the elements of the matrix ${{m}_{xy}}$ stand for the probability that a province or city with a TES level of ${{\theta }_{x}}$ at the beginning of the study period is transformed into ${{\theta }_{y}}$ at the end of the study period (Li et al., 2017; Mu et al., 2022). The expression is:
${{m}_{xy}}=\frac{{{N}_{xy}}}{{{N}_{x}}}$
where ${{N}_{xy}}$ stands for the number of provinces and cities with TES level rating of ${{\theta }_{x}}$ at the beginning of the study period transformed to ${{\theta }_{y}}$ at the end, and ${{N}_{x}}$ stands for the number of provinces and cities whose TES level at the beginning of the study period belongs to ${{\theta }_{x}}$.

2.4.3 Analysis and prediction of the spatial and temporal distribution pattern of TES-SDE and the GM(1,1) model

(1) SDE. The analysis of the geographical distribution pattern of TES on the SREB was carried out using the parameters of the center of gravity, long and short axis, and rotation angle of the SDE, which respectively, show the spatial movement, the spatial spillover effect, and the development trend of the TES quality (Wang and Chen, 2021). The calculation of related parameters was completed with the help of ArcGIS 10.8.
(2) GM(1,1) model. The GM(1,1) model was generated cumulatively for the original data with equal time spacing, with the columns generated in one accumulation as the original observations. The solution of the first-order linear constant coefficient differential equation presents the data law, and the model for the development changes can be constructed to predict the data obtained by that law. The model was used to predict the changes in the standard deviational elliptic parameters for the next 15 years, and the function is expressed as:
$\frac{\text{d}{{x}^{(1)}}}{\text{d}t}+a{{x}^{(1)}}=u$
Equation (11) is the first order linear constant coefficient differential equation of the GM (1,1). Furthermore, we defined${{x}^{(0)}}=\left\{ {{x}^{(0)}}(1),{{x}^{(0)}}(2),{{x}^{(0)}}(3)\cdots \cdots {{x}^{(0)}}(m) \right\}$ as the original sequence and ${{x}^{\left( 1 \right)}}$ =$\left\{ {{x}^{(1)}}(1),{{x}^{(1)}}(2),{{x}^{(1)}}(3)\cdots \cdots {{x}^{(1)}}(m) \right\}$ as its primary cumulative generating series, where t is the time series and the a and u terms are the model parameters.
${{x}^{(\overset{\scriptscriptstyle\smile}{1})}}(t+1)=\left[ {{x}^{0}}(1)-\frac{u}{a} \right]{{\text{e}}^{-at}}+\frac{u}{a}$
Equation (12) is the standard-type solution corresponding to GM(1,1), which is obtained by solving for Equation (11), and e is a natural constant.

2.4.4 TES identification of impact factors—Geo-detector

The Geo-detector is based on the “law of spatial heterogeneity”, so it operates by detecting spatially localized heterogeneity and spatially stratified heterogeneity to identify driving factors. This study was based on ArcGIS10.8 and the elements were divided into five categories using the natural breakpoint grading method, so that they were transformed into type variables. The Geo-detector’s factor detection was used to obtain the q-value, and its magnitude indicates the degree of influence of each factor on the TESI. The core idea is that if certain factors have an important influence on TES, then these factors and the spatial distribution should have similarities. This would allow us to pinpoint the primary influences on the degree of ecological safety at tourist destinations (Wang and Xu, 2017). The formula is as follows:
$q=1-\frac{1}{N{{\sigma }^{2}}}\underset{i=1}{\overset{n}{\mathop \sum }}\,{{N}_{i}}\sigma _{i}^{2}$
where q$\left[ 0,1 \right]$; N is the number of all samples in the study site; and $\sigma _{i}^{2}$ is the variance of the i-th sample point. The value of q reflects the degree of spatial differentiation, and a larger q indicates a greater influence of the indicator on TES.

3 Results

3.1 The spatial and temporal evolution of TES

3.1.1 Temporal evolution analysis

Equations (1)-(8) were applied to calculate the tourism TESI of each province and city in the SREB, and the TES situation was obtained (Fig. 2).
Fig. 2 Box plot and radial bar chart for tourism ecological security in the Silk Road Economic Belt

Note: (a) Changes in the overall TESI from 2005 to 2020; (b) Changes in the TES in each region within the box in 2005, 2010, 2015, and 2020.

As shown in the box plot (Fig. 2a), with the median line as the reference object, the overall TES value of the nine provinces and cities in the SREB increased in waves and then decreased over time, and the median TESI values sorted by year were: 2019 (0.497)>2018 (0.421)>2017 (0.381)>2020 (0.375)>2016 (0.345)>2015 (0.319)>2014 (0.308)>2013 (0.290)>2012 (0.272)> 2011 (0.252)>2010 (0.222)>2009 (0.204)>2008 (0.173)>2007 (0.167)>2006 (0.166)>2005 (0.158). From 2018 to 2019, the level of TES improved the fastest, from 0.421 to 0.497; in 2019-2020, the decline was the most obvious, with a reduction of 24.52%. From the perspective of box length, the differences in TESI of different provinces and cities fluctuated and showed an expanding trend. To visualize the changes in TES more intuitively, the TESI in 2005, 2010, 2015, and 2020 were used to make a radial bar chart (Fig. 2b). In the counterclockwise direction, the differences in the levels of the nine regions are gradually more significant, and the expansion trend becomes clearer. The levels of all regions increased during the study period, with Yunnan, Sichuan, Chongqing, Guangxi, and Shaanxi showing more prominent performance.

3.1.2 Spatial evolution analysis

The data in Fig. 3 show that the TES level of the region includes areas at the deterioration level, risk level, sensitive level, and critical safety level, and their distribution presents a spatial pattern of “high in the southwest and low in the northwest”. The overall quality of TES is not high, but there is some momentum toward good development from 2005- 2020.
Fig. 3 Spatial distribution of tourism ecological security levels in the Silk Road Economic Belt

Note: General security level, relative security level, and very secure level did not exist during the study period, so only the deterioration level, risk level, sensitive level, and critical safety level are present in the figure.

From 2005 to 2010: In 2005, the SREB degree of TES throughout the whole region was only at the deteriorated level. This period was mainly affected by natural disasters, which had a serious impact on environmental protection and tourism development. After 2005, the domestic tourism industry gradually developed. In 2006, the “Eleventh Five- Year Plan for the Development of China’s Tourism Industry” suggested that tourism should be developed as a significant industry in the national economy. Since tourism promotion is often accompanied by the problem of unreasonable development of tourism resources, it is crucial to promote the development of the former comprehensively based on the protection of the latter. Sulfur dioxide emissions and total industrial wastewater both dramatically declined during this time in the research region. The 2008 Beijing Olympic Games boosted Chinese tourism, and the TESI showed a considerable upward trend, but the rapid growth of tourism also increased passenger traffic, the density of tourists, and the spatial index, which brought great pressure to the environmental carrying capacity. In 2009, the “State Council on Accelerating the Development of Tourism Opinions” emphasized the need for resource efficiency and energy conservation to realize sustainable tourism in China. During this time, considerably more money was invested in the research area’s efforts to reduce environmental pollution. By 2010, the SREB showed a “two-tier” pattern, except for Shaanxi Province and Chongqing. The northwestern provinces (Xinjiang, Gansu, Ningxia, and Qinghai) were at the deterioration level, while the southwestern provinces and cities (Sichuan, Yunnan, and Guangxi) were at the risk level. As a result of the World Exhibition or Exposition in 2010, the tourist industry expanded throughout the year and realized a significant increase in foreign currency profits, both of which aided in the industry’s growth. During 2005‒2010, Shaanxi, Sichuan, Yunnan, and Guangxi were the provinces that changed from the deterioration level to the risk level.
From 2010 to 2015: The “Eleventh Five-Year Plan for China’s Tourism Development” emphasized that tourism is a strategic industry for the national economy, and thus it is essential to enhance China’s competitiveness in the world TES. In 2013, the formation of the strategic concept of the SREB and the implementation of the “Tourism Law of the People’s Republic of China” marked not only a further standardization of the tourism market but also a new stage in the development of Chinese tourism. The data show that the protection of TES has been enhanced and the trend is positive. In 2013, after the major initiative of the SREB was put forward, its TESI increased by 6.59% compared with the previous year. Except for Shaanxi, the degree of TES in the northwestern provinces remained the same in 2015 as it was in 2010, and the TES levels of Yunnan, Guangxi, and Sichuan provinces were raised from the risk level to the sensitive level, and Chongqing was raised from the deterioration level to the risk level.
From 2015 to 2020: Sichuan and Guangxi moved from the sensitive level to the critical safety level, and Chongqing changed from the risk level to the sensitive level. China had designated 2015 as the “Beautiful China-Silk Road Tourism Year”, which correlated with the building of beautiful China and the realization of the great Chinese dream associated with building the Silk Road and developing tourism. The TESI in the study site rose across the board by 2019. The establishment and application of the concepts of innovation, coordination, green, openness, and sharing, as well as the development of tourism as a vital driving force for economic transformation and upgrading, are highlighted in the “Thirteenth Five-Year Plan for Tourism Development”. The proportions of the region at the deterioration level, sensitive level, and critical safety level in 2020 were 44.44%, 33.33%, and 22.22%, respectively.

3.2 Analysis of the dynamic evolution of TES features

3.2.1 Speed of change analysis

The dynamics of TES reflect the speed of change for each TES level. The data in Table 3 show that the deterioration level had the fastest rate of change (8.89%) from 2005 to 2010, and the dynamic index of the risk level is given as “*”, which shows that over this time, the quality of TES had increased, and the provinces and cities at that risk level appeared for the first time. The number of provinces and cities that fell under the deterioration and risk levels decreased from 2010 to 2015 at average annual rates of 4.00% and 15.00%, respectively, and the provinces and cities belonging to the risk level changed faster than those at the deterioration level. From 2015 to 2020, the speed of change of the TES level was in the following order: risk level (-20.00%), sensitive level (-5.00%), and deterioration level (0.00%). Note that the risk level and the sensitive level show negative changes, indicating a reduction in the number of areas belonging to each one. The 0.00% movement of the deterioration level indicates that the number of areas belonging to the deterioration level in 2015 did not change compared to 2020. Over the whole study period, some provinces and cities at the sensitive and critical security levels appear at the end of the SREB while there were none at the beginning. Although the rate of change in the levels is slow, we can see that the quality of TES has improved, and the number of regions belonging to the deterioration level decreased at a pace of 3.70% each year on average.
Table 3 Dynamics of tourism ecological security levels in the Silk Road Economic Belt
TES level 2005-2010 2010-2015 2015-2020 2005-2020
Deterioration level -8.89% -4.00% 0.00% -3.70%
Risk level * -15.00% -20.00% -
Sensitive level - * -5.00% *
Critical safety level - - * *
General security level - - - -
Relative security level - - - -
Very secure level - - - -

Note: “-” indicates that the level did not appear in any of the provinces or cities at the beginning and end of the study period; “*” indicates that the level did not appear in any of the provinces or cities at the beginning of the study period, but it did appear at the end.

3.2.2 Transfer characteristic analysis

By constructing the Markov shift probability matrix (Table 4), the characteristics of dynamic shifts in the TES level of the SREB in 2005 and 2020 can be revealed. Table 6 shows that the values along the diagonal line are lower than those along the non-diagonal line, indicating that the probability of a change that is not in this region's level of TES is lower than the probability that there is a change. For the deterioration level, the probability of maintaining the original level is 0.444, and the probability of shifting upward is 0.556, which means that the provinces and cities at the deterioration level of TES have a higher possibility of upgrading to a better level. The probabilities of changing to the risk level, sensitive level, and critical safety level were 0, 0.333, and 0.222, respectively. This not only indicates an improvement in the quality and a tendency toward good development of the TES during the study period but also that tourism activities had developed in harmony with ecological environmental protection.
Table 4 Spatial transfer probability matrix of tourism ecological security levels in the Silk Road Economic Belt from 2000 to 2020
TES level Deterioration
level
Risk
level
Sensitive
level
Critical
safety level
Deterioration level 0.444 0.000 0.333 0.222
Risk level 0.000 0.000 0.000 0.000
Sensitive level 0.000 0.000 0.000 0.000
Critical safety level 0.000 0.000 0.000 0.000

3.3 The SDE of TES analysis and trend forecast

Based on the above analysis of the spatial-temporal evolution of TES in the SREB, the SDE and GM(1,1) models were built to further analyze the spatial pattern characteristics of TES in the region and explore the future evolution of the patterns. This analysis can reveal the TES spatial pattern characteristics in a more thorough and multifaceted manner.

3.3.1 SDE analysis of TES

The SDE parameters (coordinates of the center of gravity, long and short axis, and rotation angle) of TES in the SREB from 2005 to 2020 were obtained by using the ArcGIS Desktop spatial statistics module, and the changes in the center of gravity, long and short axis and rotation angle were analyzed to obtain the distribution pattern of TES (Fig. 4 and Fig. 5).
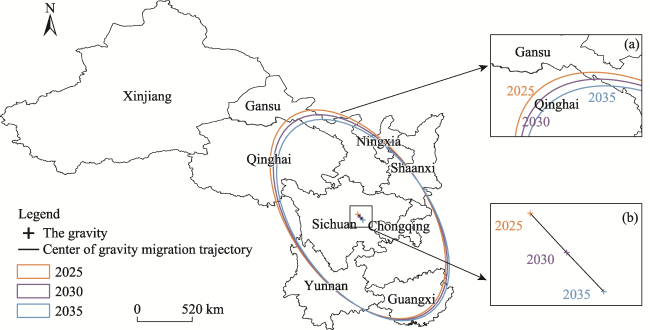
Fig. 4 The standard deviational ellipse and gravity center transfer path of tourism ecological security in the Silk Road Economic Belt

Note: Fig. 4a shows the specific position of the SDE after zooming in while; Fig. 4b shows the center of gravity offset trajectory, indicating the horizontal spatial movement of TES.

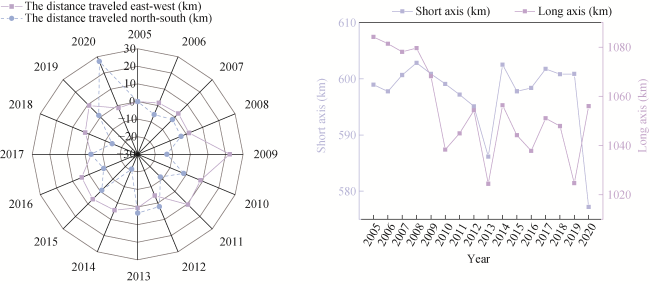
Fig. 5 The displacement of the gravity center of tourism ecological security in the Silk Road Economic Belt and the variations of the short and long axes from 2005 to 2020

Note: The radar plot indicates the distance that the center of gravity has moved, with values greater than 0 indicating movement to the east and north, while those less than 0 indicate movement to the west and south, respectively.

Figure 4 shows the significant spatial evolutionary characteristics of TES in the SREB. In terms of the shift of the center of gravity, the time-frame can be divided into two phases using 2015 as a turning point. The center of gravity of TES shifted to the southeast from 2005 to 2015, while a northeastern shift trend was shown from 2015 to 2020. The reason is that although the northwestern provinces are rich in resources, they also have some problems such as the difficulty of development and a weak cultural and economic base, so the advantages of developing tourism are not obvious, and the center of gravity of TES shifted to the southeast. In recent years, the SREB has been officially given historical status, and the implementation of policies such as the “Vision and Action for Promoting the Construction of the Silk Road Economic Belt and the 21st-Century Maritime Silk Road” has leveraged the tourism advantages of each region and strengthened communication with countries along the SREB. These factors have promoted tourism development, especially in the northwest, while the rapid rise of the tourism economy in the east has also driven the SDE of TES to the east.
In terms of shape (Fig. 5), the long axis of the SDE is always larger than the short axis, and the overall trend of movement is "northwest to southeast". In terms of the distance moved, the total displacement of the center of gravity of the SDE between 2005 and 2020 was 116.90 km, and the total distance of east-west movement was 1.24 times the total distance of north-south movement. The distance shifted to the east exceeds the distance shifted to the west, and the distance shifted to the south exceeds the distance shifted to the north. In terms of area, the area of the SDE decreased from 20.40×10⁵ km2 in 2005 to 19.54×10⁵ km2 in 2010, while the long axis fluctuated from 1084.16 km to 1038.35 km and the short axis fluctuated from 598.94 km to 599.07 km. The distribution range of SDE exhibited a shrinking trend throughout the period, and the spatial distribution pattern of TES became more extended from west to east and contracted from north to south. From 2010 to 2015, the area of the SDE increased slightly from 19.54×10⁵ km2 to 19.61× 10⁵ km2, while the long axis fluctuated from 1038.35 km to 1044.17 km, and the short axis fluctuated from 599.07 km to 597.77 km, indicating that the TES of the SREB expanded from west to east and shrunk from north to south during this period. From 2015 to 2020, the area was reduced from 19.61×10⁵ km2 to 19.15×10⁵ km2, the long axis was extended from 1044.17 km to 1055.99 km, and the short axis was shortened from 597.77 km to 577.17 km, which indicates that the spatial distribution of TES expanded from west to east and contracted from north to south.

3.3.2 TES spatial pattern forecast

The prediction model of TESI for the provinces and cities along the SREB from 2005 to 2020 is based on the GM(1,1) model. The residual test results show that the model fits well and that the average relative error is less than 0.5%. Additionally, the accuracy of the small error probability and the posterior difference ratio are qualified and barely qualified, respectively, demonstrating the high reliability of the GM(1,1) model’s prediction results. On this basis, the SDE was drawn using ArcGIS 10.8 based on the predictions for 2025, 2030, and 2035 (Fig. 6).
Fig. 6 The prediction of the spatial pattern of tourism ecological security in the Silk Road Economic Belt
According to the findings of the forecast, the center of gravity of TES in the SREB will shift to the southeast in 2025-2035, with a total displacement of 145.61 km, including 70.08 km and 75.53 km to the east and south, respectively. The above data show that the center of gravity of TES in the SREB will continue to shift to the southwestern provinces and cities in the future, and the southwestern provinces and cities may become the key areas for the high-quality development of TES in the future. For the rotation angle, the forecast period shows a small counterclockwise rotation, indicating that the “northwest to southeast” distribution pattern of TES in the SREB will be further strengthened in the future. For the SDE area, the spatial distribution range of TES in the SREB will become smaller, with the area decreasing from 18.97×10⁵ km2 to 18.35×10⁵ km2. The long axis and short axis will be reduced from 1021.54 km and 591.16 km to 996.48 km and 586.14 km, respectively. These results indicate that TES will be clustered in the north-south and east-west directions, and the spatial spillover effect will be reduced. From these results, we see that in the future period, the improvement of TES quality in the SREB mainly relies on the southwestern tourism provinces and cities such as Sichuan, Chongqing, Yunnan, and Guangxi. The quality of TES in this study area shows uneven development, in which the southwestern regions have higher TES quality than the northwestern areas.

3.4 Driving factors of TES

The influencing factors which play a key role in the high-quality development of tourism were identified. The results in Table 5 show that there are differences in the degree of influence on TES among the factors.
Table 5 The factors influencing tourism ecological security in the Silk Road Economic Belt (q-values)
Target layer Guideline layer Metrics 2005 2010 2015 2020 Mean
Driver Economically driven GDP per capita 0.685 0.591 0.481 0.411 0.542
Population driven Natural population growth rate 0.330 0.308 0.232 0.468 0.334
Resource driven Annual water consumption per capita 0.402 0.560 0.547 0.538 0.512
Tourist driven Number of scenic spots above 3A level 0.565 0.707 0.335 0.602 0.553
Pressure Environmental stress Industrial wastewater discharge 0.673 0.877 0.829 0.535 0.729
Sulfur dioxide emissions 0.411 0.418 0.190 0.486 0.377
Traffic stress Passenger volume 0.456 0.419 0.699 0.431 0.501
Space index 0.465 0.467 0.499 0.658 0.522
Social pressure Visitor density 0.142 0.566 0.614 0.469 0.448
Population density 0.648 0.107 0.098 0.171 0.256
State Environmental quality Forest cover 0.648 0.763 0.695 0.579 0.671
Park green space per capita 0.668 0.519 0.448 0.325 0.490
Greening coverage area in built-up areas 0.408 0.554 0.497 0.587 0.512
Economic sources Tourism foreign exchange earnings 0.577 0.707 0.650 0.913 0.712
Domestic tourism revenue 0.542 0.428 0.351 0.913 0.558
Tourism resources Number of travel agencies 0.650 0.219 0.407 0.744 0.505
Number of star-rated hotels 0.920 0.901 0.512 0.744 0.769
Social state Total number of tourists 0.846 0.428 0.485 0.578 0.584
Effect Tourism development Tourism revenue index 0.649 0.456 0.626 0.658 0.597
Proportion of tertiary industry 0.064 0.358 0.507 0.949 0.469
Natural disaster Direct economic losses caused by natural disasters 0.751 0.585 0.602 0.427 0.591
Response Talent response Number of students enrolled in ordinary colleges and universities 0.431 0.492 0.584 0.530 0.509
Environmental response Urban sewage treatment rate 0.318 0.523 0.218 0.356 0.354
Government regulation Investment in environmental pollution control 0.551 0.738 0.336 0.693 0.579
In terms of the average q-values in 2005, 2010, 2015 and 2020, the degrees of influence of the factors on the TESI of the SREB are ranked as follows: number of star-rated hotels (0.769) > industrial wastewater emissions (0.729) > tourism foreign exchange earnings (0.712) > forest cover (0.671) > tourism revenue index ( 0.597) > direct economic loss caused by natural disasters (0.591) > total number of tourists (0.584) > investment in environmental pollution control (0.579) > domestic tourism revenue (0.558) > number of scenic spots above grade 3A (0.553) > GDP per capita (0.542) > space index (0.522)> annual water consumption per capita (0.512)> greening coverage area in built-up areas (0.512)> number of students enrolled in ordinary colleges and universities (0.509)> number of travel agencies (0.505)> passenger volume (0.501)> area of park green space per capita (0.490)> proportion of tertiary industry (0.469)> tourist density (0.448) > sulfur dioxide emissions (0.377) > urban sewage treatment rate (0.354) > natural population growth rate (0.334) > population density (0.256). Note that the values retain three decimal places leading to partial equality, so for those with equal data, they are ranked according to the original values. These data show that the ability of tourist places to receive tourists, the ecological environment, and local economic capacity are important aspects that affect the level of TES in the SREB.
The drivers in the target layer were also analyzed.
(1) From the driver layer, GDP per capita and the number of scenic spots above the 3A level are important factors influencing the SREB. The former shows a decreasing trend, suggesting that the influence of economic growth on improving TES is diminishing; the latter shows a fluctuating increasing trend, indicating that the tourism drive still maintains a greater influence on TES.
(2) From the pressure layer, the mean q-values of industrial wastewater discharge, passenger volume, and space index are larger, which shows that TES is mainly influenced by these three factors. Industrial wastewater emissions and passenger volume show fluctuating downward trends, with q-values decreasing from 0.673 and 0.456 in 2005 to 0.535 and 0.431 in 2020, indicating that the influences of environmental changes and traffic pressure on TES are decreasing. In contrast, the increasing degree of tourist occupation of the tourist destinations is indicated by the rising spatial index, and the carrying capacity of the environment will be impacted by the growth in the number of visitors.
(3) From the state layer, tourism foreign exchange earnings reflect the economic capacity of the tourist destination, and its q-value increased from 0.577 to 0.913, indicating that the degree of influence of tourism foreign exchange income on TES of the SREB has been strengthened. The overall trend for the number of star-rated hotels is decreasing, and its mean q- value was the highest at 0.769 from 2005 to 2020, indicating that the number of star-rated hotels has the greatest impact on the quality of TES in the SREB. The q-value of forest cover shows a trend of rising and then falling.
(4) From the effect layer, the tourism revenue index and direct economic losses caused by natural disasters have a significant impact on the TES.
(5) From the response layer, investment in environmental pollution control and the number of students enrolled in general colleges and universities are important factors influencing a well-functioning system of TES in the SREB. Their q-values increased from 0.431 and 0.551 in 2005 to 0.530 and 0.693 in 2020, respectively, with the former q-value means greater than the latter.

4 Discussion

There are multiple stakeholders in the process of sustainable tourism development (Zhang et al., 2022a), and the study of TES may serve as a guide for the growth of tourism in the nations, provinces, and towns along the route. As a practical platform for building a community of human destiny, the SREB should be an organic and coordinated whole, and tourism is one of the important constraints to its coordinated development (Zhang et al., 2022b). According to the results of this study, we can construct the Silk Road tourism ecological security development platform from three aspects.
(1) At present, there are significant differences in the tourism ecological levels of the northwestern and southwestern provinces and cities of the Silk Road Economic Belt, which will be further strengthened in the future. Therefore, the tourism resources of the northwestern provinces and cities can be used to formulate relevant policies and measures to promote the green Silk Road “integration” to narrow the differences. At the same time, tourism alliance organizations can be established in the northwestern region bordering Mongolia, Russia, Kazakhstan, Kyrgyzstan, Tajikistan, Afghanistan, Pakistan, India and other countries, to promote the development of tourism in the northwestern region. These efforts will promote the development of tourism in the Northwest Region.
(2) The transfer of the tourism eco-safety level in the Silk Road Economic Belt has the effects of “path dependence” and “self-locking”, and it is very difficult to improve the quality of tourism eco-safety, so the residents can be called upon to consciously fulfill the requirements of low-carbon travel and a low-carbon lifestyle. Improving the quality of tourism ecological safety is difficult. Enterprises should also take on the corresponding social responsibility to save energy and resources as the standard of green production and do a good job of supervision in this regard.
(3) The results of the study show that the number of star-rated hotels has the greatest positive effect, so local governments should focus on improving their ability to receive tourists, creating special boutique tourism routes and tourism products, and improving the attractiveness of regional tourism. The negative inhibitory effect of industrial wastewater discharge is the strongest, so industrial wastewater recycling should be promoted to improve the intensive utilization of industrial water resources. These indicators are an important way to comprehensively improve the ecological safety level of tourist places, and the combination of long-term measures and short-term measures is an important initiative for improving the quality of tourism ecological safety.
There are also some shortcomings in this study, due to the limitations of data acquisition, the study area being too macroscopic, the failure to refine the analysis to prefecture-level cities, and the failure to carry out spatial autocorrelation analysis for a more in-depth understanding of the spatial changes in the neighboring areas of the Silk Road Economic Belt. In future research, the study area should be refined to analyze the radiation effects of neighboring areas. In addition, this study did not include data on land use, so in the future, in addition to the statistical yearbook data, a greater diversity of data sources should be considered in order to further enrich the research results on tourism ecological security.

5 Conclusions

Based on the evaluation index system of TES of the SREB, this study quantitatively evaluated the spatio-temporal dynamic evolution characteristics of the quality of TES in the study area, predicted the spatio-temporal distribution pattern from 2020 to 2035, and identified the driving factors. The main conclusions are fivefold.
(1) In time, the TESI of the SREB has increased from 0.158 to 0.375, and it shows a trend of increasing and expanding. The safety status has risen from the level of deterioration to the level of sensitivity.
(2) Spatially, the quality of TES in the southwest of the SREB is better than that in the northwest, and the level is advancing from low to medium-high. In the study area, the number of provinces and cities with deterioration levels is decreasing, and the number with critical safety levels is increasing, which indicates that the TES quality is in a crucial stage of transition from a low level to a high level.
(3) In terms of the dynamic evolution characteristics, some areas with critical safety levels appear at the end of the SREB compared with none at the beginning, but the speed of change is slow for each level. Since the probability of no change in the level is smaller than the probability of a change, and there is no jump transfer, the transfer of the level type has a “path dependence” and “self-locking” effect, which makes it difficult to improve the quality of TES.
(4) In terms of spatial and temporal distribution patterns, the spatial pattern of TES shows a trend of “northwest- southeast”, and the distribution range is characterized by “aggregation”. The prediction results show that the center of gravity of TES in the SREB will shift to the southeast from 2020 to 2035, and the distribution pattern of “northwest- southeast” will be further strengthened. The distribution pattern in the north-south and east-west directions will show a clustering trend, and the spatial spillover effect will be reduced.
(5) In terms of driving factors, the level of TES is most strongly affected by the “state” and “influence” characteristics. From the indicator level, the quality of TES is comprehensively influenced by the number of star-rated hotels, industrial wastewater emissions, tourism foreign exchange earnings, and forest coverage rate in the area. Among them, the positive effect of star-rated hotels is the largest, and the negative inhibitory effect of industrial wastewater emissions is the strongest.
[1]
Ahmad F, Draz M U, Su L, et al. 2018. Tourism and environmental pollution: Evidence from the One Belt One Road provinces of Western China. Sustainability, 10: 3520. DOI: 10.3390/su10103520.

[2]
Cao H J. 2005. An initial study on DPSIR model. Environmental Science & Technology, 28(6): 110-111. (in Chinese)

[3]
Cao X X. 2006. Ecological security evaluation of tourism destination based on ecological footprint analyses. Economic Geography, 26(6): 1062- 1066. (in Chinese)

[4]
Chen L, Song X L, Bu X Y. 2020. Dynamic evaluation and driving mechanism of tourism ecological security in Ningxia Hui Autonomous Region. Research of Soil and Water Conservation, 27(6): 278-284. (in Chinese)

[5]
Chen M, Zheng L, Zhang D, et al. 2022. Spatio-temporal evolution and obstacle factors analysis of tourism ecological security in Huanggang Dabieshan UNESCO Global Geopark. International Journal of Environmental Research and Public Health, 19(14): 8670. DOI: 10.3390/ijerph19148670.

[6]
China Central Government Portal. 2018. 5 years since President Xi Jinping proposed the “Belt and Road” Initiative: A great practice for building a community of human destiny. http://www.gov.cn/xinwen/2018-10/05/content_5327979.htm. Viewed on 2022-11-23. (in Chinese)

[7]
Kronenberg K, Fuchs M. 2021. Aligning tourism’s socio-economic impact with the United Nations’ sustainable development goals. Tourism Management Perspectives, 39: 100831. DOI: 10.1016/j.tmp.2021.100831.

[8]
Li S J, Chen Y Y. 2012. Assessment of ecological security of coastal wetland tourism in Shandong Province. Scientific and Technological Management of Land and Resources, 29(4): 6-13. (in Chinese)

[9]
Li X G, Wu Q, Zhou Y. 2017. Spatio-temporal pattern and spatial effect of Chinese provincial tourism eco-security. Economic Geography, 37(3): 210-217. (in Chinese)

[10]
Li Y J, Chen T, Hu J, et al. 2013. Tourism ecological security in Wuhan. Journal of Resources and Ecology, 4(2): 149-156.

DOI

[11]
Liu D, Yin Z. 2022. Spatial-temporal pattern evolution and mechanism model of tourism ecological security in China. Ecological Indicators, 139: 108933. DOI: 10.1016/j.ecolind.2022.108933.

[12]
Lu H D, Hu H Q. 2004. Systematic analysis and countermeasures of urban ecological security problems in China. Environmental Science Trends, (4): 44-46. (in Chinese)

[13]
Ma M, Tang J. 2022. Interactive coercive relationship and spatio-temporal coupling coordination degree between tourism urbanization and eco- environment: A case study in western China. Ecological Indicators, 142: 109149. DOI: 10.1016/j.ecolind.2022.109149.

[14]
Ma X, Sun B, Hou G, et al. 2021. Evaluation and spatial effects of tourism ecological security in the Yangtze River delta. Ecological Indicators, 131: 108190. DOI: 10.1016/j.ecolind.2021.108190.

[15]
Mu X Q, Guo X Y, Ming Q Z, et al. 2022. Dynamic evolution characteristics and driving factors of tourism ecological security in the Yellow River Basin. Acta Geographica Sinica, 77(3): 714-735. (in Chinese)

DOI

[16]
Ruan W, Li Y, Zhang S, et al. 2019. Evaluation and drive mechanism of tourism ecological security based on the DPSIR-DEA model. Tourism Management, 75: 609-625.

[17]
Shi D, Guan J W. 2022. Spatial-temporal pattern measurement and obstacle diagnosis of tourism ecological security based on DPSIR matter-element in Jilin Province. Chinese Journal of Ecology, 41(8): 1653-1664. (in Chinese)

[18]
Sun Y, Ding W, Yang G. 2022. Green innovation efficiency of China’s tourism industry from the perspective of shared inputs: Dynamic evolution and combination improvement paths. Ecological Indicators, 138: 108824. DOI: 10.1016/j.ecolind.2022.108824.

[19]
United Nations. 2020. Tourism helps lead the world to recover. http://www.un.org/zh/106007. Viewed on 2022-11-24.

[20]
Villacé-Molinero T, Fernández-Muñoz J J, Orea-Giner A, et al. 2021. Understanding the new post-covid-19 risk scenario: Outlooks and challenges for a new era of tourism. Tourism Management, 86: 104324. DOI: 10.1016/j.tourman.2021.104324.

[21]
Wang J F, Xu C D. 2017. Geodetector: Principle and prospective. Acta Geographica Sinica, 72(1): 116-134. (in Chinese)

DOI

[22]
Wang Z F, Chen Q Q. 2021. Spatio-temporal pattern evolution and trend prediction of tourism ecological security in the Yangtze River economic belt since 1998. Acta Ecologica Sinica, 41(1): 320-332. (in Chinese)

[23]
Wei X C, Li L T. 2021. Study on early warning of tourism ecological security in northwest arid and windy sand area based on DPSIR model: Taking Zhongwei City of Ningxia Hui Autonomous Region as an example. Ecological Economy, 37(6): 134-139. (in Chinese)

[24]
Xiao Z F, Li R, Duan S, et al. 2022. Study on temporal and spatial pattern evolution of tourism ecological security in Chengdu-Chongqing urban agglomeration. World Regional Studies, 32(10): 122-133. (in Chinese)

[25]
Xu A, Wang C, Tang D, et al. 2022. Tourism circular economy: Identification and measurement of tourism industry ecologization. Ecological Indicators, 144: 109476. DOI: 10.1016/j.ecolind.2022.109476.

[26]
Xu M, Liu C L, Li D, et al. 2017. Tourism ecological security early warning of Zhangjiajie, China based on the improved TOPSIS method and the GM(1,1) mode. Chinese Journal of Applied Ecology, 28(11): 3731-3739. (in Chinese)

[27]
Xu S K, Zuo Y F, Zhang M. 2021. Evaluation of tourism ecological security and diagnosis of obstacle factors in China based on fuzzy object element model. Scientia Geographica Sinica 41(1): 33-43. (in Chinese)

DOI

[28]
Yang L J, Cao K J. 2020. Tourism ecological security early warning of Ili River Valley based on DPSIR model. Ecological Economy, 36(11): 111-117. (in Chinese)

[29]
Zhang J H, Zhang J, Wang Q. 2008. Measuring the ecological security of tourist destination: Methodology and a case study of Jiuzhaigou. Geographical Research, 27(2): 449-458. (in Chinese)

DOI

[30]
Zhang X J, Zhong L S. 2019. Advances in tourism ecology research. Acta Ecologica Sinica, 39(24): 9396-9407. (in Chinese)

[31]
Zhang X, Zhong L, Yu H. 2022a. Sustainability assessment of tourism in protected areas: A relational perspective. Global Ecology and Conservation, 35: e02074. DOI: 10.1016/j.gecco.2022.e02074.

[32]
Zhang Z, Qin J X, Luo L, et al. 2022b. Research on the evaluation of coordinated development of tourism and economy: Ecological environment along the Silk Road economic belt. Sustainability, 14(21): 13838. DOI: 10.3390/su142113838.

[33]
Zhao J, Guo H. 2022. Spatial and temporal evolution of tourism ecological security in the old revolutionary region of the Dabie mountains from 2001 to 2020. Sustainability, 14(17): 10762. DOI: 10.3390/su141710762.

[34]
Zheng Q X, Kuang Y Q, Huang N S, et al. 2017. Spatiotemporal measurement and diagnosis of obstacle factors on tourism eco-security in Guangdong Province. Research of Soil and Water Conservation, 24(5): 252-258. (in Chinese)

[35]
Zhou B, Yu H, Zhong L S, et al. 2016. Developmental trend forecasting of tourism ecological security trends: The case of Mount Putuo Island. Acta Ecologica Sinica, 36(23): 7792-7803. (in Chinese)

Outlines

/