
Journal of Resources and Ecology >
Assessing and Comparing Smallholders’ Vulnerability to Climate Change among Countries in the Pan-Third Pole Region
|
XU Xiangbo, E-mail: ydxu.ccap@igsnrr.ac.cn |
Received date: 2023-12-18
Accepted date: 2024-02-20
Online published: 2024-07-25
Supported by
The National Natural Science Foundation of China(7231101308)
The National Natural Science Foundation of China(72374190)
The National Natural Science Foundation of China(31861143015)
The Strategic Priority Research Program of the Chinese Academy of Sciences(XDA20010303)
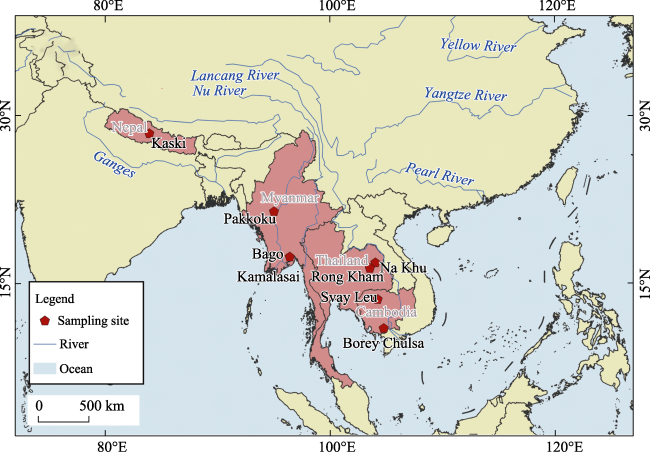
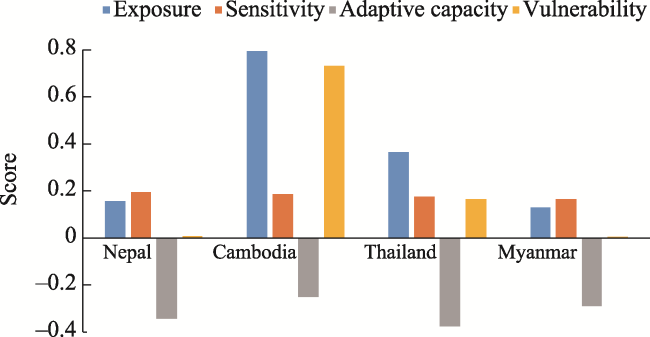
A comprehensive assessment of climate change vulnerability is imperative for formulating effective adaptation strategies and advancing sustainable development goals. As one of the most climate-vulnerable regions globally, the Pan-Third Pole area lacks transnational vulnerability assessments, which poses a significant obstacle to efficient climate adaptation. This study conducted transnational comparisons based on primary micro-survey data collected uniformly across Nepal, Cambodia, Thailand, and Myanmar, which are all located in the Pan-Third Pole region. Evaluating and comparing the vulnerabilities employed an extended framework of climate change indicators. The findings reveal substantial variations in vulnerability among the countries, with Cambodia exhibiting the highest vulnerability, followed by Thailand, Myanmar, and Nepal in descending order, primarily due to differences in exposure. Household exposure to climate change also varied significantly. Sensitivity scores decreased in the order of Nepal > Cambodia > Thailand > Myanmar, with demographic factors, tap water accessibility, and land being the major contributors and sources of differentiation among the countries. Regarding adaptability, Thailand demonstrated the highest adaptability, with human and financial capital as the key differentiators. The outcomes underscore the need for tailored policy measures addressing the diverse vulnerabilities, including enhancing household disaster prevention and capital protection. Furthermore, targeted international investments are crucial for improving adaptability among smallholders in this unique region.
XU Xiangbo , XU Ce , LI Chang , FU Chao , ZHOU Yunqiao . Assessing and Comparing Smallholders’ Vulnerability to Climate Change among Countries in the Pan-Third Pole Region[J]. Journal of Resources and Ecology, 2024 , 15(4) : 1015 -1026 . DOI: 10.5814/j.issn.1674-764x.2024.04.021
Fig. 1 Locations of the study regions in Nepal, Cambodia, Thailand and Myanmar |
Table 1 Classification and weights of factors in the vulnerability assessment |
| Component | Sub-component | Factor | Functional relationship with vulnerability | wi | wi’ |
|---|---|---|---|---|---|
| Exposure | Hazardous events | Drought | + | ||
| Flood/heavy rainfall | + | ||||
| Windstorm | + | ||||
| Extreme heat/heat wave | + | ||||
| Extreme cold/cold damage | + | ||||
| Hail | + | ||||
| Mudslide | + | ||||
| Insect pest | + | ||||
| Sensitivity | Demographic factors | Medical expenditure | - | 0.025 | 0.052 |
| Dependency ratio | + | 0.032 | 0.066 | ||
| The elder ratio | + | 0.018 | 0.037 | ||
| Water | Tap water | + | 0.016 | 0.033 | |
| Energy | Energy expenditure | + | 0.025 | 0.051 | |
| Land | Land area | + | 0.025 | 0.052 | |
| Land type | 0.034 | 0.071 | |||
| Livestock | Animal power | + | 0.076 | 0.157 | |
| Poultry | + | 0.144 | 0.301 | ||
| House | Number of houses | + | 0.087 | 0.181 | |
| Adaptive capacity | Human capital | Education | - | 0.035 | 0.067 |
| Non-agricultural employment | - | 0.022 | 0.043 | ||
| Medical insurance | - | 0.017 | 0.032 | ||
| Endowment insurance (over 16 years old) | - | 0.016 | 0.031 | ||
| Agricultural skills training | - | 0.030 | 0.059 | ||
| Family decision making | - | 0.019 | 0.037 | ||
| Social capital | Government | - | 0.025 | 0.047 | |
| University | - | 0.025 | 0.048 | ||
| Hospital | - | 0.025 | 0.048 | ||
| Enterprise | - | 0.025 | 0.047 | ||
| Physical capital | Road | - | 0.038 | 0.073 | |
| Transportation | - | 0.034 | 0.065 | ||
| Cellphone | - | 0.034 | 0.066 | ||
| Food self-sufficiency | - | 0.021 | 0.040 | ||
| Agricultural species diversity | - | 0.037 | 0.071 | ||
| Financial capital | Income | - | 0.025 | 0.048 | |
| Income resources | - | 0.056 | 0.108 | ||
| Household savings | - | 0.019 | 0.037 | ||
| Agricultural insurance | - | 0.017 | 0.033 |
Note: The weights in this table were calculated based on our survey data. The sources and detailed explanations of the variables are in Table S1 in the supplementary material, which is available on the www.jorae.cn or can be obtained by contacting the author directly. |
Fig. 2 Climate change vulnerability assessment and composition for each of the four countries |
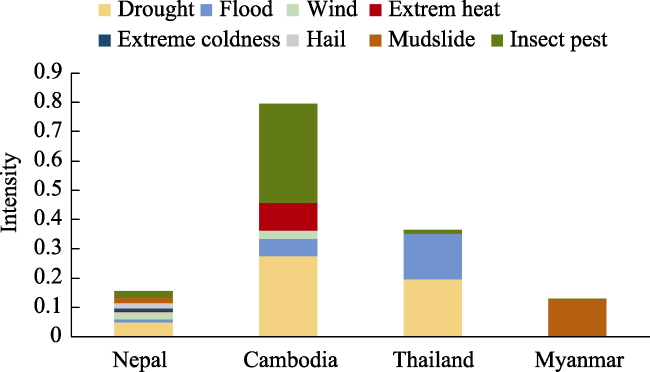
Fig. 3 Intensities of extreme climate events in each of the four countries |
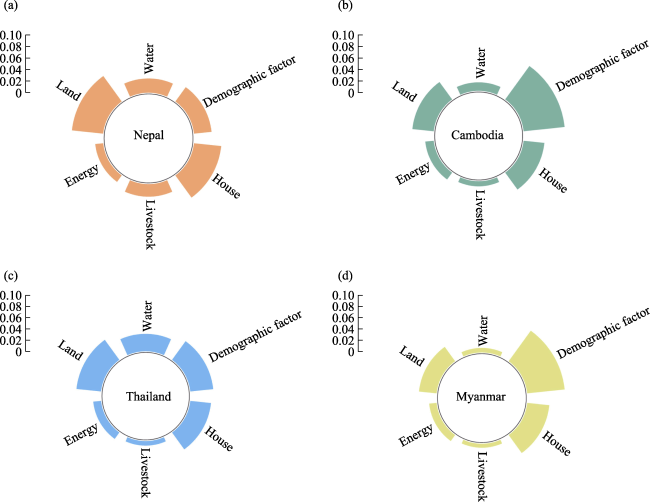
Fig. 4 Compositions of sensitivity in the four countriesNote: Scale units represent the sensitivity score of the sampled countries. |
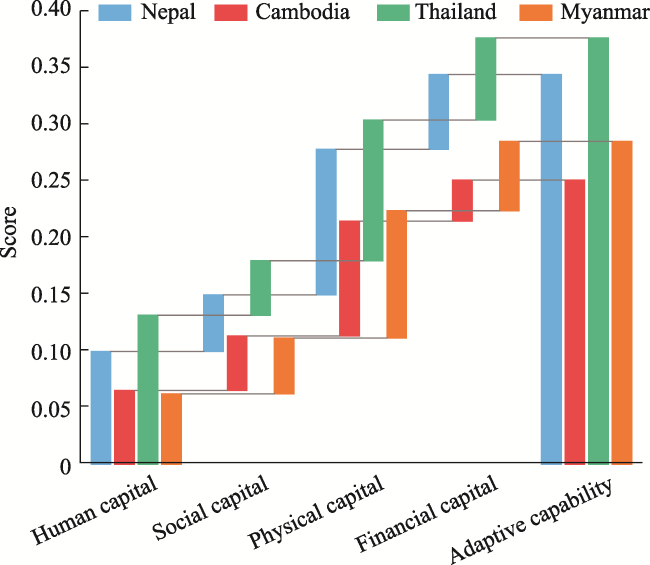
Fig. 5 Sources of adaptive capacity among the four countries |
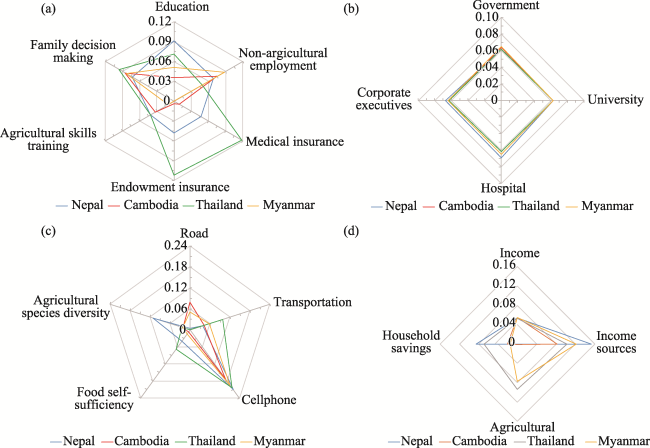
Fig. 6 Radar maps of the subcomponents of adaptive capacity in the four countriesNote: (a), (b), (c), and (d) show the inter-country differences in human capital, social capital, physical capital, and financial capital, respectively. |
| [1] |
|
| [2] |
|
| [3] |
|
| [4] |
|
| [5] |
|
| [6] |
|
| [7] |
|
| [8] |
|
| [9] |
|
| [10] |
|
| [11] |
|
| [12] |
|
| [13] |
|
| [14] |
|
| [15] |
|
| [16] |
|
| [17] |
|
| [18] |
|
| [19] |
|
| [20] |
|
| [21] |
|
| [22] |
|
| [23] |
|
| [24] |
|
| [25] |
|
| [26] |
|
| [27] |
|
| [28] |
|
| [29] |
|
| [30] |
|
| [31] |
|
| [32] |
|
| [33] |
|
| [34] |
|
| [35] |
|
| [36] |
|
| [37] |
|
| [38] |
|
/
| 〈 |
|
〉 |