Cultural Tourism and Tourism High-quality Development

Spatial-temporal Evolution Patterns and Influencing Factors of Educational Tourism Resources in China from 1997 to 2021

  • ZHU Lei , 1 ,
  • HU Jing , 2, * ,
  • XU Jiahui 1 ,
  • LI Yannan 1 ,
  • MA Zhihua 1 ,
  • LIANG Mangmang 1 ,
  • TENG Hongping 1
Expand
  • 1. School of Resources and Environment, Anqing Normal University, Anqing, Anhui 246011, China
  • 2. School of Urban and Environmental Sciences, Central China Normal University, Wuhan 430079, China
*HU Jing, E-mail:

ZHU Lei, E-mail:

Received date: 2023-05-15

  Accepted date: 2023-11-29

  Online published: 2024-05-24

Supported by

The Philosophy and Social Science Planning Project of Anhui Province(AHSKQ2021D24)

The Social Science Innovation and Development Research Project of Anhui Province(2021CX100)

The Key Project of Outstanding Young Talents in Colleges and Universities of Anhui Province(gxyqZD2022060)

The Think Tank Project of Anhui Province(ZK2021A004)

The Anhui Province Philosophy and Social Science Major Research Project(2023AH040067)

Abstract

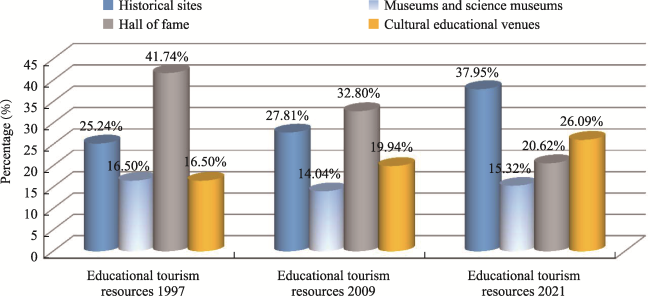
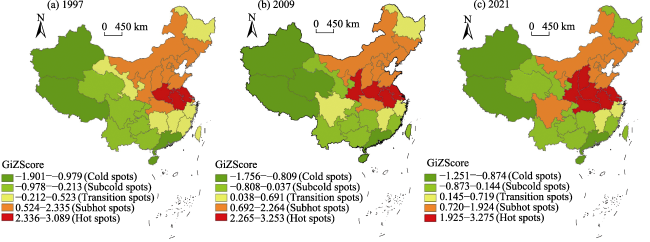
This study systematically explored the spatial evolution characteristics and influencing factors of China's educational tourism resources using a system of spatial analysis techniques. The results show that educational tourism resources can be divided into four types: historical sites, museums, science museums and technology venues, former residences of celebrities, and cultural and educational venues. Among them, former residences of celebrities account for the highest proportion at about 35%, while museums, science museums and technology venues account for the lowest proportion at only about 15%. Educational tourism resources present a condensed distribution trend, forming a “dual-core structure” with the Beijing-Tianjin-Hebei and Yangtze River Delta urban agglomeration as high-density cores. The probability distribution of educational tourism resources is spatially uneven, with distinct fractal characteristics. Hot spots gradually spread from the Yangtze River Delta to the western provinces, and the number of hot spots is increasing. Cold spots are mainly distributed in the southwest of China, and the number remains unchanged, while the phenomenon of polarization is becoming increasingly more prominent. The main factors affecting the distribution of educational tourism resources are as follows, listed in order of their intensity of influence: policy orientation > traffic conditions > tourism resource endowment > source market > social and cultural factors > natural factors. The findings will help in the high-quality development of China’s educational tourism.

Cite this article

ZHU Lei , HU Jing , XU Jiahui , LI Yannan , MA Zhihua , LIANG Mangmang , TENG Hongping . Spatial-temporal Evolution Patterns and Influencing Factors of Educational Tourism Resources in China from 1997 to 2021[J]. Journal of Resources and Ecology, 2024 , 15(3) : 754 -768 . DOI: 10.5814/j.issn.1674-764x.2024.03.021

1 Introduction

Tourism originally referred to movement for the purposes of trade and conquest (Ivanov and Webster, 2020). In modern times, this phenomenon has experienced a drift towards pleasure, serving as a symbol of social status. Influenced by hypermedia such as social networks, web-based promotions, and a greater awareness of leisure, tourism has become one of the fastest growing industries in the world (Buckley, 2011; Sharpley, 2020). The transformation of organizational structures from primitive to purposeful has led to an increase in disposable income, more leisure time, greater political freedom, and the growth of mass tourism (Cheng et al., 2011; Hall et al., 2020).
There are different forms of tourism, such as ecotourism, educational tourism, event tourism, religious tourism, social tourism, sustainable tourism, and volunteer tourism. In particular, educational tourism is a type of program in which participants travel to a place, either individually or in a group, with the primary motive of engaging in or gaining a learning experience (Abubakar et al., 2014; Tomasi et al., 2020). The combination of tourism and education has improved the performance of the tourism industry (Zhang and Fan, 2006; Stoica et al., 2022). Educational tourism, as a form of tourism experience, aims to provide structured on-site learning through actively engaged intellectual practice, with learning being the explicit core of product delivery (Pitman et al., 2011). Educational tourism describes an event in which people travel across international borders to acquire intellectual services (Wang et al., 2010). Educational tourists are those who participate in learning activities or who learn new skills and improve existing skills through workshops (Gibson, 1998).
In a globalized world where daily human life is becoming increasingly more competitive, with increasing access to educational services and knowledge sharing methods taking similar shapes, the importance of novelty gains new meaning (Kim, 2020). People are looking for something new, especially new experiences of social norms and cultures (Helda and Syahrani, 2022). Countries around the globe are channeling more funds in education for the purpose of tourism; relevant government departments are also selecting more resources for educational tourism (Zhong et al., 2011; Chen and Nakama, 2013). Educational tourism resources refer to “tourism attractions that enable individuals to gain learning experiences or be inspired” (Kabanova et al., 2016; Ohe, 2018). From 1997 to 2021, the Chinese government has selected 546 representative educational tourism resources and encouraged local governments to explore and develop educational tourism resources based on local conditions (Chi et al., 2020; Liu et al., 2020). In general, four aspects are primarily considered in the development of educational tourism: Ecotourism, heritage tourism, rural/agricultural tourism and student exchange learning organized by schools (Bodger, 1998).
Educational tourism resources are an important tourism resource and play an important role in the development of research-based tourism (Smith, 2013). At present, research on educational tourism resources focuses on the development and utilization of educational tourism resources, the identification of tourism products, the concept of educational tourism resources, and the construction and management of educational tourism resources (Jang et al., 2021). In addition, the characteristics and classification of educational tourism resources have also become a hot topic for exploration (McGladdery and Lubbe, 2017). Some scholars have systematically studied the construction and management of educational tourism resources in Latin America and their educational significance for students (Atsa’am and Bodur, 2022).
The relevant components of educational tourism have been investigated through empirical studies in the fields of psychology, sociology, education and management, with most studies using qualitative methods. However, educational tourism has received little attention in geography, and, apart from the work of Huang and Suliman, the macro analysis of educational tourism resources is lacking. Therefore, this study aimed to fill the gap in the literature by examining the spatial distribution and influencing factors of educational tourism resources in China. The primary objectives of this study are as follows: 1) Explore the evolution characteristics of the spatial and temporal patterns of educational tourism resources in China using a combination of proximity index, geographic concentration index, grid dimension, and kernel density. To this end, educational tourism resources in 1997, 2009, and 2021 were taken as research samples. 2) Identify the main influencing factors of the spatial distribution characteristics of educational tourism resources and analyze their mechanisms by systematically using GIS analysis techniques, such as buffer analysis, geographic detector method and SPSS correlation analysis. 3) Discuss countermeasures and suggestions for the high-quality development of educational tourism resources in China.
This study has certain reference significance for realizing the rational development and utilization of China’s educational tourism resources and promoting the high-quality development of China’s educational tourism. In the future development and layout of educational tourism destinations in China, the driving factors of the spatial evolution of educational tourism resources should be fully considered. It is necessary to comprehensively analyze the development potential of educational tourism resources based on the conditions of local tourism resources, create tourism products with high market recognition and satisfaction, and realize the characterization, differentiation, and high-quality development of educational tourism.

2 Materials and methods

2.1 Methods

2.1.1 Nearest Neighbor Index

The Nearest Neighbor Index indicates the degree of spatial proximity between point features, thus characterizing the distribution type of point features in space (Mansour, 2016). The index value was calculated as follows:
$R=\frac{{{{\bar{r}}}_{1}}}{{{{\bar{r}}}_{E}}}$
where ${{\bar{r}}_{E}}=\frac{1}{2\sqrt{D}}=\frac{1}{2\sqrt{n/A}}$ is the theoretical value of the nearest neighbor distance, ${{\bar{r}}_{1}}$ is the average value of the nearest neighbor distance, D is the density of research point, A is the size of the research area, and n is the number of educational tourism resources. It represents the proximity of educational tourism resources in geographical space. Specifically, R=1 reflects a random state distribution, R>1 reflects a uniform state distribution, and R<1 reflects a condensed state distribution (Zhang and Zhang, 2021).

2.1.2 Geo-concentration index

The spatial concentration of point-like features is usually characterized by a geographical concentration index, whose exponential values range from 0 to 100. The larger the number, the more concentrated the distribution of the educational tourism resources, and the smaller the number, the more discrete the distribution of educational tourism resources (Shi and Wang, 2020). The formula is as follows:
$G=100\times \sqrt{\sum\limits_{i=1}^{n}{{{\left( \frac{{{X}_{i}}}{T} \right)}^{2}}}}$
In the formula, n is the number of provinces in China, T is the total number of educational tourism resources, and Xi represents the number of educational tourism resources in province i.$G\in [0100]$, with the concentration degree of the distribution of educational tourism resources being directly proportional to the value of G (Zhong et al., 2021).

2.1.3 Kernel density estimation

Although the Nearest Neighbor Index can reflect the spatial distribution type of educational tourism resources, it cannot be used to observe its specific spatial dispersion or aggregation location. Kernel density estimation is a method for determining the probability of occurrence of points at different locations in space. In this study, kernel density estimation was used to identify the spatial distribution density of educational tourism resources points as follows:
$f(x)=\frac{1}{nh}\sum\limits_{i=1}^{n}{k\left( \frac{x-{{X}_{i}}}{h} \right)}$
where $k\left( \frac{x-{{X}_{i}}}{h} \right)$is the kernel density function of educational tourism resources, x is the location of educational tourism resources points, Xi is the educational tourism resources points set to be estimated, i is one of the educational tourism resources points, h is the bandwidth for the search radius distance (h > 0), and n is the number of educational tourism resources points in the range of bandwidth.

2.1.4 Calculation of grid dimension

On the basis of the grid analysis of the spatial distribution of educational tourism resources, the national map was divided into different numbers of grids (Wang and Xu, 2017). Then, the number of grids occupied by educational tourism resources N(r) will vary according to different grid sizes r (Sokai and Oden, 1978), assuming that educational tourism resources have the characteristics of non-scale spatial distribution. The number of grids occupied by educational tourism resources should be:
$N(r)\propto {{r}^{-a}}$
where$a={{D}_{0}}$is the capacity dimension. With i and j as the row number and column number, assuming that the distribution number of educational tourism resources distribution in the grid is, N is the total number of educational tourism resources. Its probability can be defined as ${{P}_{ij}}=\frac{{{N}_{ij}}}{N}$ (Zhang, 2021). Therefore, the available information is:
$I(r)=-\sum\limits_{i=1}^{k}{\sum\limits_{j=1}^{k}{{{P}_{ij}}(r)}}ln{{P}_{ij}}(\text{r})$
where $k=\frac{\text{1}}{r}$is the number of segments on each side of the region; r is different grid size. If the distribution of educational tourism resources have fractal characteristics (Akiyama and Hayashi, 2006). It can be expressed as:
$I(r)={{I}_{0}}-{{D}_{1}}lnr$
where I0 is a constant, D1 is the information dimension, and the D value is between 0 and 2, with larger values indicating greater balance (Zhang and Zhang, 2021). D value of 2 indicates a uniform distribution. D value close to 1 indicates a distribution trend that may be concentrated along a geographic line (Chi et al., 2021).

2.1.5 Exploratory spatial data analysis

The exploratory spatial analysis method is an integration of spatial analysis methods and techniques. It facilitates a comprehensive analysis of the concentration state of things geospatially (Zou et al., 2006), aiming to reveal and analyze the interaction between things and objects geospatially. In this study, Moran’s I and Getis-Ord Gi* were selected to explore the spatial association structure pattern and the difference in the spatial distribution of cold and hot spots of educational tourism resources, respectively (Zhang et al., 2021). Moran’s I formula is as follows:
$I=\sum\limits_{i=1}^{n}{\sum\limits_{\text{j}=1}^{n}{{{W}_{ij}}}}\left( {{X}_{i}}-\overline{X} \right)\left( {{X}_{\text{j}}}-\overline{X} \right)/{{S}^{2}}\sum\limits_{i=1}^{n}{\sum\limits_{j=1}^{n}{{{W}_{ij}}}}$
where Xi and Xj are the number of educational tourism resources on i and j geospatial parameters, and the spatial weight matrix is set to Wij, where the space is 1 when adjacent and 0 when not adjacent.$\overline{X}$is the mean value of the observed values for all regions. S2 is the variance. Moran’s I index is distributed between (-1, 1) exponential values. The closer the value is to 1, the closer it is to the convergence of similar properties, and the closer to -1, the more they are clustered with different properties. A value tending to 0 indicates a lack of spatial auto-correlation (Li et al., 2021).
As Moran’s I index characterizes the overall concentration of educational tourism resources, Getis-Ord Gi* is generally used for measurement analysis to further identify the local distribution of cold and hot spots of educational tourism resources (Malczewski, 2006). The formula is as follows:
$I=\sum\limits_{i=1}^{n}{\sum\limits_{j=1}^{n}{{{W}_{ij}}}}(d){{X}_{j}}/\sum\limits_{j=1}^{n}{{{X}_{j}}}$
For standardization:
$Z\left( {{G}_{i}}^{} \right)=\left[ {{G}_{i}}^{}-E\left( {{G}_{i}}^{} \right) \right]/\sqrt{Var\left( {{G}_{i}}^{} \right)}$
In the formula, E(Gi*) is the long-term value, Var(Gi*) is the variance value, and Wij(d) is the spatial weight matrix. Z (Gi*)>0 and passing the significance test indicates hot spots of educational tourism resources in the region showing a high concentration of high values in space. If Z (Gi*) is negative and passes the test, the region has cold spots of educational tourism resources with the aggregation of low-values in space (Kwan, 2002).

2.1.6 Geographical detector

Geographical detector is an important method for detecting the cause and mechanism of the spatial pattern of geographical elements. Its model is as follows:
$\begin{align} & q=1-\frac{\sum\limits_{h=1}^{L}{{{N}_{\text{h}}}\sigma _{h}^{2}}}{N\sigma _{h}^{2}}=1-\frac{SSW}{SST} \\ & SSW=\sum\limits_{h=1}^{L}{{{N}_{\text{h}}}\sigma _{h}^{2}},\ \ SST=N\sigma _{{}}^{2} \\ \end{align}$,
where h (h=1, 2, …, L), h is the stratification of variable Y or factor X, and ${{N}_{h}}$ and N are the number of units in layer h and the whole area, respectively.$\text{ }\!\!~\!\!\text{ }\sigma _{h}^{2}$ and ${{\sigma }^{2}}$ are the variances of the Y values of layer h and the whole region, respectively. SSW and SST are the sum of the variance within the layer and the total variance of the whole region, respectively. The range of q is [01]. The value of q is proportional to the spatial differentiation of Y. If stratification is generated by independent variable X, the larger the q value, the stronger the explanatory power of independent variable X to attribute Y, and vice versa.

2.2 Data source

The research data were obtained from the 546 educational tourism resources selected by the Chinese government on seven occasions between 1997 and 2021 (Fig. 1), covering 31 provinces and autonomous regions (excluding Hong Kong, Macau, and Taiwan). In the past seven years, the selection of educational tourism resources for development has been systematic, with characteristics, such as industry-led, strong atmosphere, and human harmony. It pointed out the direction for educational tourism resources and tourism development. In this study, the sample data were used to accurately locate, extract, and calibrate the coordinates of educational tourism resources in three time of 1997, 2009, and 2020 in China. The main reason for choosing these three time nodes is that 1997 marks the first time the Chinese government selected educational tourism resources, 2021 marks the latest update year of the data of educational tourism resources, and 2009 is the year between 1997 and 2021, which is more conducive to comprehensively revealing the spatial evolution characteristics of educational tourism resources. Therefore, the selection of these periods improve the scientific rigor of this study. The point elements of educational tourism resources on the map of China were visualized in ArcGIS 10.2, taking the 1:4000000 national vector map in the national basic geographic information system database as the basic vector data source (Sarrión-Gavilán et al., 2015).
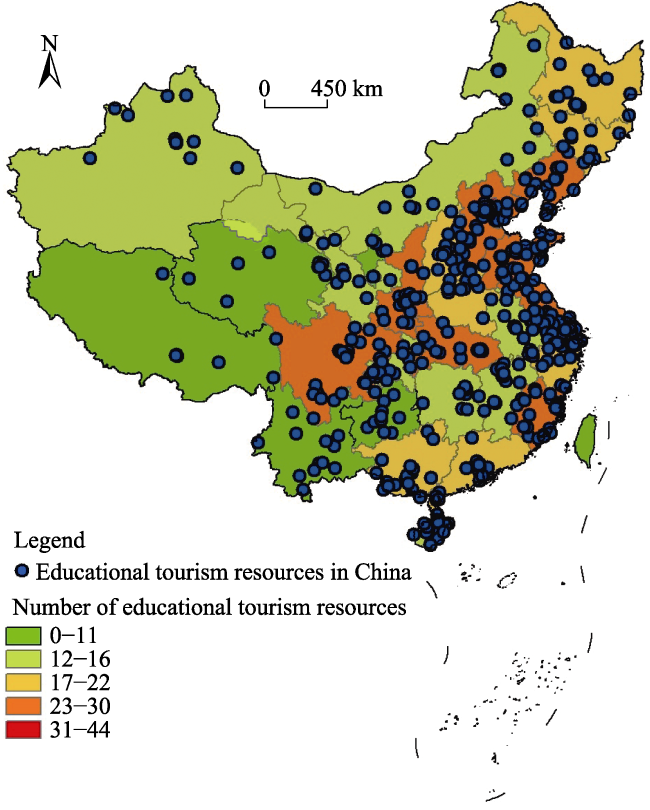
Fig. 1 Geospatial distribution map of educational tourism resources in China

3 Results

3.1 Overall characteristics

According to the richness and variety of educational tourism resources, educational tourism resources were divided into four types: historical sites, museums and science museums, hall of fame, and cultural educational venues. In terms of type structure (Fig. 2), there were 26 (25.24%) historical sites, 17 (16.5%) museums and science museums, 43 (41.74%) halls of fame, and 17 (16.5%) cultural and educational venues in 1997. In 2009, they increased to 99 (27.81%) historical sites, 50 (14.04%) museums and science museums, 136 (32.8%) halls of fame, and 71 (19.94%) cultural and educational venues. In 2021, numbers of historical sites, museums and science museums, halls of fame, and cultural and educational venues further increased to 208 (37.95%), 84(15.32%), 113(20.62%), and 143(26.09%), respectively. Therefore, their numbers have been increasing annually. Hall of fame accounted for largest highest proportion at 41.74%, 32.80%, and 20.62% in 1997, 2009, and 2021, respectively, whereas museums and science museums accounted for the lowest proportion at 16.5%, 14.04%, and 15.32%, respectively. Furthermore, cultural and educational venues showed the most significant increase. This shows that the educational tourism resources have received wide attention in recent years, with the hall of fame and cultural and educational venues as the carriers. Moreover, these two types of resources have become important carriers for the development of educational tourism (Wen and Sinha, 2009).
Fig. 2 Type and structural evolution of educational tourism resources

3.2 Spatial differentiation characteristics

3.2.1 Spatial density characteristic

The distribution type of educational tourism resources can be determined by using the Nearest Neighbor Index. Using ArcGIS 10.2, the values of the index were calculated to be 0.609, 0.467, and 0.474 in 1997, 2009, and 2021, respectively. The values were less than 1 and exhibited a trend of sharp initial decline, followed by a small rise. This reveals that the spatial distribution of educational tourism resources showed a trend of cohesive distribution in different time nodes but this concentrated distribution decreased with time. Moreover, there is a gradual trend towards equilibrium (Lau et al., 2020). The actual values of the geographical concentration index of educational tourism resources were 21.34, 19.43, and 19.73 in 1997, 2009, and 2021, respectively, while the geographical concentration index of educational tourism resources in an evenly distributed state was 17.94. The actual values were larger than the value under uniform distribution, which indicates that the spatial distribution of educational tourism resources was more concentrated, with clear differences among different regions. Nevertheless, the overall decline of the actual geographical concentration index also indicates that the concentration of spatial distribution has decreased (Zuo et al., 2021). In conclusion, educational tourism resources still show a cohesive distribution trend. The more concentrated the spatial distribution, the more positive the effect on the development of educational tourism resources.
Kernel density analysis was carried out on 546 educational tourism resources nationwide in 1997, 2009, and 2021 using ArcGIS 10.2 software to produce a map of educational tourism resources (Fig. 3). On the whole, educational tourism resources presented a spatial distribution pattern of more in the eastern part and less in the western part and showed a certain coupling with regional economic development. Comparing the kernel density maps among the three-time periods, high-density areas of educational tourism resources presented a “dual-core structure”, comprising the high-density area of the Beijing-Tianjin-Hebei Urban Agglomeration with Beijing as the center and the high-density area of the Yangtze River Delta with Zhejiang, Anhui, Shanghai, and Jiangsu as the center. The sub-core areas of the Shanxi-Hebei junction, Hunan-Jiangxi junction, eastern Hubei, and southeastern Guangdong presented a “dot scattering” feature, characterized by “large concentration and small dispersion”. The sub-cores gradually migrated to the southeast with time. The high-density center was located in the main economically developed area of China, with high per capita disposable income and more educational tourism resources, which provides a solid material foundation for the construction of educational tourism resources. From the viewpoint of the internal distribution of provinces and regions, Beijing, Hebei, and Jiangsu, the most economically developed provinces are high-density areas. To some extent it indicates that the distributions of educational resources are relatively consistent with urban economic development. Qinghai, Gansu, and Tibet are relatively low-density areas, which is attributable to their high altitude and poor traffic conditions.
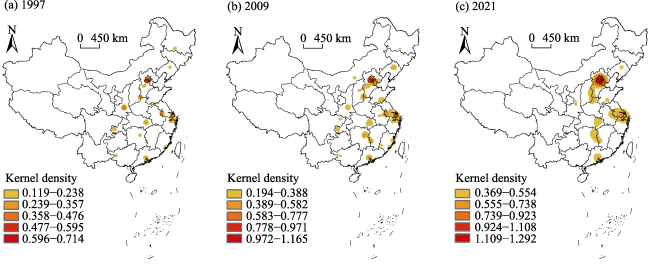
Fig. 3 Kernel density map of educational tourism resources

3.2.2 Spatial complexity characteristic

To systematically study the equilibrium of the geographical spatial distribution of educational tourism resources, the grids of educational tourism resources were analyzed using the grid dimensional model. First, a rectangle of the right size was drawn on the distribution map of educational tourism resources in 1997, 2009, and 2021 to cover them, setting their edge length to 1. Secondly, the grid number N(r) occupied by educational tourism resources and the number of educational tourism resources in each grid Nij were counted to further calculate the probability Pij(r). Finally, the corresponding coordinate points were measured according to the grid dimension correlation formula N(r) and I(r) values shown in Table 1. Then, the calculated coordinate points (N(r), k) and (I(r), k) were input into Excel to draw a double logarithmic scatter plot (Fig. 4). Fitting regression was carried out to obtain the final value of capacity dimension D0 and information dimension D1.
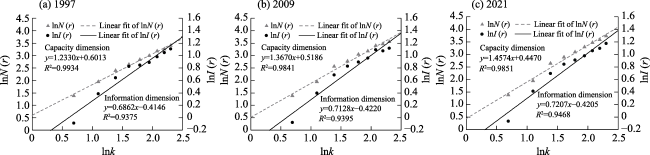
Table 1 Grid dimension measurement data for the educational tourism resources system
Year k 2 3 4 5 6 7 8 9 10
1997 N(r) 4 6 13 15 17 18 26 29 33
I(r) 1.0323 1.5359 2.1016 2.4340 2.4452 2.6689 3.0369 3.0921 3.3259
2009 N(r) 4 8 15 18 23 27 35 41 46
I(r) 1.0574 1.6226 2.1554 2.4082 2.5365 2.7821 3.0750 3.2312 3.4818
2021 N(r) 4 8 15 22 29 36 45 59 56
I(r) 1.0468 1.6905 2.1935 2.6704 2.8568 3.1223 3.3164 3.4797 3.6189

Note: k is the number of segments on each side of the region; N(r) is the number of grids occupied by educational tourism resources; and I(r) is the grid dimension value.

Fig. 4 Grid dimension double-number scatterplot of educational tourism resources
The D0 value of educational tourism resources in 1997, 2009, and 2021 were calculated to be 1.3008 (coefficient of determination 0.9699), 1.4868 (coefficient of determination 0.9895), and 1.7051 (coefficient of determination 0.9920), respectively according to the scatterplot presented in Fig. 4. It shows that the fractal characteristics of the system of educational tourism resources are significant. The capacity dimension in 1997 was close to 1, indicating that the distribution of the educational tourism resources was relatively concentrated throughout the country, while the capacity dimension presented an annual increase between 2009 and 2021. A capacity dimension close to 2 indicates a relatively balanced distribution of educational tourism resources on a national scale. In the development of educational tourism resources, the economic development of different regions should be taken into account. Moreover, differences in resource types and other aspects should be taken into account in order to ensure balanced development among regions and support the construction of educational tourism resources in less developed areas. In this manner, a nationwide balanced and healthy development of educational tourism resources can be achieved. From the perspective of information dimension in each year, the values of D1 in the three years were 0.6901, 0.6942, and 0.7425, which are all smaller than the corresponding values of the capacity dimension. This indicates that the system of educational tourism resources in the region may be partially clustered around main traffic lines or around big cities. Moreover, the spatial probability distribution may be nonuniform and the fractal structure may be relatively complex due to the different endowment of historical and cultural resources or the different levels of regional economic and social development.

3.2.3 Regional distribution characteristics

In terms of provinces, educational tourism resources were mainly concentrated in Beijing, Jiangsu, Shaanxi, Hebei, Hubei, Sichuan, Fujian in 1997. Only nine provinces had five educational tourism resources. The number of educational tourism resources was only one in Tibet, Guizhou, Anhui, and the other ten provinces. The number of educational tourism resources in all provinces increased in 2009. The largest increase was observed in Jiangsu, Hunan, Beijing, Hebei, and Sichuan provinces and the number reached more than 17. The smallest increase was observed in Tibet, Qinghai, and Ningxia at only four. In 2021, the top ten provinces with the largest number of educational tourism resources were Beijing, Hunan, Jiangsu, Sichuan, Hubei, Fujian, Henan, Hebei, Liaoning, and Shandong, with a total of 264 accounting for 48.35%. Among them, Beijing had the largest number at 43 and Shandong the smallest at 21. These results clearly show a distinct distribution pattern of educational tourism resources. In terms of the east, central, and west regions in 1997, educational tourism resources were the maximum in the east at 51, followed by the central at 27, and the west with the minimum of 25. The distribution characteristics of “declining east, middle, and west” in 1997 continued in 2009. In 2021, the eastern region had 228 educational tourism resources, east accounting for 42% and the central and western regions had 159, accounting for 29%.
In terms of the number of educational tourism resources among eight partitions (Fig. 5), the curve graphs for 1997, 2009, and 2021 were roughly the same, presenting a decrease from the northern coast, the middle Yangtze River and the southwest region to the middle Yellow River, the eastern coast, and the northwest region. Specifically, in 2021, the North-East region (48) accounted for 9%, the northern coastal areas (95) for 17%, the eastern coastal areas (64) for 12%, the southern coastal areas (46) for 8%, the Middle reaches of the Yellow River (91) for 17%, the Middle reaches of the Yangtze River (66) for 12%, the southwest region (78) for 14%, and the northwest region (58) for 11%. Clear differences could be observed in the division of educational tourism resources in different areas. The distribution was larger particularly in the eastern region, whereas it was small in the central and western regions. This may be because the eastern region is more socio-economically developed, with superior resource endowment and natural conditions.
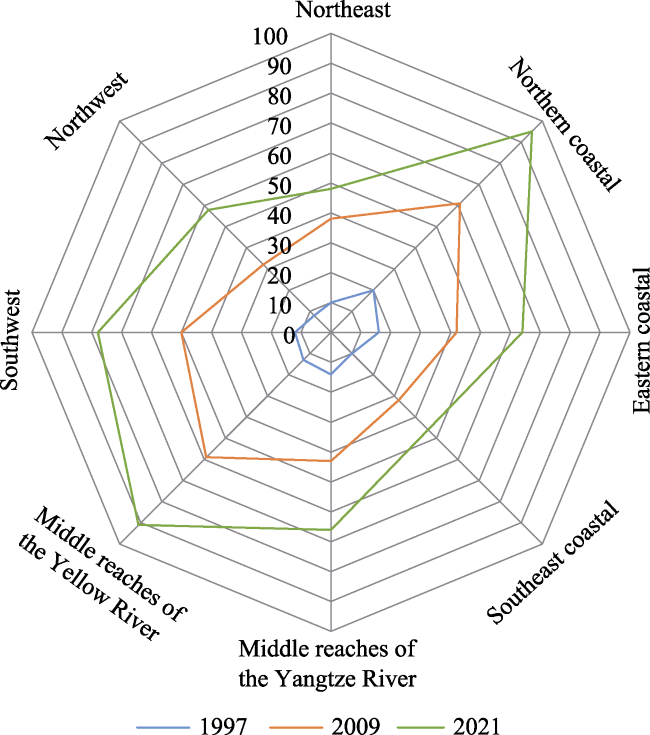
Fig. 5 Spatial distribution of educational tourism resources in eight regions

3.2.4 Spatial correlation characteristics

We used ArcGIS 10.2 software to calculate Moran’s I index of educational tourism resources in 1997, 2009, and 2021, and they were found to be 0.131, 0.243, and 0.173, respectively, with all of them passing the test. The results show a positive spatial self-correlation in China’s educational tourism resources. Moran’s I index showed a trend of initial rise followed by a fall during 1997-2021, reflecting the initial strengthening of educational tourism resources in China followed by weakening. Moreover, educational tourism resources in China exhibited the Matthew effect spatially. After development and cultivation for nearly 20 years, the development of educational tourism resources have achieved transformation from the initial scale to high-quality development. In general, global auto-correlation analysis masks the distribution of local space. To further study the spatial distribution pattern of educational tourism resources, the local spatial correlation index Gi*(d) of educational tourism resources in 1997, 2009, and 2021 was calculated according to the formula, and hot spots were identified (Fig. 6). The hot spots of educational tourism resources showed a certain expansion trend. Hot spots were more active and maintained in Jiangsu, Anhui, and Henan provinces, whereas cold spots were located in Xinjiang, Tibet, and other places, where the development of educational tourism resources was relatively slow. From the perspective of the evolution of hot spots, the hot spots were mainly distributed in the Yangtze River Delta region in 1997 and began to spread gradually to the western provinces by 2009 and finally to the west in 2021. Meanwhile, the number of cold spots remained unchanged, and the polarization between hot and cold spots became increasingly more prominent. The cold spots were mainly distributed in the western and southern regions of China, such as Xinjiang, Tibet, Guangdong, and other provinces. This shows that in recent years, educational tourism resources have developed relatively rapidly, leading to a regional “Matthew effect”. It is necessary to strengthen the coordination and joint development among interregional educational tourism resources in the future. Although the number of educational tourism resources are also increasing in the cold spots, the scale of interregional development still needs to be improved because the growth rate is still low. In the future, several measures can be adopted to facilitate high-quality development and create quality education resources to expand their reach (Sun et al., 2021).
Fig. 6 Evolution of hot spots in the spatial pattern of educational tourism resources

3.3 Factors influencing the spatial distribution

Considering the selection criteria of educational tourism resources and the research results of relevant scholars (Wen and Sinha, 2009), and based on the availability, scientific validity, and feasibility of the data, the following five factors were selected as impact factors: tourism resource endowment (X1), source market (X2), traffic factor (X3), policy orientation (X4), social and cultural factors (X5), and natural factors (X6). Furthermore, 13 indicators were selected to establish an evaluation index system for each factor (Table 2). Among them, tourism resource endowment is the cornerstone of tourism development in educational tourism resources. In this study, the number of 4A level and above scenic spots and number of accommodation facilities were determined. The source market is the fundamental driving force for the development of the educational tourism resources, for which the total tourism revenue and the total number of inbound and outbound tourists were selected. Traffic factor is an important support for tourist accessibility of educational tourism resources. The comprehensive density of railway network and highway density were selected to represent the traffic conditions. Policy factors are an important guarantee for the development of educational tourism resources. The number of “research tourism” mentioned in policy documents and the number of national research bases were selected to represent policy orientation. Social and cultural factors are the basic conditions for the formation of educational tourism resources and the external manifestations of its educational connotation. For these factors, the following two indicators were selected: the number of students in primary and secondary schools and the per capita consumption expenditure on cultural entertainment tourism. Natural factors are the realistic conditions and site foundation of resources formation and development. In this study, elevation, slope, and distance from rivers were selected to represent natural factors. On this basis, each evaluation index was standardized, the weight of each index was calculated according to the entropy method, and the value of each impact factor was calculated comprehensively. Finally, according to the obtained data, the geographical detector was used to quantitatively analyze the influence degree of each factor on the spatial distribution of educational tourism resources.
Table 2 Index system of influencing factors of educational tourism resources spatial distribution
Impact factor The evaluation index Code
Tourism resource endowment (X1) Number of 4A level and above scenic spots X11
Number of accommodation facilities X12
Source market (X2) Tourism revenue X21
Total number of domestic and foreign tourists received X22
Traffic factor (X3) Comprehensive density of railway network X31
Density of highway X32
Policy orientation (X4) Number of references to “research tourism” in the policy document X41
Number of national research and tourism bases X42
Social and cultural factors (X5) Per capita consumption expenditure on culture, entertainment and tourism X51
Enrollment in primary and secondary schools X52
Natural factors (X6) Altitude X61
Slope X62
Distance from river X63
Based on the analysis model and principle of geographic detector, the ArcGIS 10.2 natural break point method was used to conduct discrete data processing for five detection factors, namely tourism resource endowment, traffic factor, policy factor, source market, social and cultural factors, and natural factors. The obtained data can be input into GeoDetector software to reveal the influence intensity q value of each factor on the spatial distribution of educational tourism resources. As shown in Table 3, all the factors passed the significance test, indicating that the six factors have certain influence on the spatial distribution of educational tourism resources, but with varying intensities. Among them, policy orientation (X4) and traffic conditions (X3) have strong influences, with q values of 0.632 and 0.455, respectively. They are followed by resource endowment (X1), source market (X2), social and cultural factors (X5), and natural factors (X6), with an absolute q value above 0.216. In general, the influence intensity of the six factors followed the order policy orientation > traffic conditions > tourism resource endowment > source market > social and cultural factors > natural factors. In order to further verify and analyze the specific influencing mechanism of each factor, the SPSS analysis method, vector data buffer analysis, and layer overlay were performed.
Table 3 Effect intensity q value of each influencing factor
Detection of indicators Tourism resource endowment (X1) Source market (X2) Traffic factor
(X3)
Policy orientation (X4) Social and cultural factors (X5) Naturalfactors (X6)
Influence strengthq value 0.443*** 0.318*** 0.455*** 0.632*** 0.279** 0.216***

Note: ***, ** are significant at 1%, 5% levels respectively.

3.3.1 Natural factors

Terrain and topography are not only the foundation of the layout of educational tourism resources as an independent natural geographical element, but also an important landscape element and an important factor for attracting tourists to different educational tourism resources (Liu et al., 2017). To overlay the spatial distribution map of the educational tourism resources and the national topographic elevation map (Fig. 7a), the corresponding elevation value of each educational tourism resources can be extracted. The results showed the presence of 371 educational tourism resources in the three-level ladder area below 500 m above sea level, accounting for 67.94%, and 131 educational tourism resources in the second-level ladder area at an altitude of 1000-2000 m, accounting for 23.99%. The distribution of educational tourism resources in the first-level ladder area above 4000 m was smaller with only 44 places accounting for 8.07%. Further, the correlation analysis was carried out in SPSS for different elevation values and the distribution of educational tourism resources. Pearson’s correlation coefficient was found to be -0.612 and the correlation passed the significance test. The distribution and altitude of educational tourism resources exhibited a strong negative correlation. This is because in China, the populated is concentrated and the economy is most developed in lower-altitude plains and hilly areas. These areas are the origin of the splendid Chinese civilization with a long history of production and livelihood activities, leading to the formation of historical sites, famous homes, cultural and scientific resources, and technological education resources. Educational tourism resources are concentrated in plain areas below 200 m, showing the distribution law of “gathering plain”. In addition, slope and river system determine the location of educational bases to a certain extent. Educational tourism resources are mostly distributed within a slope range of 5°-15° and within 5 km from rivers, showing the distribution law of “micro slope” and “river”. On the whole, altitude, river system, and slope are important physical geographical factors affecting the distribution of educational tourism resources.
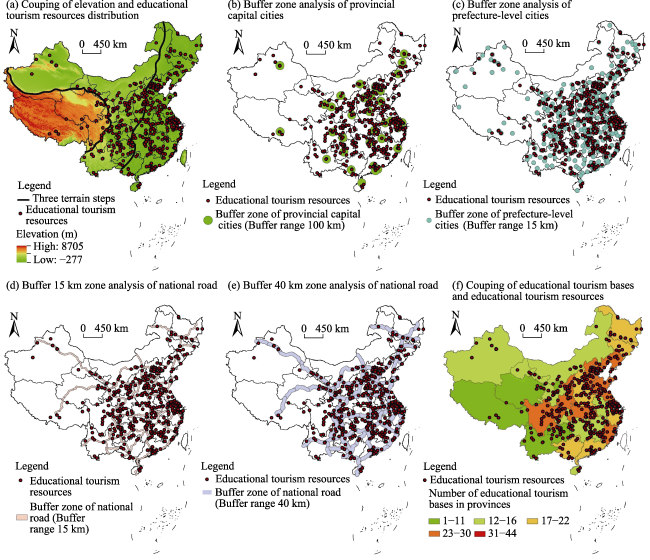
Fig. 7 Factors affecting the distribution of educational tourism resources

3.3.2 Resource endowment

Tourism resources are important resources for the construction of educational tourism resources, which has a direct impact on the spatial distribution of educational tourism resources (Mickiewicz et al., 2017). Red tourist attractions, scientific and technological education resources, ruins, and other unique tourism resources often become important sites for the development of educational tourism resources development in provinces and urban areas. A-class scenic spots represent the best tourism resource endowment in all provinces and cities in China. In this study, the buffer analysis method was used to explore the correlation between educational tourism resources and the spatial distribution of tourist attractions. Several buffer zones of A-level scenic spots were established with buffer radius intervals of 5 km to 50 km, and the buffer zones were intersected with educational tourism resources in 1997, 2009, and 2021 to extract the number of educational tourism resources with different buffer distances. Pearson’s correlation coefficients of different buffer radius and educational tourism resources were further calculated using SPSS. The coefficients were 0.723, 0.812, and 0.954, and the correlations passed the significance test. A strong positive correlation was observed between educational tourism resources and areas with better tourism resource endowment. Educational tourism resources are distributed around high-level tourist attractions, further explaining that the concentration of tourism resources has an important impact on their spatial distribution. A-level scenic areas surrounded by all kinds of tourism resources in a rich and concentrated manner have a perfect public infrastructure for tourism. The distribution of educational tourism resources around it can not only facilitate the sharing of scenic spots, but also help in imparting the marginal effect of scenic spots, realizing the complementary benefits of resources in the region, and achieving a good pattern of mutual benefit and win-win development.

3.3.3 Source market

The source market is an important guarantee for whether educational tourism resources can be invigorated and profitable. Having a broad source market is a necessary condition for the development of an educational tourism resource. In order to explore the specific impact of the source market on the spatial distribution of educational resources, this study characterized the situation of the province’s source market by selecting selected the total number of tourists from each province in 2021 and analyzed the correlation between the total number of tourists and the distribution of educational tourism resources in the provinces using SPSS. Pearson’s correlation coefficient was calculated to be 0.629 and the correlation passed the significance test. This shows that the distribution of educational tourism resources and the source market has a certain coupling correlation. The radiation radius was found to vary according to different city levels. The radiation radius of the general city level was 50 km, and that of a provincial capital city was 100 km. Therefore, buffer radii of 50 km and 100 km were selected to carry out buffer overlay analysis on the cities and the provincial capitals (Figs. 7b, 7c). The results revealed 264 educational tourism resources within the 100 km buffer zone of the provincial capital cities, accounting for 48.35% of the total number of educational tourism resources. The 50 km buffer zone of cities had 486 educational tourism resources, accounting for 89.01% of the total. This shows that educational tourism resources are mainly distributed in the suburbs. It may be concluded that the main customers of educational tourism resources are the residents of the surrounding cities. On the one hand, the distribution of educational tourism resources around a city is convenient for urban residents to visit and study. On the other hand, urban residents are generally well educated and pay wide attention to educational tourism resources and improve their own knowledge ability.

3.3.4 Traffic conditions

Good traffic conditions are one of the prerequisites for the rapid development of tourism, and they serve as a bridge between the source of tourists and tourist destinations. Using the vector data buffer analysis tool in ArcGIS10.2, we determined the relationship between the spatial distribution of educational tourism resources and the traffic of trunk roads. The best perceived distance for tourist destinations is believed to be 15 km by bike in one hour or 40 km by car in one hour. Therefore, this study selected 15 km and 40 km as the radius for the buffer zone analysis of national highways and extracted the number of educational tourism resources in the buffer zone (Figs. 7d, 7e). The results showed 444 educational tourism resources within the buffer radius of 15 km, accounting for 81.32% of the total and 512 educational tourism resources within a buffer radius of 40 km, accounting for 93.77% of the total. This shows that the distribution of educational tourism resources are closely related to convenient transportation conditions; educational tourism resources show the characteristics of distribution along the main road of transportation. In the future, the convenience advantages of main roads can be fully considered in the development of educational tourism resources, educational tourism resources can be integrated into regional tourist routes, build them as a tourist destination, and normal learning and education activities can be carried out as the second classroom of all kinds of schools. The backward traffic conditions in some areas will restrict the further development of educational tourism resources to some extent. Therefore, for the effective development and high-quality development of educational tourism resources in such areas, the traffic environment must be improved, the construction of transportation networks strengthened, important road networks opened, high-speed entrances and exits connected, road accessibility comprehensively improved, and necessary traffic guarantee provided.

3.3.5 Policy orientation

Strong policy support is an important guarantee for the development of educational tourism resources (He, 2016). In recent years, the state and local governments have issued several policies to support the development of educational tourism resources and given financial support in the areas of resources management, stadium construction, and personnel training. Particularly in first-mover areas of the development of educational tourism resources, such as Beijing, Hunan, Jiangsu, Sichuan, Hubei, Fujian, Henan, Hebei, Liaoning, and Shandong, relevant policy documents have been issued. While building educational tourism resources, governments actively carry out the selection activities of educational tourism resources at the provincial level. Conditions have been created for the development of educational tourism resources at the national and local levels. These 10 provinces and municipalities have a total of 264 educational tourism resources accounting for 48.35% of the total. To some extent, this reflects the positive influence of provincial policies on the spatial distribution of educational tourism resources. In addition, tourism bases and scenic spots are similar to the educational tourism resources and the product of national policy. In order to study the policy impact of educational tourism resources further, the distribution of educational tourism resources was superimposed on the distribution of tourism bases and scenic spots of the provinces (Fig. 7f). The results show strong coupling among the distributions of educational tourism resources, tourism bases, and scenic spots. Pearson correlation analysis was carried out in SPSS, and the coefficients were found to be 0.762 and 0.714 respectively, all of which are significant at the 1% level. It indicates that the spatial distribution of educational tourism resources is related to those of tourism bases and scenic spots. A significant positive correlation was also observed with the distribution of classic scenic spots of red tourism that were jointly influenced by national policies. The development policy environment of national and local governments have a promoting effect on the construction of educational tourism resources in the region, and the introduction of policies can not only guide the overall development direction of educational tourism resources, but also solve bottlenecks encountered in the construction of educational tourism resources in a timely manner.

3.3.6 Social and cultural factors

Social and cultural factors are an important basis for the formation of educational tourism resources. In the long history of human development, people’s production, ecology, and living space have nurtured a large number of educational tourism resources, which are the core attractions of tourism development. In general, the deeper the cultural heritage of a place, the more importance its residents attach to children’s education. The greater the demand of educational tourism products, the greater the spatial distribution of educational tourism resources. In terms of the quantity and spatial distribution of educational tourism resources, the former residences of celebrities have the largest distribution and are more distributed in the socially and economically developed areas such as the Beijing-Tianjin-Hebei and Yangtze River Delta urban agglomerations, which indicates to a certain extent that educational tourism resources have a strong correlation with local social culture. The Beijing- Tianjin-Hebei region is the political, economic and cultural center of China, and its educational tourism resources are the most abundant, while the Yangtze River Delta region is the economic center of the country, and its cultural heritage has been profound since ancient times. These areas have a large number of celebrities, and the people of these areas attach the most importance to cultural education, thus forming a large number of educational tourism resources. Further, the correlation analysis of educational tourism resources and per capita expenditure on cultural and entertainment tourism in each province was carried out in SPSS, and the results show a correlation coefficient of 0.875 between the two, which passes the significance test. This also shows that the level of social and cultural consumption in the region has a great impact on the distribution of educational tourism resources in the region. Therefore, all localities should pay attention to the construction of the regional social and cultural atmosphere, guide urban residents’ demand for educational tourism resources and tourism products, and help realize the large-scale, high-quality quantitative development of the educational tourism industry.

4 Discussion

4.1 Optimization of the spatial layout of educational tourism resources

First, the spatial layout of educational tourism resources should be optimized. The central and western regions have relatively small numbers of educational tourism resources. To widen the national distribution of educational tourism resources, attention should be paid to the promotion of educational tourism resources in the central and western regions. It will lay a solid foundation for creating a new model of region-wide development of educational tourism resources and creating a new pattern of joint construction and sharing between residents and the government, realizing the balanced development of educational tourism resources spatially (Boonwanno et al., 2022).
Second, it is necessary to realize the joint regional development of educational tourism resources. We can focus on building education resource boards in the Beijing-Tianjin- Hebei region and the Yangtze River Delta region, through which development can be radiated to crucial regions by combining the spatial distribution agglomeration and spatial association characteristics of education resources. It is essential to coordinate the construction and management of educational tourism resources nationwide, explore the cooperative development and management of educational tourism resources between regions, and promote the linkage and synergistic development of educational tourism resources.
The third aspect is to increase policy support for educational tourism resources. The government should make top-level design for developing and constructing educational tourism resources and give appropriate policy inclination and support in the planning and construction of educational tourism resources, product development, and training of practitioners (Kim et al., 2019). To realize high-quality development, the development and construction of educational tourism resources should be incorporated into the development strategy of the whole area of tourism in each region, increase the financial investment in educational tourism resources, dig deeper into their cultural connotations, develop a series of products according to local conditions, improve the taste of products, and eventually form the state education tourism products line.

4.2 New ideas for the differentiated development of educational tourism resources

By analyzing the causes of the distribution pattern of educational tourism resources, the development of educational tourism resources can be divided into the following categories for differentiated development: tourism resources dependent type, market dependent type, and traffic location-driven type. 1) Tourism resources dependent type: In the development of educational tourism resources, the cooperation with scenic spots, resort areas, and rural tourism spots should be constantly strengthened. In particular, relying on the advantages of the surrounding A-level scenic spots, their “spillover effect” should be fully absorbed and educational tourism destinations should be jointly created, so as to form a good situation of complementary advantages and ensure win-win cooperation. 2) Market dependent type: The educational tourism tourist market mainly takes local urban residents as the main source of tourists, and enterprises should be subdivided into children, youth, middle-aged, and elderly markets according to different age structures. To meet the needs of different age groups, targeted educational tourism products should be provided and characteristic tourist routes should be organized. In addition, for the high-end tourist market of the Beijing-Tianjin-Hebei and Yangtze River Delta urban agglomerations in China, it is necessary to continuously improve the connotation of educational tourism products to meet their tourism needs. 3) Traffic location-driven type: For educational tourism resources with good transportation location, it is necessary to integrate the development of educational tourism products into regional tourism routes, build tourism nodes according to their traffic conditions, and create scenic paths, stations and observation platforms with educational tourism characteristics to achieve the development of global tourism. In addition, we should strengthen cooperation and exchanges with primary and secondary schools, build second classrooms for primary and secondary schools in areas with good resource endowment, and constantly improve the utilization of educational resources. In this manner, the utilization rate of education resources can be improved.
Previous scholars studied educational tourism resources mainly from the perspectives of sociology and management, etc. This study explored the spatial-temporal evolution characteristics and influencing factors of China’s tourism education resources from the perspective of geography. In terms of data selection, previous studies mainly used cross-section data to investigate further expansion and improvement of the spatial structure of educational tourism resources (Wu et al., 2021; Zhu et al., 2023). This study represents the first use of panel data to investigate the spatial evolution characteristics of educational tourism resources in China. Regarding the influencing factors of educational tourism resources, previous research was relatively simple and lacked scientific validity. This study selected 14 indicators from six dimensions to comprehensively explore the influence mechanism of the spatial distribution of educational tourism resources.

4.3 Limitations and future research prospects

Constrained by data acquisition and other issues, this study still has room for improvement. For instance, different levels and different types of educational tourism resources can be considered, and the impact of other elements on the distribution of educational tourism resources can be further explored. These issues are of high significance and will also be the focus of a follow-up study.

5 Conclusions

In this study, the evolution and causes of the spatiotemporal patterns of educational tourism resources in China from 1997 to 2021 were analyzed using ArcGIS 10.2 and different research methods. The following conclusions can be drawn:
Firstly, educational tourism resources can be divided into four types: historical sites, museums and science museums, hall of fame, and cultural educational venues, of which the halls of fame account for the largest proportion at about 35%, whereas museums and science museums account for the smallest proportion at only about 15%.
Secondly, educational tourism resources present a condensed distribution trend, with unequal probability distribution in space and distinct fractal characteristics. The distribution exhibits a “dual-core structure” with the Beijing-Tianjin-Hebei and Yangtze River Delta urban clusters as high-density cores. The hot spots of educational tourism resources gradually spread from the Yangtze River Delta region to the western provinces, and the number is increasing. The cold spots are mainly distributed in the southwest of China, and the number remains unchanged. The phenomenon of polarization between hot spots and cold spots is becoming increasingly more prominent.
Thirdly, the causes of the spatial distribution pattern of educational tourism resources are complex and diverse. Specifically, resource endowment, natural factors, tourist market, traffic conditions, and policy orientation are the main factors affecting educational tourism resources. By order of the intensity of the influence, the factors can be ranked as policy orientation > traffic conditions > tourism resource endowment > source market > social and cultural factors > natural factors.
[1]
Abubakar A M, Shneikat B H T, Oday A. 2014. Motivational factors for educational tourism: A case study in Northern Cyprus. Tourism Management Perspectives, 11: 58-62.

[2]
Akiyama K, Hayashi H. 2006. Strigolactones: Chemical signals for fungal symbionts and parasitic weeds in plant roots. Annals of Botany, 97: 925-931.

PMID

[3]
Atsa’am D D, Bodur E K. 2022. Mining the moderating role of organizational tenure in the association between PsyCap and educational qualifications among tourism and hospitality workers. Journal of Public Affairs, 22: 22-27.

[4]
Bodger D. 1998. Leisure, learning, and travel. Journal of Physical Education, Recreation & Dance, 69(4): 28-31.

[5]
Boonwanno S, Laeheem K, Hunt B. 2022. Takua Pa Old Town: Potential for resource development of community-based cultural tourism management. Journal of Social Science, 43: 88-93.

[6]
Buckley R. 2011. Tourism and environment. Annual Review of Environment and Resources, 36: 397-416.

[7]
Chen B, Nakama Y. 2013. Thirty years of forest tourism in China. Journal of Forest Research, 18: 285-292.

[8]
Cheng C K, Li X R, Petrick J F. 2011. An examination of tourism journal development. Tourism Management, 32: 53-61.

[9]
Chi X, Lee S K, Ahn Y, et al. 2020. Tourist-perceived quality and loyalty intentions towards rural tourism in China. Sustainability, 12(9): 3614-3619.

[10]
Chi Y, Qian T, Sheng C, et al. 2021. Analysis of differences in the spatial distribution among terrestrial mammals using Geodetector—A case study of China. ISPRS International Journal of Geo-Information, 10: 21. DOI: 10.3390/ijgi10010021.

[11]
Gibson H. 1998. The education tourist. Physical Education, Recreation & Gance, 69(4): 32. DOI: 10.1080/07303084.1998.10605533.

[12]
Hall C M, Scott D, Gössling S. 2020. Pandemics, transformations and tourism: Be careful what you wish for. Tourism Geographies, 22: 577-598.

[13]
He L. 2016. Transnational higher education institutions in China: A comparison of policy orientation and reality. Journal of Studies in International Education, 20: 79-95.

[14]
Helda H, Syahrani S. 2022. National standards of education in contents standards and education process standards in Indonesia. Indian Journal of Education, 2: 257-269.

[15]
Ivanov S, Webster C. 2020. Robots in tourism: A research agenda for tourism economics. Tourism Economics, 26: 1065-1085.

[16]
Jang K, Sakamoto K, Funck C. 2021. Dark tourism as educational tourism: The case of ‘hope tourism’ in Fukushima, Japan. Journal of Heritage Tourism, 16: 481-492.

[17]
Kabanova E E, Frolova E V, Medvedeva N V, et al. 2016. Cultural and educational tourism in the Russian Federation: Basic problems and development resources. International Review Management Markers, 6: 206-210.

[18]
Kim J. 2020. Learning and teaching online during Covid-19: Experiences of student teachers in an early childhood education practicum. International Journal of Early Childhood, 52: 145-158.

[19]
Kim S, Whitford M, Arcodia C. 2019. Development of intangible cultural heritage as a sustainable tourism resource: The intangible cultural heritage practitioners’ perspectives. Journal of Heritage Tourism, 14: 422-435.

[20]
Kwan M P. 2002. Feminist visualization: Re-envisioning GIS as a method in feminist geographic research. Annals of the American Association of Geographers, 92: 645-661.

[21]
Lau P L, Koo T T, Wu C L. 2020. Spatial distribution of tourism activities: A polya urn process model of rank-size distribution. Journal of Travel Research, 59: 231-246.

[22]
Li J, Dou K, Wen S, et al. 2021. Monitoring index system for sectors’ digital transformation and its application in China. Electronics, 10: 1301. DOI: 10.3390/electronics10111301.

[23]
Liu C, Dou X, Li J, et al. 2020. Analyzing government role in rural tourism development: An empirical investigation from China. Journal of Rural Studies, 79: 177-188.

[24]
Liu H, Fang C, Zhang X, et al. 2017. The effect of natural and anthropogenic factors on haze pollution in Chinese cities: A spatial econometrics approach. Journal of Cleaner Producation, 165: 323-333.

[25]
Malczewski J. 2006. GIS-based multicriteria decision analysis: A survey of the literature. International Journal of Geographical Information Scienca, 20: 703-726.

[26]
Mansour S. 2016. Spatial analysis of public health facilities in Riyadh Governorate, Saudi Arabia: A GIS-based study to assess geographic variations of service provision and accessibility. Geo-spatial Information Science, 19: 26-38.

[27]
McGladdery C A, Lubbe B A. 2017. International educational tourism: Does it foster global learning? A survey of South African high school learners. Tourism Management, 62: 292-301.

[28]
Mickiewicz T, Nyakudya F W, Theodorakopoulos N, et al. 2017. Resource endowment and opportunity cost effects along the stages of entrepreneurship. Small Business Economics, 48: 953-976.

[29]
Ohe Y. 2018. Educational tourism in agriculture and identity of farm successors. Tourism Economics, 24: 167-184.

[30]
Pitman T, Broomhall S, Majocha E. 2011. Teaching ethics beyond the academy: Educational tourism, lifelong learning and phronesis. Studies in the Education of Adults, 43(1): 4-17.

[31]
Sarrión-Gavilán M D, Benítez-Márquez M D, Mora-Rangel E O. 2015. Spatial distribution of tourism supply in Andalusia. Tourism Management Perspectives, 15: 29-45.

[32]
Sharpley R. 2020. Tourism, sustainable development and the theoretical divide: 20 years on. Journal of Sustainable Tourism, 28: 1932-1946.

[33]
Shi T, Wang Y. 2020. Heavy metals in indoor dust: Spatial distribution, influencing factors, and potential health risks. Science of the Total Environment, 755: 12-19.

[34]
Smith A. 2013. The role of educational tourism in raising academic standards. African Journal Hospice Tourism Leisure, 2: 1-7.

[35]
Sokai R R, Oden N L. 1978. Spatial autocorrelation in biology. Methodology Biological Journal of Linnean Society, 10: 199-228.

[36]
Stoica G D, Andreiana V A, Duica M C, et al. 2022. Perspectives for the development of sustainable cultural tourism. Sustainability, 14: 5678. DOI: 10.3390/su14095678.

[37]
Sun C, Yan X, Zhao L. 2021. Coupling efficiency measurement and spatial correlation characteristic of water-energy-food nexus in China. Resources Conservation and Recycling, 164: 105151. DOI: 10.1016/j.resconrec.2020.105151.

[38]
Tomasi S, Paviotti G, Cavicchi A. 2020. Educational tourism and local development: The role of universities. Sustainability, 12: 6766. DOI: 10.3390/su12176766.

[39]
Wang J, Ayres H, Huyton J. 2010. Is tourism education meeting the needs of the tourism industry? An Australian case study. Journal of Hospitality Tourism Education, 22: 8-14.

[40]
Wang J, Xu C. 2017. Geodetector: Principle and prospective. Acta Geographica Sinica, 72(1): 116-134. (in Chinese)

DOI

[41]
Wen J J, Sinha C. 2009. The spatial distribution of tourism in China: Trends and impacts. Asia Pacific Journal of Tourism Research, 14: 93-104.

[42]
Wu R L, Li H Y, Tian F J. 2021. Spatial distribution and influencing factors of national research and tourism bases in China. Scientia Geographica Sinica, 41(7): 1139-1148. (in Chinese)

[43]
Zhang M. 2021. Spatial distribution pattern and influencing factors of sports tourism resources in China. ISPRS International Journal of Geo-Information, 10: 31-37.

[44]
Zhang W, Fan X. 2006. Tourism higher education in China: Past and present, opportunities and challenges. Journal of Teaching Travel Tourism, 5: 117-135.

[45]
Zhang X, Lin Y, Cheng C, et al. 2021. Determinant powers of socioeconomic factors and their interactive impacts on particulate matter pollution in North China. International Journal of Environmental Research and Public Health, 18: 6261. DOI: 10.3390/ijerph18126261.

[46]
Zhang Y, Zhang D. 2021. Efficiency measurement and influencing factors of ecological compensation: A case study from Wuqi and Zhidan on the Loess Plateau. Natural Resources Research, 30: 4905-4921.

[47]
Zhong L, Deng J, Song Z, et al. 2011. Research on environmental impacts of tourism in China: Progress and prospect. Journal of Environmental Management, 92: 2972-2983.

DOI PMID

[48]
Zhong Z, Peng B, Elahi E. 2021. Spatial and temporal pattern evolution and influencing factors of energy-environmental efficiency: A case study of Yangtze River urban agglomeration in China. Energy Environmental Science, 32: 242-261.

[49]
Zhu L, Li Y N, Hu J, et al. 2023. Multi-scale characteristics and influencing mechanism of spatial pattern of research and practice base in China. Arid Land Geography, 46(4): 625-635. (in Chinese)

[50]
Zou Z, Yi Y, Sun J. 2006. Entropy method for determination of weight of evaluating indicators in fuzzy synthetic evaluation for water quality assessment. Journal of Environmental Sciences, 18(5): 1020-1023.

[51]
Zuo Y, Chen H, Pan J, et al. 2021. Spatial distribution pattern and influencing factors of sports tourism resources in China. ISPRS International Journal of Geo-Information, 10: 428. DOI: 10.3390/ijgi10070428.

Outlines

/