Tourism Resilience and Tourism Risk

Vulnerability and Influencing Factors for Rural Settlements Land Use in Karst Mountains of China: Case Study on Qixingguan District

  • WEI Zehang , 1 ,
  • SUN Jianwei , 1, * ,
  • YANG Liu 2 ,
  • LUO Jing 3 ,
  • ZOU Qiuyu 1
Expand
  • 1. School of Geographical and Environmental Sciences, Guizhou Normal University, Guiyang 550025, China
  • 2. School of Public Administration, Guizhou University, Guiyang 550025, China
  • 3. Key Laboratory for Geographical Process Analysis & Simulation of Hubei Province, Central China Normal University, Wuhan 430079, China
*SUN Jianwei, E-mail:

WEI Zehang, E-mail:

Received date: 2023-04-09

  Accepted date: 2023-09-12

  Online published: 2024-05-24

Supported by

The National Natural Science Foundation of China(41961031)

The National Natural Science Foundation of China(42271228)

The National Natural Science Foundation of China(42361028)

The Guizhou Provincial Science and Technology Project(Qiankehe Foundation ZK(2022))

The Guizhou Provincial Science and Technology Project(General 313)

The 2019 Academic New Seedling Cultivation and Innovation Exploration Special Project of Guizhou Normal University(Qian Shi Xin Miao(2019))

The 2019 Academic New Seedling Cultivation and Innovation Exploration Special Project of Guizhou Normal University(A13)

Abstract

Studying the vulnerability of rural settlements is necessary for their revitalization and sustainable development. In this study, a basic organizational framework and evaluation system that considers the natural environment, social development, and other factors in terms of exposure, sensitivity, and adaptability were developed for the vulnerability of rural settlements. Qixingguan District of Bijie City was considered as a case study, and a geographic information system spatial analysis function and geographic probe model were applied to determine the spatial distribution and characteristics of rural settlement vulnerability in karst mountains and their influencing factors. The results demonstrated that rural settlements here have a multicore distribution pattern where the vulnerability is moderately low overall but has significant spatial heterogeneity. There is a considerable positive spatial correlation between vulnerable rural settlements and weakly negative correlations between exposure and adaptability and between sensitivity and adaptability, which can be attributed to the interaction among natural, human-made, and social factors. The primary factors influencing the vulnerability of rural settlements here are stone desertification and soil erosion. These results have important theoretical and practical value for enhancing the stability of rural human-land systems in karst mountains and their long-term protection.

Cite this article

WEI Zehang , SUN Jianwei , YANG Liu , LUO Jing , ZOU Qiuyu . Vulnerability and Influencing Factors for Rural Settlements Land Use in Karst Mountains of China: Case Study on Qixingguan District[J]. Journal of Resources and Ecology, 2024 , 15(3) : 720 -732 . DOI: 10.5814/j.issn.1674-764x.2024.03.018

1 Introduction

Rural settlements serve as an important vehicle for the productive life of the rural population (Liu and Li, 2017) and the core of human-land relations in rural areas (Qu et al., 2019). However, the spread of urbanization and industrialization has (Yang et al., 2015) destabilized the spatial patterns, economy, and environment of rural areas (Yang, 2019), and their increasing vulnerability poses a major challenge to the revitalization of rural areas and integrated urban-rural development (Liu et al., 2021). Vulnerability is a major topic of interest in sustainability research that has long received attention from international scientific programs such as the Intergovernmental Panel on Climate Change (IPCC), International Geosphere-Biosphere Program (IGBP), and International Human Dimensions Program (IHDP) (Buchman et al., 2005; Leiter, 2022). In 2018, the Organization for Economic Cooperation and Development released a report highlighting the continued vulnerability of ecosystems, economic systems, and sociocultural systems driven by a combination of factors (Yang et al., 2021). Existing studies often need to adequately consider the intricate interplay of natural and human environmental elements. Besides, they tend to overlook the fundamental connections among different systems. Moreover, these studies frequently need to pay more attention to incorporating the complex relationship among exposure, sensitivity, and adaptive capacity when assessing vulnerability. The IPCC defines vulnerability as “the degree to which a system is vulnerable or unable to cope with the adverse effects of climate change perturbations (including variability and extreme events) as a function of the characteristics of climate variability, the magnitude and rate of change, and the sensitivity and adaptive capacity of the system” (IPCC, 2007). The concept of vulnerability has been developed from the 1960s to this day as a basis for evaluating the current state of regional development and measuring future trends (Yang et al., 2019a). Such evaluations have gradually evolved from focusing on single factors such as the natural environment or climate change to regional human-earth coupled systems such as socioecological systems (Wang et al., 2015), natural-social systems (Zhou et al., 2018), human-sea systems (Li et al., 2018), and urban systems (Fang and Wang, 2015; Maikhuri et al., 2017). Research methods have shifted from qualitative research to integrated research using pressure-state- response (PSR) models (Zhang et al., 2017), interactive vulnerability assessment (Metzger et al., 2006), the vulnerability scoping diagram (VSD) (Polsky et al., 2007), and other qualitative and quantitative analyses. They have shifted from a single and reactive evaluation of the negative impacts of a system’s vulnerability to a proactive exploration of multiple factors influencing the vulnerability evolution of small-scale areas and coping strategies (He et al., 2016). Study areas have expanded from coastal areas (Li et al., 2018) and ecological lakes (Wang, 2015), where the physical geography is vulnerable (He and Peng, 2021), to tourist sites and rural areas (Wang and He, 2020), where people are vulnerable. However, the current vulnerability studies have rarely focused on rural areas, and even fewer have focused on rural settlements existing as a patchwork.
In 2019, China’s progress report on the implementation of the 2030 Agenda for Sustainable Development stated that the country should move in the direction of reducing vulnerability and increasing the resilience and recovery of its rural settlements for improved sustainability (Liu et al., 2021). China’s rural areas are in an important period of transformation. They face problems such as wasted land resources, capital shortages, and hollowing out of their industries and population, which has caused them to lag in socioeconomic development (IPCC, 2007). Existing studies often need to consider the intricate interconnections among various systems and the inherent interplay between natural and human environmental elements. Additionally, they overlook the critical relationship among exposure, sensitivity, and adaptive capacity when assessing vulnerability, as noted by Wang et al. (2023). Furthermore, a significant proportion of scholars predominantly investigate the influence of natural factors on ecological vulnerability, as evidenced by the works of Li et al. (2002) and Guo et al. (2017). Unfortunately, anthropogenic factors do not receive the adequate attention they deserve in these studies. Especially in integrated urban-rural development, China’ rural settlements have long lacked a comprehensive layout and standardized management, thus resulting in scattered land use, lack of functional support, and empty waste (Liu et al., 2016), as well as resulting in increasing system instability and overall vulnerability.
The fragmented topography and low carrying capacity of soil and water resources in the karst mountains have led to considerable ecological and environmental problems here (Yang et al., 2021), and their special geological background and ecological environment overlaid with intense human activities have led to widespread concerns over the vulnerability of their rural settlements (Hou et al., 2016). The absence of established methods for constructing and evaluating a vulnerability indicators system for rural settlements in the karst mountain has resulted in a notable gap in objective knowledge. This gap pertains to the analysis of vulnerability identification within rural settlement systems in karst mountain regions at the regional level. It encompasses various aspects, including the contributions of different indicators, impacts, coupling relationships, and regional disparities. The deficiency in understanding has consequently hindered the support required for promoting the sustainable development of karst mountain areas. In contrast to a comprehensive approach to ecological vulnerability on a macro-regional scale, this study adopts a narrower focus. Specifically, this study focuses on assessing the vulnerability of rural settlements within the Qixingguan District, which is situated within the karst mountains. This study is expected to contribute to understanding how to harmonize rural socioeconomic development with ecological protection. It will provide a scientific basis for reducing the vulnerability of rural settlements in karst mountains, enhancing their resilience, and guiding their sustainable development.

2 Materials and methods

2.1 Study area

Figure 1 shows the study area. Qixingguan District (104°51′- 105°55′E, 27°03′-27°46′N) is part of Bijie City, Guizhou Province, with a land area of 3412 km2. It is in the hinterlands of the Wumeng Mountains, where Sichuan, Yunnan, Guizhou, and Chongqing intersect. In 2020, the district had 11 streets, 24 towns, two townships, six ethnic townships, and 517 administrative villages for a total of 23020 rural settlements. The district has a total population of 1305100 and a rural population of 609900. Urban residents have a disposable income of 36147 yuan per capita, and rural residents have a much lower income of 11378 yuan per capita. The district has a subtropical humid monsoon climate with an average annual temperature of 12.5 °C and an average annual rainfall of 954 mm. The spatiotemporal distribution of rainfall is uneven with it being more concentrated in the southeast and less in the northwest and mostly falling in the months of June to September. Areas with high concentrations of precipitation experience soil erosion and stone desertification. The topography is elevated in the west and low in the east with a typical karst landscape and an average elevation of 1522 m. The district is predominantly mountainous with poor-quality arable land and a large proportion of land covered by slopes. The land use is crude, and the relationship between the people and the land is tense.
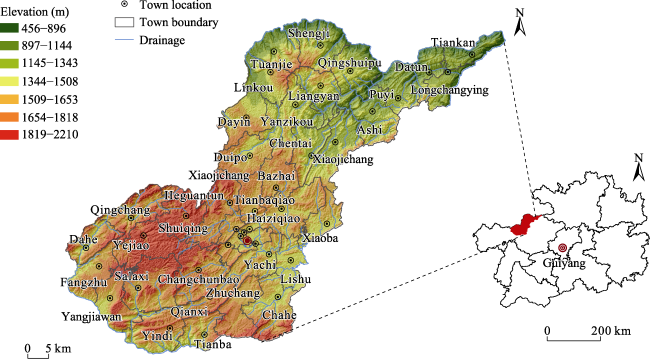
Fig. 1 Location, administrative division, and terrain distribution of the study area

2.2 Data source

The ArcGIS 10.6 platform was used to extract 23020 vector patches representing the rural settlements from a 2020 land use status map (1:10000) of Qixingguan District. Topographic and remote sensing image data were obtained from the Geospatial Data Cloud (http://www.gscloud.cn/) and the United States Geological Survey (http://earthexplorer.usgs.gov/). Administrative zoning and meteorological data were obtained from the Standard Map Service of the Department of Natural Resources of Guizhou Province (https://zrzy.guizhou.gov.cn/) and the National Earth System Science Data Centre (http://www.geodata.cn/), respectively. Hazard monitoring data, stone desertification data, and soil erosion data were obtained from the Forestry Department of Qixingguan District. Normalized vegetation indices were obtained from the NASA EOS/MODIS data network (ladsweb. nascom.nasa.gov). Data on education and health facilities were obtained from the industrial sectors, and geographic coordinates were obtained from the Baidu map pickup coordinate system (http://api.map.baidu.com/). Traffic road network data were obtained from the National Geographic Information Resources Catalogue Service.

2.3 Research framework

2.3.1 Kernel density estimation

Kernel density estimation is a nonparametric method used in probability theory to estimate an unknown density function based on the object of study itself. It can be used to effectively represent the degree of aggregation for the spatial distribution of rural settlements (Sun et al., 2017; Kong et al., 2019). The function is expressed as follows:
$f\left( x \right)=\frac{1}{n{{h}^{2}}}\sum\limits_{i=1}^{n}{k\left( \frac{x-{{x}_{i}}}{h} \right)}$
where f(x) is the estimated kernel density at position x; h is the bandwidth; n is the number of points within the bandwidth; k is the kernel function and x-xi is the distance from position x to position xi.

2.3.2 Selection of indicators

The vulnerability of rural settlements can be defined as the negative effects or damage that they suffer because of exposure to the interactive and synergistic perturbations of the adverse natural environment and social change, combined with their sensitivity and lack of adequate resilience to risk. Thus, the vulnerability of rural settlements can be expressed as a function of three dimensions: Exposure, sensitivity, and adaptability (Huang et al., 2018). Based on a review of the relevant domestic and international literature and the Delphi method, a research framework was organized with a top- down structure comprising target, criterion, element, and indicator layers. Table 1 presents the 15 selected indicators for assessing the vulnerability of rural settlements in the karst mountains. Figure 2 shows the research framework of the study.
Table 1 Selected vulnerability indicators for rural settlements in the karst mountains
Rule layer Element layer Index layer Indicators explanation Weight
Exposure (E) Natural pressure E1 Stone desertification intensity (+) Reflecting the geological environment and human-land conflicts in rural settlements 0.2588
E2 Soil erosion intensity (+) Reflects the overall ecological status of rural settlements and soil fertility levels 0.1717
E3 Geological hazard index (+) A composite index is calculated from four indicators: the scale of the hazard, the number of households at risk, the number of people at risk and the potential economic loss, reflecting the quality of the address environment, the level of impact and the safety of the hazard 0.0347
Human interference E4 Number of people in agriculture (+) Converting the population of each village in the statistical yearbook to a settlement based on the area of the rural settlement, reflecting the density of the rural settlement 0.1234
E5 Arable land within 1 km (‒) Reflects the abundance of land resources, ease of cultivation, and level of agricultural development in rural settlements 0.0268
Sensitivity (S) Climatic conditions S1 Average annual precipitation (‒) Reflects average annual precipitation in rural settlements 0.0473
S2 Average annual sunshine hours (‒) Reflects average annual sunlight in rural settlements 0.0275
Terrain conditions S3 Slope (+) Reflects the degree of steepness and slope of the surface in rural settlements 0.0754
S4 Terrain undulation (+) Reflects the relative ground-level differences and land use advantages and disadvantages of rural settlements 0.0248
Ecological status S5 Vegetation cover (‒) Reflects the growth of surface vegetation and the quality of the ecological environment in rural settlements 0.0261
S6 Net primary productivity of vegetation (‒) Estimation of NPP in the study area using remote sensing, meteorological and field survey data based on the CASA model to reflect the quality and functional status of ecosystems in rural settlements 0.0161
Adaptive (A) Social support A1 Educational accessibility (‒) A Gaussian two-step moving search model was used to calculate the accessibility of each rural settlement to educational facilities, reflecting the level of access to education and the level of educational facilities 0.0140
A2 Medical accessibility (‒) A Gaussian two-step moving search model was employed to estimate the accessibility of each rural settlement to a health facility, thereby reflecting the capacity of health care supply and demand and the level of infrastructure availability 0.0418
Self-regulation A3 Water point accessibility (‒) A Gaussian two-step moving search model was utilized to calculate the accessibility of each rural settlement to water points, reflecting the accessibility of rural settlements to water in emergency 0.0372
A4 Distance to the nearest road (‒) It reflects accessibility and road density in rural settlements 0.0746
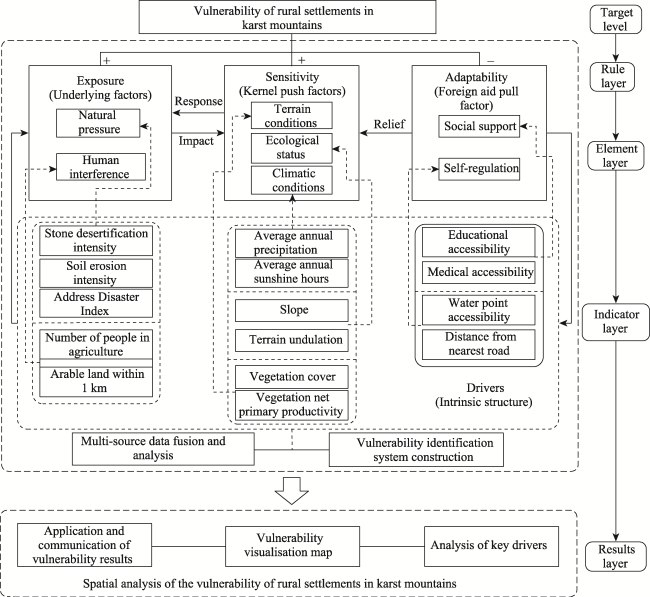
Fig. 2 Research framework for assessing the vulnerability of rural residents in Qixingguan District

Note: The symbol “+” denotes a favorable influence on vulnerability, while the symbol “-” signifies an adverse effect on vulnerability.

Exposure can be defined as the degree to which a system is adversely affected by external pressures or stresses (Polsky et al., 2007). A rural settlement with higher exposure is more vulnerable to external disturbances. In this study, the exposure dimension was decomposed into two elements: natural pressure and anthropogenic disturbances. Natural pressure comprises typical natural disasters that may affect rural settlements in the karst mountains. Three indicators were selected to explain natural pressure: stone desertification intensity, soil erosion intensity, and geological hazard index. Anthropogenic disturbances are caused by human society and activities. Two indicators were selected to explain anthropogenic disturbances: the number of rural people and the area of cultivated land within a distance of 1 km. The arable land area plays a pivotal role in determining food production, and the quantity of arable land within the buffer zone of rural settlements substantially impacts agricultural functionality. According to a study by Yang et al. (2020), the buffer zone was established at a distance of 1 km.
Sensitivity is contingent on the type of exposure and system characteristics, and it can be defined as the extent to which a system responds to stress or strain (Li and Fan, 2014). A rural settlement with higher sensitivity is less stable against external disturbances, which increases its vulnerability. The productivity, living, and ecological functions of a settlement were considered from the perspective of the residents to divide the sensitivity dimension into three elements: climatic conditions, topographic conditions, and ecological status. The following indicators were selected to explain these elements: the average annual precipitation and average annual sunshine hours for the climatic conditions, the slope and topographic relief for the topographic conditions, and the vegetation cover and net primary productivity (NPP) of the vegetation for the ecological status.
Adaptability can be defined as the ability of a system to deal with and adapt to the consequences of external stresses and disturbances (Wang and He, 2020). A rural settlement with high adaptability can more easily reduce or eliminate negative impacts, which reduce its vulnerability. The adaptability dimension was decomposed into two elements: social support and self-regulation. The following indicators were selected to explain these elements: educational accessibility and medical accessibility for social support, and water point accessibility and distance to the nearest road for self-regulation.

2.3.3 Vulnerability assessment

The above indicators were integrated to formulate a composite vulnerability index. To eliminate the complex diversity and dimensional differences among indicators, the extreme difference standardization method was used to standardize positive and negative indicators:
Positive indicators:
${{\operatorname{X}}_{i}}=\frac{{{\operatorname{x}}_{i}}-min\left( {{x}_{i}} \right)}{max\left( {{x}_{i}} \right)-min\left( {{x}_{i}} \right)}$
Negative indicators:
${{X}_{i}}=\frac{\max \left( {{x}_{i}} \right)-{{x}_{i}}}{\max \left( {{x}_{i}} \right)-\min \left( {{x}_{i}} \right)}$
where Xi is the standardized value of the i-th indicator; max(xi) is the maximum value of the i-th indicator; and min(xi) is the minimum value of the i-th indicator. The indicators were weighted according to the analytic hierarchy process (AHP) and the entropy weight method to calculate their final weights (Table 1) (Liu et al., 2020):
${{W}_{i}}=\frac{1}{2}\left( {{W}_{i}}^{\prime }+{{{{W}''}}_{i}} \right)$
where ${{W}_{i}}$is the combined weight of an indicator; ${{W}_{i}}^{\prime }$is the subjective weight of the indicator; and ${{W}_{i}}^{\prime \prime }$is the objective weight of the indicator.
The following model was used to evaluate the vulnerability of rural settlements in karst mountains:
$V=E+S+A$
$E=\sum\limits_{i=1}^{n}{{{e}_{i}}{{W}_{i}}};\text{ }S=\sum\limits_{i=1}^{n}{{{s}_{i}}{{W}_{i}}};\text{ }A=\sum\limits_{i=1}^{n}{{{a}_{i}}{{W}_{i}}}$
where V is the composite vulnerability index; E is the exposure dimension; S is the sensitivity dimension; A is the adaptability dimension; n is the number of indicators; Wi is the weight of the corresponding indicator; ei is the standardized value of an exposure indicator; si is the standardized value of a sensitivity indicator; and ai is the standardized value of an adaptability indicator.

2.3.4 Spatial autocorrelation

The global autocorrelation model was used to analyze the overall spatial distribution of the vulnerability of the 23020 rural settlements in the study area and identify any spatial aggregation. Moran’s I is a commonly used test statistic for this purpose (Yang et al., 2019b; Cai et al., 2021):
$\operatorname{Moran}'s\text{ }I=\frac{n\sum\limits_{i=1}^{n}{\sum\limits_{j=1}^{n}{{{W}_{i}}}}\left( {{x}_{i}}-\bar{x} \right)\left( {{x}_{j}}-\bar{x} \right)}{\left( \sum\limits_{i=1}^{n}{\sum\limits_{j=1}^{n}{{{W}_{ij}}}} \right)\sum\limits_{i=1}^{n}{{{\left( {{x}_{i}}-\bar{x} \right)}^{2}}}},\text{ }\left( i\ne j \right)$
where Moran’s I has a value between −1 and 1. A value greater than 0 indicates a positive correlation, a value less than 0 indicates a negative correlation, and a value equal to 0 indicates no correlation. xi and xj are the vulnerability indices of spatial objects i and j, respectively. Wij is the spatial weight defined by using the adjacency criterion (i.e., when i and j are adjacent, Wij = 1; otherwise, Wij = 0. n is the number of spatial objects.
Bivariate spatial autocorrelation (Anselin and Kelejian, 1997) was used to analyze the spatial correlations among the exposure, sensitivity, and adaptability dimensions:
$\operatorname{Moran}'s\text{ }I_{zy}^{i}=\frac{X_{y}^{i}-{{{\bar{X}}}_{y}}}{{{\partial }_{y}}}\times \sum\limits_{c=1}^{n}{{{W}_{ij}}}\times \frac{X_{z}^{j}-{{{\bar{X}}}_{z}}}{{{\partial }_{z}}}$
where $I_{zy}^{i}$ denote the bivariate local Moran’s indices for attributes z and y in spatial object i; $X_{y}^{i}$ is the attribute y value of spatial object i, and $X_{z}^{j}$ is the attribute z value of spatial object j. ${{\bar{X}}_{y}}$, ${{\bar{X}}_{z}}$are the means of attributes y and z, respectively. ${{\partial }_{y}}$, ${{\partial }_{z}}$are the variances of attributes y and z, respectively. n is the number of spatial objects; y is the exposure or sensitivity dimension; and z is the sensitivity or adaptability dimension.

2.3.5 GeoDetector

GeoDetector is a statistical model proposed by Wang et al. (2017) to study the spatial differences of geographic phenomena and their influencing factors. The model has four main components: factor detection, interaction detection, risk detection, and ecological detection. In this study, factor detection and interaction detection were used to identify the main influencing factors and their interactions for the vulnerability of rural settlements in Qixingguan District.
Factor detection evaluates the extent to which an influencing factor explains the vulnerability of a rural settlement as measured by the q value:
$q=1-\frac{\sum\limits_{h=1}^{L}{{{N}_{h}}\sigma _{h}^{2}}}{N{{\sigma }^{2}}}$
where N is the vulnerability of a rural settlement and σ is the variance of the rural settlement vulnerability. The study area was divided into L layers denoted by h = 1, 2, $\cdots $, L. Nh and $\sigma _{h}^{2}$ are the vulnerability and variance, respectively, of rural settlements in layer h. q is the explanatory power of the influencing factor on the vulnerability of rural settlements with a value between 0 and 1. A q value closer to 1 indicates stronger explanatory power and a q value closer to 0 indicates weaker explanatory power.
Interaction detection evaluates the interactions between influencing factors: whether two influencing factors X1 and X2 act together to explain the vulnerability or whether their effects are independent of each other. Table 2 lists the types of interaction.
Table 2 Types of interaction detected
Type Formula
Enhance Nonlinear q(X1X2) > q(X1) + q(X2)
Bilinear q(X1X2) > q(X1) and q(X2)
Ordinary q(X1X2) > q(X1) or q(X2)
Weaken Nonlinear q(X1X2) < q(X1) and q(X2)
Bilinear q(X1X2) < q(X1) or q(X2)
Ordinary q(X1X2) < q(X1) + q(X2)
Mutual independence Ordinary q(X1X2) = q(X1) + q(X2)

3 Results

3.1 Spatial distribution of rural settlements

The spatial distribution of rural settlements in the study area was evaluated in terms of kernel density and area scale to identify any correlations between the clustering characteristics and degree of vulnerability. Figure 3(a) shows the spatial distribution of the number of rural settlements. Multiple local maxima were identified in the west, center, and northeast of the study area, which corresponded to towns, riverbanks, and the sides of roads. The high-density area in the west surrounded by a low-density area corresponds to Nojiao at the core. There is an obvious spatial distribution of high-density areas from the center to the northeast. The high-density area in the north roughly corresponds to an axial pattern along Linkou, Qingshuipu, Xiaojichang, and Tiankan, which are all along rivers and roads. Figure 3(b) illustrates the contiguity and scale of the rural settlements. The northeastern part of the study area is characterized by a fragmented and sparse distribution of settlements. However, it has a gentle topography and good water and transport conditions, which indicate some potential for remediation. The central urban area has a multicore aggregation pattern, and it is characterized by contiguous clusters. The western area at the junction of Salaxi and Yejiao has lower values than the surrounding area. The high-value area is centered on two agglomerations at Dahe and Yangjiawan around the low-value area. To summarize, the distribution of the number of rural settlements generally has a positive correlation with the area of the rural settlements in the western and central regions, with patches of high-density and large-scale settlements or low-density and small-scale settlements. The northeast shows a negative correlation between the number and area of rural settlements with patches of high-density and small-scale settlements. The geographic environment and other aspects have resulted in a relatively fragmented layout of rural settlements in the study area with a low degree of land use intensity and a multicore and uneven distribution pattern.
Fig. 3 Kernel density of rural settlements in Qixingguan District (a) number and (b) area of rural settlements

3.2 Spatial distribution of vulnerability

The natural breaks classification method was used to classify the vulnerability, exposure, sensitivity, and adaptability of the rural settlements into five levels: lowest, low, moderate, high, and highest. Figure 4 shows the resulting spatial distributions.
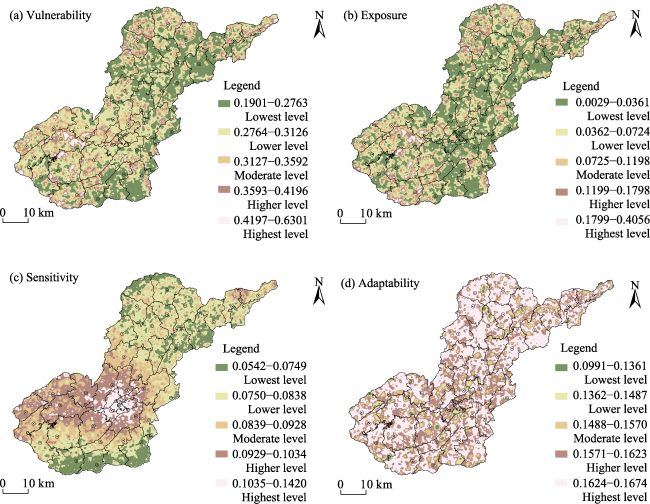
Fig. 4 Spatial distribution of vulnerability levels of rural settlements in Qixingguan District. (a) vulnerability, (b) exposure, (c) sensitivity, and (d) adaptability
The exposure demonstrated a strong spatial correlation with the vulnerability. The rural settlements in the study area generally had low to moderate levels of exposure: 46.10% at the lowest level, 28.48% at the low level, 15.09% at the moderate level, 7.63% at the high level, and 2.70% at the highest level. The settlements with the highest exposure were primarily in the west at the junction of Yejiao and Shuiqing and in the axial band in the north. These regions have a typical karst landscape. The high spatial correlation between the exposure and vulnerability can be attributed to severe stone desertification, soil erosion, and poor precipitation, which result in poorer water-heat matching conditions and greater external disturbances than in other regions.
The sensitivity showed a one-pole and multicore spatial distribution: 17.02% at the lowest level, 31.98% at the low level, 24.59% at the moderate level, 20.02% at the high level, and 6.39% at the highest level. The pole was in the center of the study area comprising West City Street, East City Street, and Liu Cang Street, and the sensitivity decreased in a circle outwards. There were multiple smaller cores scattered within the central and western regions and at the junction of Datun and Tiankan in the northeast. These results indicate that the rural settlements in the center of the study area were more sensitive to changes because of external disturbances such as poor precipitation and vegetation cover, and the western settlements were sensitive to the undulating terrain and poor agricultural conditions.
The study area generally demonstrated high levels of adaptability with a relatively balanced spatial distribution: 56.16% at the highest level, 29.02% at the high level, 9.84% at the moderate level, 3.66% at the low level, and 1.33% at the lowest level. There was a scattered distribution of rural settlements with low levels of adaptability (4.99%). In particular, rural settlements with high vulnerability and low adaptability were mostly in regions with poor transportation, poor natural conditions, and infrastructure in need of improvement that are slow to receive resources and policies from urban areas.
The vulnerability of the rural settlements demonstrated significant spatial heterogeneity, and the vulnerability levels were not evenly distributed. Most rural settlements were concentrated toward the lower levels of vulnerability: 35.42% at the lowest level, 34.88% at the low level, 17.65% at the moderate level, 3.33% at the high level, and 8.72% at the highest level. Rural settlements exhibiting heightened vulnerability levels were predominantly situated in the western region, with the junction of Yejiao and Shuiqing, serving as the central core and scattered smaller cores. Mountainous terrain, extensive karst landscapes, and challenging natural conditions characterize this region. Substantial exposure to adverse factors has increased severe rock desertification and soil erosion, resulting in diminished land-carrying capacity and soil stripping damage due to increased natural disasters. These challenges considerably jeopardize the ecological, economic, and social development of rural settlements, thus explaining the pronounced vulnerability of this area. Additional vulnerable settlements generally followed an axial pattern extending from the central to the northern part of the study area, encompassing locations, such as Tianbaqiao, Linkou, Qingshuipu, Puyi, and Tankan. These regions’ high altitudes, steep slopes, and undulating terrain contribute to increased construction, production, and daily living expenses. Furthermore, due to uneven water distribution and poor soil quality, rural settlements in mountainous areas exhibit heightened sensitivity to external disturbances, including rock desertification and soil erosion. This elevated sensitivity results in increased vulnerability. Conversely, the central region predominantly displayed moderate to lower vulnerability levels with sporadic vulnerable settlements. This phenomenon can be primarily attributed to human-induced development and construction activities. These areas are situated near towns and represent urban-rural zones where external disruptions have a reduced impact on vulnerability. However, inadequate agricultural conditions, limited precipitation, and sparse vegetation cover negatively influence the stability of rural settlement systems, thereby becoming the primary factors contributing to regional vulnerability.
In summary, most rural settlements in the study area had high levels of adaptability. The central region had low exposure and high sensitivity. The northeastern region had high exposure and low sensitivity. The western region had high exposure and sensitivity and thus was more vulnerable than the other regions.

3.3 Spatial autocorrelation analysis

As shown in Fig. 5, Moran’s I index was used for global autocorrelation analysis of the vulnerability of the rural settlements in the study area. Moran’s I index of vulnerability was 0.324 with a P-value of 0.001 (0.01 level of significance), and a Z-value of 82.942. This indicates a significant positive spatial correlation among vulnerable rural settlements; in other words, settlements with high vulnerability tend to be clustered with other vulnerable settlements, while less vulnerable settlements are clustered with other less vulnerable settlements.
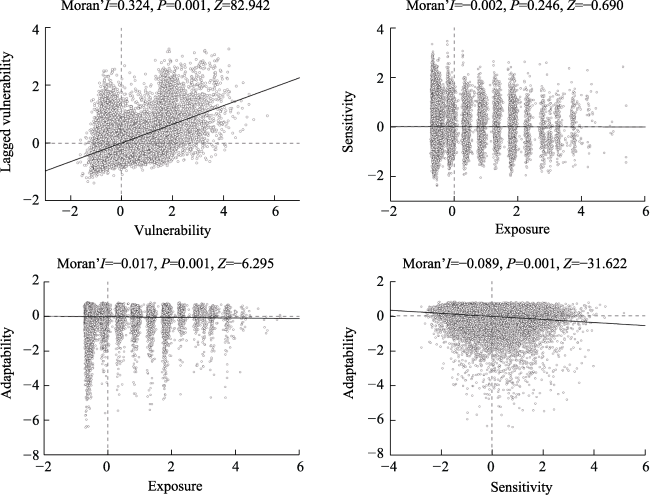
Fig. 5 Spatial relationship between the vulnerability and different dimensions (exposure, sensitivity, and adaptability) of rural settlements in Qixingguan District
Bivariate spatial autocorrelation was used to analyze the spatial correlations among the three dimensions of vulnerability. As shown in Fig. 5, the exposure and sensitivity had a Moran’s I index of −0.002, P-value of 0.246, and Z-value of −0.690, which indicates a weak but not statistically significant correlation. The exposure and adaptability had a Moran’s I index of −0.017, P-value of 0.001 (0.01 level of significance), and a Z-value of −6.295, which indicates a significant but weak negative correlation. In other words, settlements with high exposure and low adaptability or low exposure and high adaptability tended to be clustered together. The sensitivity and adaptability had a Moran’s I index of −0.089, P-value of 0.001 (0.01 level of significance), and Z-value of −31.622, which indicates a significant but weak negative correlation. In other words, settlements with high sensitivity and low adaptability or low sensitivity and high adaptability tended to be clustered together. In summary, the rural settlements in the study area with high exposure and sensitivity tended to have low adaptability, which increased their vulnerability.

3.4 Influencing factors of vulnerability

GeoDetector was used to measure the contributions of the influencing factors and their interactions with the vulnerability and component dimensions of rural settlements in the study area. The vulnerability was set as the dependent variable, and the 15 selected indicators were set as independent variables.

3.4.1 Detection of influencing factors

Table 3 presents the explanatory power of each indicator for the vulnerability of rural settlements in the study area. Most indicators had an explanatory power of 0.1000 or less with only two having an explanatory power greater than 0.3000, which indicates that all of the selected indicators influenced the vulnerability. The indicators had different q-values with the largest value of 0.5189 and the smallest value of 0.0003, which indicates that they played different roles in the vulnerability of rural settlements. Stone desertification had a strong positive correlation with the vulnerability of rural settlements, which can be attributed not only to the unique geological environment of karst mountains but also to the long-term destruction of nature by human activity and the clearing of large areas of steep slopes. Such activities have reduced the carrying capacity of the land and intensified natural disasters, which have threatened the ecological, economic, and social development of rural settlements and increased their vulnerability. Soil erosion reduces the stability of the ground surface and is an external force that directly affects rural settlements. The most visible effect on the study area was the reduction of arable land, which is detrimental to the growth of vegetation and crops and increases the vulnerability. Stone desertification intensity and soil erosion intensity are dominant influencing factors, and the vicious cycle of mountain poverty, water depletion, forest decline, and soil poverty increases the vulnerability of rural settlements. Thus, exposure is a fundamental influencing factor of vulnerability in the study area, where natural and anthropogenic disturbances interact with the high sensitivity and low adaptability of rural settlements in the karst mountains. Among the non-dominant factors, the slope, average rainfall and average sunshine hours were reported to significantly influence the spatial variation of the vulnerability of rural settlements in the study area. The slope has a strong influence on land use, and poor topography leads to higher costs of construction, production, and living. These effects increase natural hazards and the sensitivity of the rural settlements. The direct influence of climatic factors such as precipitation and sunshine on the vulnerability of rural settlements is not obvious. However, they indirectly influence the sensitivity of rural settlements owing to their impact on agricultural production and the livelihood of the population. The high sensitivity of rural settlements in mountainous areas can be attributed to the uneven distribution of water point accessibility. The rugged terrain and poor soil make them more vulnerable to external disturbances such as stone desertification and soil erosion. Among the selected indicators, only the distance to the nearest road did not pass the significance test. The area of cultivated land within 1 km and the distance to the nearest road had the weakest explanatory power for the spatial distribution of vulnerability. This may be because China implemented village access projects to build a large number of rural roads in the 21st century. Moreover, the relocation of the poor to alleviate poverty has improved the living conditions of rural residents, and therefore most rural settlements are closer to the road. In summary, the vulnerability of rural settlements in the study area is predominantly determined by their exposure, where natural disturbances play a dominant role and human disturbances play a secondary role.
Table 3 Ranks of influencing factors
Influencing factors q value Rank Influencing factors q value Rank
Stone desertification intensity X1 0.5189 1 Terrain undulations X9 0.0135 6
Soil erosion intensity X2 0.3820 2 NDVI X10 0.0049 12
Address Disaster Index X3 0.0065 11 NPP X11 0.0042 13
Agricultural population X4 0.0111 7 Educational accessibility X12 0.0094 9
1 km arable land area X5 0.0024 14 Medical accessibility X13 0.0079 10
Average precipitation X6 0.0253 4 Water point accessibility X14 0.0095 8
Average sunshine hours X7 0.0220 5 Distance to nearest road X15 0.0003 15
Slope X8 0.0410 3

3.4.2 Interaction among influencing factors

The interaction probe module of GeoDetector was used to identify the explanatory power of combined influencing factors on the vulnerability of rural settlements. The results are shown in Fig. 6. Two types of interaction between the factors were observed: two-factor enhancement (40.00%) and nonlinear increase (60.00%). Both had explanatory powers greater than that of a single factor, which indicates that the spatial distribution of the vulnerability of rural settlements in the study area can be attributed to the synergistic effect of multiple factors. The distance to the nearest road interacted with other factors in a nonlinearly increasing manner, which suggests that, although it has weak explanatory power when acting alone, it synergizes with other factors to increase the vulnerability. The explanatory power of the distance to the nearest road exceeded 40.00% when interacting with both topographic relief and NPP, which is additional evidence that adaptability has a significant influence on vulnerability. The explanatory power of the geological hazard index significantly increased when interacting with the mean sunshine hours and NPP by 49.15% and 41.19%, respectively. This indicates a strong link between geological hazards such as debris flows and landslides, sunlight conditions, and NPP. This is because sunlight affects the accumulation of organic matter in plants and thus the texture of the soil, which in turn affects the carrying capacity of the environment. This in turn affects the vulnerability of rural settlements. The 1 km arable area and vegetation cover index had low explanatory power for the vulnerability of rural settlements when they acted alone, but the explanatory power increased by 43.96% when their interaction was considered. These factors lead to an intrinsic environmental sensitivity that significantly affects the vulnerability of a rural settlement. The strongest explanatory power after factor interaction remained the stone desertification intensity∩soil erosion intensity (q=0.8762), which indicates that the vulnerability of rural settlements is exacerbated by severe stone desertification and land degradation caused by soil erosion. The second-strongest explanatory power was the stone desertification intensity∩slope (q=0.5550), which can be attributed to the scarcity of arable land resources caused by the steep slopes of the karst mountains and the fragmentation of the terrain. The reclamation of sloping land by residents then combines with the already severe stone desertification to increase the vulnerability of rural settlements.
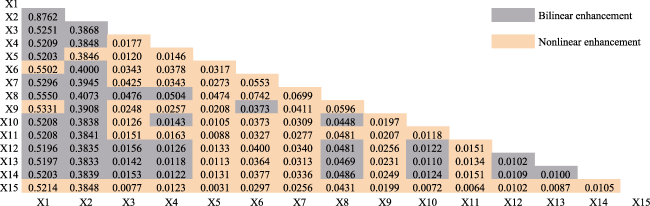
Fig. 6 Interactions among influencing factors
In general, the vulnerability of rural settlements in the study area can be evaluated as per their sensitivity and adaptability, with a certain multiplier effect between the two. The explanatory power of the influencing factors increases significantly when their interaction is considered, which indicates that the vulnerability of the rural settlements can be attributed to the interaction of natural, human, and social factors.

4 Discussion

This study focused on exploring and identifying the spatial distribution and influencing factors for the vulnerability of a patchwork of rural settlements in a study area covered by karst mountains. However, the scope was limited to the conceptual framework, methodology, and identification of influencing factors. The study did not consider the dynamic characteristics of vulnerability. Subsequent studies should explore the dynamic evolution process evaluation, monitoring and early warning mechanisms, and the typical evolution path of vulnerability of rural settlements in karst mountain areas. Quantifying threshold and boundary conditions for key influencing factors can be used to more accurately evaluate the vulnerability of rural settlements and promote the integrated management of karst landscapes for sustainable rural revitalization. In the context of being a typical fragile area, the karst mountainous region faces notable challenges concerning ecological damage and functional degradation. Additionally, the socioeconomic development of the countryside is lagging. Compared with the rural areas and other regions aiming to achieve modernizing agriculture, the conflict between resource exploitation and environmental protection appears to be more acute here. Rural settlements are complex human-terrestrial systems arising from the interplay of specific natural and human environments, and their vulnerability is characterized by a complex and variable range of influencing factors and interactions. To address the need to explore sustainable development trajectories in the impoverished karst mountainous regions within rural revitalization, we focus on the precise exploration and identification of vulnerability within rural settlements in these areas based on a patch-scale approach. This approach allows spatially differentiated comparisons of rural settlement vulnerability, thereby facilitating more targeted implementation of “vulnerability reduction” measures to enhance system resilience than that in the broader administrative regional scales. Differences in analysis methods, study types, and selected indicators can lead to significant differences in results. Obtaining vector data for rural settlements at the patch scale is difficult, which introduces a certain level of errors.
Future research will require considering the geographic heterogeneity and uniqueness of rural karst mountain settlements in different regions for the selected indicators. A systematic and standardized system for evaluating the vulnerability of rural settlements will provide theoretical and practical support for the implementation of sustainable development by relevant national authorities. Moreover, future research should analyze the coupling and mutual feedback mechanisms among the vulnerability, resilience, and sustainability of rural settlements in the karst mountains to meet sustainable development goals at the regional and national scales.

5 Conclusions

The following conclusions were obtained:
(1) The rural settlements in the study area demonstrated a multicore distribution pattern with low density and large scales in the center and low densities and scales in the northeast. Although the spatial distribution was highly heterogeneous, there was some degree of spatial agglomeration. The distributions of the density and area of the settlements demonstrated a rough positive spatial correlation. The spatial distribution of the rural settlements demonstrated some correlation to their vulnerability.
(2) The rural settlements in the study area generally had moderately low vulnerability but with significant spatial heterogeneity. Rural settlements with high vulnerability had a multicore distribution pattern. Most rural settlements had high adaptability. Settlements in the central region had low exposure and high sensitivity. Settlements in the northeastern region had high exposure and low sensitivity systems. Settlements in the western region had high exposure and sensitivity, and they were more vulnerable than settlements in other regions.
(3) The rural settlements demonstrated a significant positive spatial correlation in terms of vulnerability. Weak negative correlations were obtained between the exposure and adaptability and between the sensitivity and adaptability. The vulnerability of the rural settlements is based on their exposure and is intrinsically affected by their sensitivity and extrinsically affected by their adaptability. The stone desertification intensity and soil erosion intensity were identified as the main influencing factors for vulnerability. The explanatory power of the influencing factors was significantly enhanced when their interaction was considered.
[1]
Anselin L, Kelejian H. 1997. Testing for spatial error autocorrelation in the presence of endogenous regressors. International Regional Science Review, 20(1/2): 153-182.

[2]
Buchman N, Canadell J, Graumlich L. 2005. Global land project:Science plan and implementation strategy. Stockholm, Sweden: IGBP Report.

[3]
Cai X, Li Z, Zhang H, et al. 2021. Vulnerability of glacier change in Chinese Tianshan Mountains. Acta Geographica Sinica, 76(9): 2253-2268. (in Chinese)

DOI

[4]
Fang C L, Wang Y. 2015. A comprehensive assessment of urban vulnerability and its spatial differentiation in China. Acta Geographica Sinica, 70(2): 234-247. (in Chinese)

DOI

[5]
Guo B, Jiang L, Luo W, et al. 2017. Study of an evaluation method of ecosystem vulnerability bases on remote sensing in a southwestern karst mountain area under extreme climatic conditions. Acta Ecologica Sinica, 37(21): 7219-7231. (in Chinese)

[6]
He X, Peng K. 2021. Evaluation of urban tourism vulnerability in Hunan Province from the perspective of ecological niche theory. Economic Geography, 41(4): 174-182. (in Chinese)

[7]
He Y, Huang X, Zhai L, et al. 2016. Assessment and influencing factors of social vulnerability to rapid urbanization in urban fringe: A case study of Xi’an. Acta Geographica Sinica, 71(8): 1315-1328.. (in Chinese)

[8]
Hou W, Gao J, Peng T, et al. 2016. Review of ecosystem vulnerability studies in the Karst region of Southwest China based on a structure-function-habitat framework. Progress in Geography, 35(3): 320-330. (in Chinese)

DOI

[9]
Huang X, Wang C, Hu K. 2018. Multi-scale assessment of social vulnerability to rapid urban expansion in urban fringe: A case study of Xi’an. Acta Geographica Sinica, 73(6): 1002-1017. (in Chinese)

[10]
IPCC. 2007. Climate change 2001:Impacts, adaptation and vulnerability. Cambridge, UK and New York, USA: Cambridge University Press.

[11]
Kong X, Wang J, Jin Z, et al. 2019. Transformation and innovative thinking of rural land improvement for rural revitalization. China Land Science, 33(5): 95-102. (in Chinese)

[12]
Leiter T. 2022. Adaptation monitoring, evaluation & learning. In: IPCC. Climate change 2022: Impacts, adaptation and vulnerability. Cambridge, UK and New York, USA: Cambridge University Press.

[13]
Li B, Su F, Yang Z, et al. 2018. Vulnerability-based analysis of the spatial-temporal dynamic patterns of the human-sea territorial system of the Bohai-Rim region, China. Acta Ecologica Sinica, 38(4): 1436-1445. (in Chinese)

[14]
Li P, Fan J. 2014. Regional ecological vulnerability assessment based on VSD model: A case study of Xijiang River Economic Belt in Guangxi. Journal of Natural Resources, 29(5): 779-788. (in Chinese)

[15]
Li Y, Xie D, Wei C, et al. 2002. The fragility of eco-environment in southwest China Karst mountain. Carsologica Sinica, (1): 27-31.. (in Chinese)

[16]
Liu B, Zhou G, He Y, et al. 2021. Research progress and prospect of rural community sustainability. Human Geography, 36(1): 11-20. (in Chinese)

[17]
Liu Y, Wang S, Wang X, et al. 2020. Flood risk assessment in Bangladesh, India and Myanmar based on the AHP weight method and entropy weight method. Geographical Research, 39(8): 1892-1906. (in Chinese)

DOI

[18]
Liu Y, Yan B, Wang Y. 2016. Urban-rural development problems and transformation countermeasures in the new period in China. Economic Geography, 36(7): 1-8. (in Chinese)

[19]
Liu Y S, Li Y H. 2017. Revitalize the world’s countryside. Nature, 548(7667): 275-277.

[20]
Maikhuri R, Nautiyal A, Jha N K. 2017. Socio-ecological vulnerability: Assessment and coping strategy to environmental disaster in Kedarnath Valley, Uttarakhand, Indian Himalayan Region. International Journal of Disaster Risk Reduction, 25(6): 111-124.

[21]
Metzger M J, Rounsevell M, Acosta L. 2006. The vulnerability of ecosystem services to land use change. Agriculture, Ecosystems and Environment, 114(1): 69-85.

[22]
Polsky C, Neff R, Yarnal B. 2007. Building comparable global change vulnerability assessments: The vulnerability scoping diagram. Global Environmental Change, 17(3): 472-485.

[23]
Qu Y, Wei S, Shang R, et al. 2019. Spatial morphology of rural settlements based on site and functional characteristics. Resources Science, 41(6): 1035-1047. (in Chinese)

DOI

[24]
Sun J, Kong X, Tian Y. et al. 2017. Identifying reconstruction directions of rural settlements based on analysis of spatial combination features. Scientia Geographica Sinica, 37(5): 748-755.. (in Chinese)

DOI

[25]
Wang C, He Y. 2020. Spatio-temporal differentiation and differentiated regulation of the vulnerability of rural production space system in Chongqing. Acta Geographica Sinica, 75(8): 1680-1698. (in Chinese)

DOI

[26]
Wang J F, Xu C D. 2017. Geodetector: Principle and prospective. Acta Geographica Sinica, 72(1): 116-134. (in Chinese)

DOI

[27]
Wang Q, Lu L, Yang X. 2015. Study on measurement and impact mechanism of socio-ecological system resilience in Qiandao Lake. Acta Geographica Sinica, 70(5): 779-795. (in Chinese)

DOI

[28]
Wang Y, Song S, Wang J, et al. 2023. Vulnerability evolution of the ecological-economic-social complex system and the key influencing factors in the sandy region of Inner Mongolia from 2000 to 2018. Acta Ecologica Sinica, 43(6): 2271-2286. (in Chinese)

[29]
Yang D, Sun J, Zhang Y, et al. 2021. Classification of consolidation type of rural settlements in karst mountainous areas based on “production-living-ecological” functions: Taking Qixingguan District as an example. China Land Science, 35(11): 80-89. (in Chinese)

[30]
Yang F, Ma C, Fang H. 2019a. Research progress on vulnerability: From theoretical research to comprehensive practice. Acta Ecologica Sinica, 39(2): 441-453.. (in Chinese)

[31]
Yang H, Yang C, Xin G, et al. 2020. Multifunctional evaluation and optimization strategies for rural settlements in the hilly areas of southwest China—Taking Chongqing Rongchang District as an example. Chinese Journal of Agricultural Resources and Regional Planning, 41(2): 153-161. (in Chinese)

[32]
Yang Q, Liu Q, Yin S, et al. 2019b. Vulnerability and influencing factors of rural transportation environment in Qinling-Daba mountainous areas: A case study of Luonan County in Shaanxi Province. Acta Geographica Sinica, 74(6): 1236-1251. (in Chinese)

[33]
Yang R. 2019. Spatial differentiation and mechanisms of typical rural areas in the suburbs of a metropolis: A case study of Beicun Village, Baiyun District, Guangzhou. Acta Geographica Sinica, 74(8): 1622-1636. (in Chinese)

DOI

[34]
Yang R, Liu Y, Long H, et al. 2015. Spatial-temporal characteristics of rural residential land use change and spatial directivity identification based on grid in the Bohai Rim in China. Geographical Research, 34(6): 1077-1087.. (in Chinese)

DOI

[35]
Zhang X, Wang L, Fu X. 2017. Ecological vulnerability assessment based on PSSR in Yellow River Delta. Journal of Cleaner Production, 167(8): 1106-1111.

[36]
Zhou S, Zhang M, Wang S. et al. 2018. Assessment of vulnerability in natural-social system in Hexi, Gansu. Resources Science, 40(2): 452-462. (in Chinese)

DOI

Outlines

/