
Journal of Resources and Ecology >
Evaluation of the Development Resilience of Tourist Attractions under the Influence of Major Public Health Events
|
WANG Lu, E-mail: wanglu@bisu.edu.cn |
Received date: 2023-08-29
Accepted date: 2023-12-04
Online published: 2024-05-24
Supported by
The General Project of Scientific Research Program of Beijing Municipal Education Commission(SM202110031002)
The Youth Academic Talents Project of Beijing International Studies University(21110010005)
Achieving resilient development is an important way for tourist attractions to cope with the negative impacts of major public health events, and an accurate assessment of the existing resilience level is the basis for improving the resilience of tourist attractions. Based on resilience theory, the impacts of major public health events on tourist attractions and the relationship between the impacts and the development resilience of the tourist attractions, this study uses the composite index method and DEMATEL method to construct an index system for evaluating the development resilience of tourist attractions. This evaluation index includes 20 indicators in the four dimensions of prevention ability, resistance ability, recovery ability and renewal ability, and the weight of each indicator was determined. The results show three important aspects of tourist attraction resilience. (1) Resistance ability is the most important dimension that reflects the resilience level of tourist attractions, followed by renewal ability and recovery ability, while prevention ability is relatively less important. (2) Tourism revenue reconstruction, mechanism innovation, marketing flexibility and financing ability have large positive correlations with the resilience level of tourist attractions. (3) Market flexibility, management decision-making level, financing ability and intelligent construction level are susceptible to other indicators, so that more attention should be paid to them in the process of improving the resilience level of tourist attractions. The index system developed in this study can provide scientifically valid guidance and a useful reference for tourist attractions to accurately examine their own issues and improve their development resilience.
WANG Lu , HUANG Ziruo , YU Le , NING Zhizhong . Evaluation of the Development Resilience of Tourist Attractions under the Influence of Major Public Health Events[J]. Journal of Resources and Ecology, 2024 , 15(3) : 698 -710 . DOI: 10.5814/j.issn.1674-764x.2024.03.016
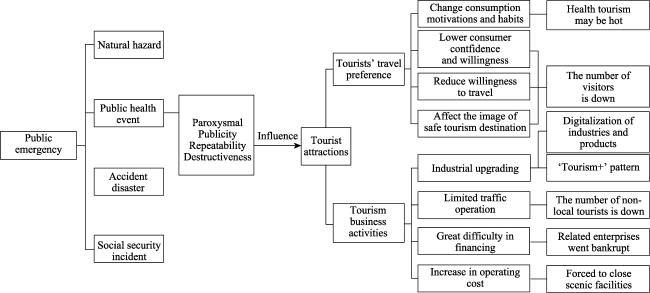
Fig. 1 Schematic diagram of the impacts of major public health events on the development of tourist attractions |
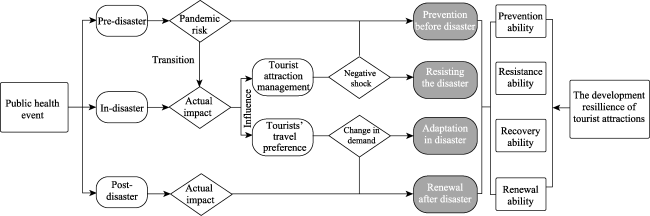
Fig. 2 Logical framework diagram of the corresponding relationship between the development resilience of tourist attractions under the background of major public health event impacts |
Table 1 Resilience development index system and description of tourist attractions |
| Dimension | Influencing factor | Explanation of influencing factors | Guideline suggested |
|---|---|---|---|
| Prevention ability (A) | Risk test power (a1) | The scientific identification of the types of risks and the hazards that tourist attractions may face, and the measures to carry out risk hazard testing | Professional risk assessment report; number of risk hazard tests |
| Risk control ability (a2) | The ability of tourist attractions to formulate risk management and control plans based on risk discrimination, and to carry out pre-warning and emergency drills | Risk control plan; number of pre-plan exercises | |
| Emergency reserve level (a3) | The relative level between the scale of the emergency reserve prepared by tourist attractions and the necessary expenditure of tourist attractions to cope with the expected loss of risk and maintain operation during the disaster period | The size of the emergency reserve; the proportion of emergency reserve to operating income | |
| Resistance ability (B) | Emergency response ability (b1) | The actual response ability of tourist attractions’ monitoring and early warning, personnel allocation, material allocation, and fund allocation during the pandemic | Emergency response index (measured by the scale and speed (time) of personnel, materials and capital allocation) |
| Quality of tourist attractions (b2) | The ornamental and recreational value, historical and cultural scientific value, rare or peculiar degree, scale and abundance and integrity of tourist attractions | Core resource level; quality grade of tourist attractions | |
| Scale of local tourist market (b3) | The relatively stable scale of local consumer groups of tourist attractions during the non-pandemic period | Number of permanent residents in the prefecture-level city in the past year | |
| Local market consumption level (b4) | The expenditure level of local tourist tourism and cultural leisure consumption during the non-pandemic period | The disposable income of residents in the prefecture-level city in the last year | |
| Level of operating cost control (b5) | The ability to adjust the management and profit level of tourist attractions on the operation and management cost | Ratio of financial revenue to expenditure in the previous three years | |
| Ownership of management subject (b6) | The form of people’s possession of enterprise management power, management responsibility, management direction and process | Scenic ownership (state-owned, private, mixed) | |
| Diversification of revenue (b7) | The type of non-tour operating income of tourist attractions and its proportion in total income | The proportion of non-tour operating income in total operating income | |
| Recovery ability (C) | Durability of tourist facilities (c1) | The maintenance and renewal cycle of the main tourist facilities in tourist attractions | Facilities update and maintenance The proportion of annual expenditure in total expenditure |
| Visit openness (c2) | The open area the tourist attraction can afford, that can meet the control requirements of policy, safety and tourists’ needs | Type of resources; the proportion of indoor tour capacity in the maximum carrying capacity of tourists in the tourist attractions | |
| External traffic accessibility (c3) | The connection between tourist attractions and the main transportation hub of the city, and the diversity of the means of transportation to the tourist attractions; that is, the degree of traffic convenience for tourists to reach tourist attractions | The time required to reach the tourist attractions from the city center | |
| Level of management decision-making (c4) | The ability to adjust management decision-making after tourist attractions have changed from pandemic prevention and control to normal development | Management team structure; data-based decision-making level | |
| Marketing flexibility (c5) | The adaptation degree of marketing methods, marketing funds and marketing effects of tourist attractions in response to changes in market demand in the recovery stage | Comprehensive marketing index (calculated by the number of marketing activities, the scale and proportion of marketing expenditure) | |
| Renewal ability (D) | Tourism revenue reconstruction force (d1) | The ability of tourist attractions to expand operating income and improve profitability through product renewal and fixed asset investment | The scale of fixed asset investment; proportion of fixed asset investment |
| Financing ability (d2) | The financing credit level of tourist attractions in order to realize the transformation of products, facilities and management mode | Financing credit rating; financing credit line | |
| Talent reserve level (d3) | The ability of tourist attractions to absorb management, technology and service talents to adapt to product renewal and service transformation | Proportion of employees with college degree or above | |
| Intelligent construction level (d4) | The application degree of the Internet, big data and other emerging technologies in tourist attractions to reduce the cost of facilities maintenance and management services, and to improve tourist satisfaction | Website and Official Account construction level and content update speed (time); website and official account attention; the proportion of tourists who book online and enter the park; using new technology to manage the proportion of tourist attraction capacity, safety, facilities, environment and other projects | |
| Mechanism innovation (d5) | The innovation of the management system and operation mechanism of tourist attractions in order to adapt to the new situation and new needs after the pandemic | The proportion by which planning, market research and product R & D investment has increased |
Note: The explanations of each evaluation dimension and its influencing factors are discussed in sections 3.1 to 3.4. |
Table 2 Comprehensive relationships and weight table for each index of the development resilience of tourist attractions |
| Evaluation dimension | Dimension weight (W1) | Index | Influencing degree (f) | Influenced degree (e) | Centrality (m) | Severity degree (r) | Index weight (W2) |
|---|---|---|---|---|---|---|---|
| Prevention ability (A) | 0.135 | Risk test power (a1) | 3.29 | 3.53 | 6.82 | -0.24 | 0.043 |
| Risk management and control force (a2) | 3.70 | 4.35 | 8.06 | -0.65 | 0.050 | ||
| Emergency reserve level (a3) | 3.14 | 3.49 | 6.63 | -0.35 | 0.041 | ||
| Resistance ability (B) | 0.340 | Emergency response ability (b1) | 3.02 | 4.23 | 7.25 | -1.22 | 0.045 |
| Quality of tourist attractions (b2) | 3.95 | 3.15 | 7.10 | 0.80 | 0.044 | ||
| Local tourist market size (b3) | 4.19 | 3.67 | 7.85 | 0.52 | 0.049 | ||
| Local market consumption level (b4) | 4.27 | 3.23 | 7.50 | 1.04 | 0.047 | ||
| Level of operating cost control (b5) | 4.05 | 4.21 | 8.27 | -0.16 | 0.052 | ||
| Nature of ownership of management subject (b6) | 4.41 | 3.21 | 7.62 | 1.20 | 0.048 | ||
| Degree of revenue diversification (b7) | 4.26 | 4.44 | 8.70 | -0.17 | 0.054 | ||
| Recovery ability (C) | 0.240 | Durability of tourist facilities (c1) | 2.67 | 3.30 | 5.97 | -0.63 | 0.037 |
| Degree of openness of tours (c2) | 4.05 | 3.99 | 8.04 | 0.06 | 0.050 | ||
| External traffic accessibility (c3) | 3.47 | 3.18 | 6.66 | 0.29 | 0.042 | ||
| Management decision-making level (c4) | 4.26 | 4.61 | 8.86 | -0.35 | 0.055 | ||
| Marketing flexibility (c5) | 4.12 | 4.80 | 8.92 | -0.68 | 0.056 | ||
| Renewalability (D) | 0.285 | Tourism revenue reconstruction force (d1) | 4.99 | 4.97 | 9.96 | 0.03 | 0.062 |
| Financing ability (d2) | 4.40 | 4.48 | 8.88 | -0.08 | 0.056 | ||
| Talent reserve level (d3) | 4.35 | 4.11 | 8.46 | 0.25 | 0.053 | ||
| Level of intelligent construction (d4) | 4.40 | 4.42 | 8.82 | -0.02 | 0.055 | ||
| Mechanism innovation efforts (d5) | 4.91 | 4.55 | 9.46 | 0.36 | 0.059 |
| [1] |
|
| [2] |
|
| [3] |
|
| [4] |
|
| [5] |
|
| [6] |
|
| [7] |
|
| [8] |
|
| [9] |
|
| [10] |
|
| [11] |
|
| [12] |
|
| [13] |
|
| [14] |
|
| [15] |
|
| [16] |
|
| [17] |
|
| [18] |
|
| [19] |
|
| [20] |
|
| [21] |
|
| [22] |
|
| [23] |
|
| [24] |
|
| [25] |
|
| [26] |
|
| [27] |
|
| [28] |
|
| [29] |
|
| [30] |
|
| [31] |
|
| [32] |
|
| [33] |
|
| [34] |
|
| [35] |
|
| [36] |
|
/
| 〈 |
|
〉 |