Rural Tourism Destination and Homestay Development

Exploring Spatial Distribution and Influencing Factors of B&Bs in Beijing-Tianjin-Hebei in the Regional Integration Context based on Big Data

  • LI Yan , 1, * ,
  • DONG Danyang 2 ,
  • WANG Yining 2
Expand
  • 1. China Academy of Culture and Tourism, Beijing International Studies University, Beijing 100024, China
  • 2. School of Tourism Sciences, Beijing International Studies University, Beijing 100024, China
*LI Yan, E-mail:

Received date: 2023-08-31

  Accepted date: 2023-11-21

  Online published: 2024-05-24

Supported by

The Beijing Social Science Foundation(22GLB037)

Abstract

The integrated and synergistic development of the region of Beijing-Tianjin-Hebei (BTH) is a major national strategy for China to maintain complementary advantages and mutual benefits. The integrated development strategy offers opportunities and challenges for Bed and Breakfasts (B&Bs) in guest sharing, resource sharing, competition and cooperation, branding, and industrial upgrading. Therefore, optimizing resource allocation, enhancing user experience, and assisting in urban planning become particularly crucial for B&Bs development. Therefore, this study utilized the theoretical nearest neighbor distance and Kernel Density Estimation to explore the distribution of B&Bs in the BTH region, and utilized Latent Dirichlet Allocation (LDA) thematic model and regression analysis to analyze the influencing factors from both government and market perspectives and the extent of their influence. The results indicated that significant aggregation characteristics and spatial variability exists in the factors influencing the distribution of B&Bs. All nine factors analyzed based on LDA exerted a significant effect on the distribution of B&Bs, of which the significance of ice and snow activities was at a critical value, mainly because they were limited by specific geographic requirements. Therefore we proposed the following: B&Bs should develop boutique rural B&Bs and community B&Bs around local cultural and tourism characteristics and realize the differentiated and innovative development of the shared B&B industry.

Cite this article

LI Yan , DONG Danyang , WANG Yining . Exploring Spatial Distribution and Influencing Factors of B&Bs in Beijing-Tianjin-Hebei in the Regional Integration Context based on Big Data[J]. Journal of Resources and Ecology, 2024 , 15(3) : 626 -638 . DOI: 10.5814/j.issn.1674-764x.2024.03.010

1 Introduction

Regional integrated and synergistic development is an effective method of achieving sustainable regional development and effectively enhancing individual’s well-being (Van Berkel et al., 2016; De Neve and Sachs, 2020), and urban agglomerations are crucial spatial carriers for performing national economic and social strategies (Lin et al., 2019). Since 2014, China has proposed the Beijing-Tianjin-Hebei integration strategy to explore a new model and pattern of innovative development of city clusters. The Action Plan for the Collaborative Development of Culture and Tourism in Beijing-Tianjin-Hebei from 2022 to 2025 explicitly promotes the integrated and rapid development of culture and tourism industries in the region of Beijing-Tianjin-Hebei (BTH), which collaborate in four major areas: transportation integration, ecological and environmental protection, industrial synergy, and public service. Thus, they enhance effectively the integration level of urban clusters, and achieve complementary advantages, mutual benefit, and shared creation of these three places. With strategic location, unique factor endowment, and resource concentration advantages, BTH city cluster has become a crucial engine of economic growth in northern China, as well as the core area of the Northeast Asian economic circle over the past nine years. The integrated development also exerts a significant role in promoting the integration of culture and tourism industries, the complementary advantages of culture and tourism resources in the BTH region. In the novel pattern of globalization and ‘dual circulation’, the degree of synergistic development in the BTH has led to higher requirements and optimizations for the B&Bs’ geographical distribution.
With the transformation and upgrading of economic development, the tourism accommodation industry is also pioneering innovations to comply with the contemporary development process with the rapid development of the sharing economy, rural revitalization, and ice sports. The emergence of shared B&Bs (i.e., shared bed and breakfast) has exerted a significant impact on the dominant logic of the market (Zervas et al., 2017), and their distinctive experiences and humanistic care are exceedingly attractive to consumers. They have also received significant attention from the government for their effectiveness in revitalizing idle residential resources, boosting agricultural and rural economic development, and facilitating rural revitalization. Moreover, the government has launched a series of favorable policies to encourage the high-quality development of B&Bs. In the BTH region, the booming B&Bs economy and the growing number of B&Bs can effectively relieve the pressure on tourism accommodation in large medium-sized cities, promote the circulation of production factors, optimize the allocation and utilization of regional resources, and enhance the integrated construction of public service facilities. Besides rational factors such as the market demand and the regional GDP, whether the special characterization of cultural and tourism resources in the BTH region and the regional integration also exert a crucial role in the development of B&Bs remains a critical research topic.
As a crucial component of the tourism and accommodation industry, the spatial distribution pattern of B&Bs a critical indicator affecting regional economic efficiency, and the rational layout of B&B can significantly increase local economic benefits, promote integrated regional development, and achieve win-win synergies across the region. In the context of BTH integrated development, city cluster planning exhibits a special policy, and the development of regional B&Bs industries are largely affected and guided by government policies. Moreover, in a market economy, the consumer demand and preference still exert a decisive role in the B&Bs resources allocation. Previously, B&Bs in urban agglomerations was subjected to uneven spatial geographic distribution and lack of planning in some domains. Uneven distribution of resources leads to an oversupply of B&Bs in some areas and an undersupply in others, whereas the lack of planning affects the aesthetics and order of the city. Based on the market requirements for B&Bs, how to comprehensively utilize the synergistic and integrated development trend of BTH to better promote the development of B&B is a worthwhile research question. Meanwhile, online activities generate immense data. In the B&Bs scenario, the online orders and related evaluation of tourists, and the policy documents of government departments published online contain a large amount of information. Mining and analyzing these big data can identify potential business problems and opportunities.
Therefore, this study utilized big data including governmental file, user-generated content, and the geographic data of B&Bs to intelligently explore the spatial distribution-related issues of B&Bs in BTH. Multi-source data (governmental file, user-generated content, and geographic data) are utilized to analyze characteristics and laws pertaining to the distribution of B&Bs in the Beijing-Tianjin-Hebei region, which provided different perspectives, such as the regulators perspective and the consumer perspective. Multi-source data can enable a wider range of information, complementing each other to increase the accuracy, reliability, and comprehensiveness of analysis results, which are detailed as follows: 1) The nearest neighbor index and kernel density analysis is utilized to analyze the special distribution characteristics of B&Bs in BTH based on geometric data; 2) Latent Dirichlet Allocation (LDA) thematic analysis is utilized to identify the influencing factors of B&Bs in BTH based on Destination Management Organization (DMO) and User generated Context (UGC) text; 3) Regression analysis is utilized to investigate the relationship between the B&Bs distribution and the influencing factors based on geometric data. For the aforementioned analyses, the development of B&Bs in BTH is proposed.

2 Literature review

2.1 Research on integrated regional development

Regional integration development is a method of overcoming barriers to factor circulation occasioned by market segmentation and to establish a unified, open, and innovative market (Moreau, 2001; Kong et al., 2022). Regional integration can influence urban innovation through factor reallocation effects, synergy effects, and agglomeration externalities (Qi et al., 2023). Most scholars have focused on the economic and social benefits that integrated development induced in the region, such as regional integration for economic efficiency growth (Long et al., 2019), talent mobility (Ji et al., 2013), knowledge technology innovation (Ruhrmann et al., 2022), innovation in tourism development (Souza et al., 2017), and regional sustainable development (Tan and Kong, 2020). The PRD region implements integrated development measures to achieve the tourism- economy-ecology linkage, thereby achieving high-quality development (Tang and Luo, 2022). B&Bs exert a role in blurring the traditional boundaries between residential and tourist areas in cities in integrated development regions (Roelofsen, 2018; Hoffman and Heisler, 2020) and in accelerating community change (Rabiei-Dastjerdi et al., 2022). In conclusion, by optimizing the geographical distribution of B&Bs in integrated city clusters, we can enhance the economic efficiency of B&Bs industries and cities, optimize the landscape, and strengthen the overall competitiveness of integrated regions.
In the existing studies, only several scholars have considered the spatial distribution of B&Bs in synergistic development regions (Tang et al., 2019). In fact, B&B distribution research exhibit a comprehensive perspective: spatial heterogeneity in different spatial units indicates a difference in economic level, technological innovation, and management efficiency. All these factors may impact the policies and implementation, and further enhance the urban agglomeration, which becomes more balanced, and more coordinated in the region’s cultural tourism and economic development.

2.2 Research on influencing factors of B&Bs distribution

The locational factors affecting the distribution of B&Bs are heterogeneous (Quattrone et al., 2018), consistent with the second law of geography, “spatial heterogeneity”, which states that the distribution of geographical objects is influenced by various factors. The distance of B&Bs from tourist attractions (Ioannides et al., 2019; Lee et al., 2020), distance from urban center (Rabiei-Dastjerdi et al., 2022; Shan et al., 2023), surrounding commercial facilities (Gutiérrez et al., 2017), transportation accessibility (Cheng and Jin, 2019; Hong and Yoo, 2020), demographic characteristics of residents (Jiang et al., 2022), urban universities (Ki and Lee, 2019), socio-economic levels (Adamiak, 2018), historical and cultural degrees (Sun et al., 2022), and natural conditions(① https://www.e3s-conferences.org/articles/e3sconf/abs/2021/27/e3sconf_ictees2021_03043/e3sconf_ictees2021_03043.html.) exert a role in the distribution of B&Bs in cities. The spatial distribution of Airbnb accommodation in Barcelona was influenced by household income, education level, and house size (Lagonigro et al., 2020). Furthermore, the number of B&Bs distributed in the Barcelona area was also negatively influenced by the distance from the city center and the amount of industrial activity, with urban population density being inversely related to the proportion of B&Bs (Gutiérrez et al., 2017). The number of regional B&Bs was negatively correlated with the average altitude in the Chongqing region due to the specificity of physical geography (Wang et al., 2022). The distribution of B&Bs in the Yangtze River Delta region was mainly influenced by economic factors and tourism market conditions (Long et al., 2019). In tourist cities, tourism-related factors exert a decisive role in the distribution of B&Bs (Adamiak et al., 2019).
Based on the previous research, the five major aspects influenced the distribution of B&Bs, including natural condition, economic condition, social condition, geographical location, and tourism resources. In regard to methodology, questionnaire research, the Delphi method, and literature combing are utilized to summarize the influencing factors. In the big data era, both governmental and user-generated content on internet or intranet, which reflect governmental orientation and user preferences, enables the application of the following approach: the utilization of an intelligent approach to solve this problem. In the context of BTH integrated development, identifying the factors influencing B&Bs can enable B&B developers and investors to grasp market opportunities and effect more informed decision-making behavior, while supporting governments to plan the layout and better meet market demand.

2.3 Spatial distribution characteristics

The research on the spatial distribution characteristics of B&Bs mainly combined multidisciplinary intersectional perspectives such as geography, economics, management, and spatial dimensions to analyze the spatial structure, morphological characteristics, and evolutionary trends of B&Bs. The nearest neighbor index method, kernel density analysis, Moran index, and geographic probes have been widely applied in analyzing the distribution types and patterns of spatial geographic coordinates (Ming, 2021; Shen and Shi, 2022; Wang et al., 2022; Xiao and An, 2022; Li et al., 2023). Currently, the spatial distribution patterns of geographical elements are mainly classified into four categories, namely free-scattering, point-axis ribbon, concentric-reflection, and single-core agglomeration (Long et al., 2019). The spatial distribution pattern of B&Bs is a crucial indicator affecting regional economic efficiency (Adamiak, 2022).
In regard to technologies for analyzing the distribution characteristic of B&Bs, ArcGIS spatial analysis method, spatial econometric model (La et al., 2021), and spatial regression (Anselin et al., 2010; Ma et al., 2021) are widely applied. Regulating the orderly development of the B&Bs market in urban agglomerations can contribute to the stability and sustainability of regional development and conversely reinforce the unequal pattern of spatial development (Rabiei-Dastjerdi et al., 2022), thereby negatively affecting integrated development. Scholars have immensely prioritized B&Bs; nevertheless, the literature exploring the spatial distribution patterns of B&Bs in Asia is relatively scarce, with a proportion below the average, namely 28% (Sainaghi & Baggio, 2020), and there are few studies on the development of B&Bs under integrated regions.

3 Methodology

This study utilized intelligent methods to explore the distribution characteristics of B&Bs in the Beijing-Tianjin-Hebei region and their influencing factors. In detail, 1) The nearest neighbor index and density analysis based on 1053 B&Bs geographic data is aimed at exploring the B&Bs distribution characteristics in the Beijing-Tianjin-Hebei region; 2) LDA analysis based on 530 DMO files, and 9494 UGC data is aimed at mining the relevant influencing factors; 3) Regression analysis pertaining to the distribution density of B&Bs and the influencing factors is utilized to mine the influence of these factors on the distribution of B&Bs. The intelligent framework on spatial destruction overall research framework is depicted in Fig. 1.
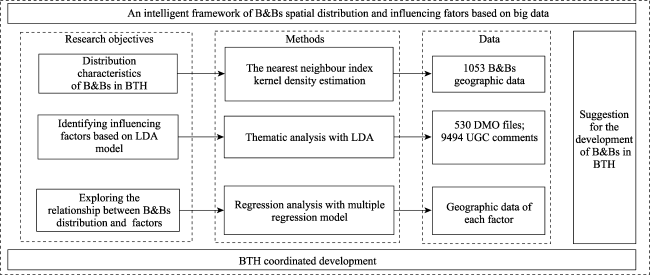
Fig. 1 The intelligent framework of B&Bs spatial distribution and influencing factors based on big data

3.1 Methods

3.1.1 The nearest neighbor index

To analyze the type of spatial distribution exhibited by B&Bs in BTH (whether it is random, dispersed, or clustered distribution), the nearest neighbor index is utilized to characterize the proximity of B&Bs in the BTH region. The nearest neighbor index RI is calculated as follows:
$RI=\frac{\overline{{{r}_{a}}}}{\overline{{{r}_{e}}}}=2\sqrt{D}\overline{{{r}_{a}}}$
where D is the point density, and $\overline{{{r}_{a}}}$ denotes the actual nearest neighbor distance between the point and its nearest neighbor element. The measurement tool HawthsTools in ArcGIS was utilized to measure the Euclidean distance between each point and its nearest neighbor, and the average value was taken as $\overline{{{r}_{a}}}$. The theoretical nearest neighbor distance $\overline{{{r}_{e}}}$ indicates the expected average distance, calculated as follows:
$\overline{{{r}_{e}}}=\frac{1}{2\sqrt{\frac{n}{A}}}=\frac{1}{2\sqrt{D}}$
where n represents the number of points; A represents the area of the region. RI<1 indicates an aggregated distribution of B&Bs, RI=1 indicates a random distribution, and RI>1 index indicates a uniform distribution.

3.1.2 Kernel density analysis

Kernel density analysis is utilized to explore the density of B&Bs in BTH. Kernel density analysis (Wang et al., 2022) is a commonly utilized method for distributional pattern analysis, which generates smooth continuous surfaces of points, identifies clustering areas of points, and analyses the continuous distribution characteristics of points at the spatial level. Kernel density is calculated using the following formula:
$f\left( x,y \right)=\frac{1}{n{{h}^{2}}}\underset{i=1}{\overset{n}{\mathop \sum }}\,k\left( \frac{{{d}_{i}}}{n} \right)$
where n denotes the number of geographic elements in the search range; h denotes the search radius of the geographic area; k denotes the prescribed kernel function, and the product kernel function is utilized herein. di denotes the distance of the point element (x, y) from the i-th observed position. The higher the kernel density value, the higher the degree of aggregation, and the denser distribution of geographic elements within the range. Conversely, the lower the kernel density value, the lower the degree of aggregation and the more discrete distribution of geographic elements.

3.1.3 LDA thematic analysis

Latent Dirichlet Allocation (LDA) thematic analysis was utilized to deeply explore and verify the special factors implied in DMO text and UGC comments; thus, the potential factors influencing the distribution of B&Bs was explored. The LDA model is a three-layer structure with documents, topics, and words. LDA text analysis is a text analysis technique that performs topic modeling on large-scale text data by unsupervised learning methods, thereby representing text data as a topic vector. In LDA topic analysis, text is considered as a bag-of-words model, where each document is represented as a word vector and each topic is represented as a set of word vectors.
To evaluate the effectiveness with which the LDA model predicts the sample, the degree of Perplexity(M) is utilized with the following formula:
$\text { Perplexity }(M)=\exp \left(-\frac{\sum_{n=1}^{K} \ln N(n)}{\sum_{i=1}^{N} N_{i}}\right)$
where M denotes the degree of perplexity; Ni denotes the number of words contained in the i-th topic; and there are N topics. N(n) denotes the probability of occurrence word n in the text, and K is the number of words. The degree of confusion can quantitatively evaluate the model’s performance. The lower its value, the better the model. Usually, as the number of topics increases, the topic perplexity indicates a decreasing trend in general, and the optimal number of topics can be determined based on the topic perplexity.

3.1.4 Correlation analysis

It is necessary to clarify whether these influential factors are relevant to the distribution. Therefore, correlation analysis is utilized to investigate whether there is a relationship between the data. Correlation analysis is commonly utilized before regression analysis; generally, there is a correlation before there is a regression influence relationship, and the most commonly utilized is the Pearson correlation coefficient, which is calculated as follows:
$r=\frac{cov\left( X,Y \right)}{{{\sigma }_{X}}{{\sigma }_{Y}}}=\frac{E\left( XY \right)-E\left( X \right)E\left( Y \right)}{\sqrt{E\left( {{X}^{2}} \right)-{{E}^{2}}\left( X \right)}\sqrt{E\left( {{Y}^{2}} \right)-{{E}^{2}}\left( Y \right)}}$
where cov denotes the covariance; σ denotes the standard deviation; X and Y denote random variables. Pearson correlation coefficient takes values between [-1, 1]: r>0 indicates a positive correlation between the two variables, whereas r<0 indicates a negative correlation between the two variables. When the Pearson correlation coefficient |r| is below 0.4, the correlation between variables is low; when |r| is between 0.4 and 0.7, the correlation between variables is medium; and when |r| is above 0.7, the correlation between variables is high.

3.1.5 Regression analysis

Regression analysis is a method utilized to analyze the statistical relationship between variables. According to the number of variables are generally divided into univariate and multiple regression analysis. To investigate the effect that the relationship of factors exerts on the distribution of B&Bs, multiple linear regression is utilized. Multiple linear regression utilizes a best-fit straight line to establish a relationship between the dependent variable (Y) and one or more independent variables (X). Multiple linear regression can be expressed as:
$Y=a+\sum_{i=1}^{n} b_{i} X_{i}+e$
where a denotes the intercept; bi denotes the slope of the line; e denotes the error term; and n denotes the number of factors, which Xi is i-th factor (i$\in $[1, n]). Based on the results of the correlation analysis, the relationship between X and Y was shown to be suitable for the next step of data analysis, which could be the further regression analysis of the causal relationship existing between the variables. This study utilizes linear regression in SPSS to test how the influencing factors affect the spatial distribution of B&Bs in BTH.

3.2 Data source and pre-processing

B&Bs, as geographical elements abstracted as points on a spatial map, can be analyzed for the distribution characteristics with geographical data, and for the influencing factor of distribution with text data of both governmental file and User-generated content.

3.2.1 Geographical data

To explore the distribution characteristics of B&Bs in the BTH region, the geographic data of B&Bs are collected from Ctrip (www.Ctrip.com). A total of 1053 B&Bs with qualified business qualifications in Beijing, Tianjin, and Hebei Province were selected.
To explore the relationship between the distribution and the influencing factors, data on the spatial geographic coordinates of each influencing factor indicator are obtained from different sources,including countryside (nrra.gov.cn), tourist attractions (mct.gov.cn), ice and snow activity sites, and sports venues (National Statistical Yearbook), air quality counts (aqistudy.cn), administrative areas, and road network density (resdc.cn). Baidu Maps are utilized to convert the coordinates, meanwhile missing and abnormal values were excluded.
After collecting all the address information, The Baidu map was utilized to convert the coordinates into geographic coordinate points, and the missing values and outliers were handled by performing operations such as manual identification, manual supplementation of coordinate information, or the elimination of the missing geographic data. All geographic data were restricted to the one year time frame of September 2021 to September 2022. The geographic data were divided into each district and county area unit under the geographic administrative division, and the distribution density of coordinate points was calculated and reserved for use in the analysis of impact factors. Subsequently, ArcGIS was utilized for preprocessing, including geometric correction, projection, coordinate conversion, and vectorization, and the B&Bs points were subsequently marked on the map to analyze the spatial distribution characteristics of B&Bs in the BTH area.

3.2.2 Text data

Since both government promotion and consumer orientation exert a crucial role in the distribution of B&Bs in BTH, these two types data are considered to explore the factors influencing the B&Bs distribution. We utilized DMO texts representing official policies issued by the government as DMO texts, including the 2018 Government official website (beijing.gov. cn) with news, articles, and government documents, 530 documents in total. The study utilized UGC data representing consumer orientation, including a total of 9494 reviews of 1053 fully qualified B&Bs in BTH regions obtained from Ctrip over the past three years.
Due to the collection of a large amount of data, it is not possible to identify and screen each comment specifically; the resulting text apparently exhibits some repetitions and deviation from the theme. To ensure that the results of the study are scientifically valid, it is necessary to screen the data to eliminate invalid and meaningless comments and content, such as meaningless repetitive words, exceedingly short text, and individual emoticons. We performed specific preprocessing operations, such as deactivation lexicon construction, construction of synonym dictionary, jieba participle, removal of deactivated words, replacement of synonyms, and lexical screening specification, on the text data including DMO policy text and UGC, and finally selected the noun words in the DMO text and UGC comments to analyze the factors affecting the distribution of B&Bs in Beijing B&Bs. The noun words of DMO texts and UGC comments are selected to analyze the factors influencing on the distribution of B&Bs in BTH.

4 Spatial distribution of regional B&Bs in BTH

Herein, the distribution characteristics of B&Bs in BTH are discussed. Specifically, the type of spatial distribution and the density of B&Bs are discussed. The distribution type reflects the degree of dispersion or concentration of B&Bs; meanwhile, the distribution density describes the relationship between the probability of the account of B&Bs falling within an interval and the length of the interval.

4.1 The type of spatial distribution of B&Bs in BTH

The nearest neighbor index was utilized to measure the spatial distribution characteristics of BTH area B&Bs and to determine whether they are clustered: three types of spatial distribution were utilized to describe the spatial distribution of point elements in the study area, namely aggregated distribution, random distribution, and uniform distribution as described in Section 3.1.1. Results of B&Bs in BTH are depicted in Fig. 2. The R value is 0.294337, less than 1, indicating an aggregated distribution of the BTH B&Bs. The standard score Z-value is -43.827669, indicating that the probability of randomly generating this clustering pattern is less than 1%. The significance level P-value is 0, indicating that the spatial distribution of B&Bs in the BTH is in a typical agglomeration. The result indicates that the distribution of B&Bs in BTH presented significant aggregation characteristics.
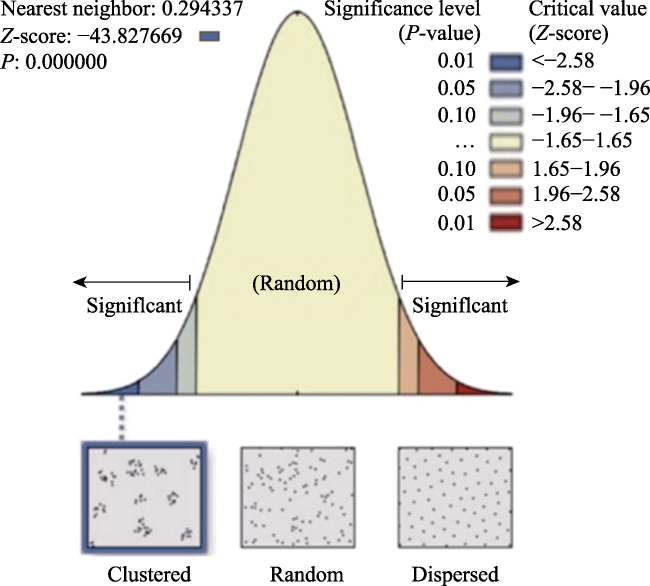
Fig. 2 The Nearest Neighbor Index distribution of B&Bs in BTH
From the nearest neighbor index, it is apparent that the spatial distribution of B&Bs in the BTH region is a typical agglomeration state, forming several B&Bs agglomerations. The distribution pattern of the agglomerations forms a concentric radial distribution centered on Beijing and a mononuclear agglomeration feature with the cities of Hebei Province as the core. The tourism resources and favorable location around the origin can be effectively utilized to develop the tourism B&Bs industry with foreign capital and a large source market, and the dispersal from one core to multiple cores is also conducive to integrated regional development.

4.2 The density of B&Bs in BTH

The Kernel Density tool of ArcGIS software was utilized to map the kernel density of 1053 B&Bs, and the natural breakpoint method was utilized to identify data classification intervals, thereby maximizing the differences between classes; subsequently, the kernel density was classified into five classes, as illustrated in Fig. 3. The overall distribution pattern of B&Bs in BTH is concentric-radial and single-core clustering. The concentric radiation type is reflected in the apparent central agglomeration distribution with Beijing as the center, i.e., there is a core dense area of spatial distribution in the region, and the core dense area gradually spreads to the periphery, forming circles with different degrees of density. The single-core agglomeration type is reflected as follows: the distribution of B&Bs is based on the city center of each city in Hebei Province, with the core representing the origin, thereby forming an agglomeration around the origin.
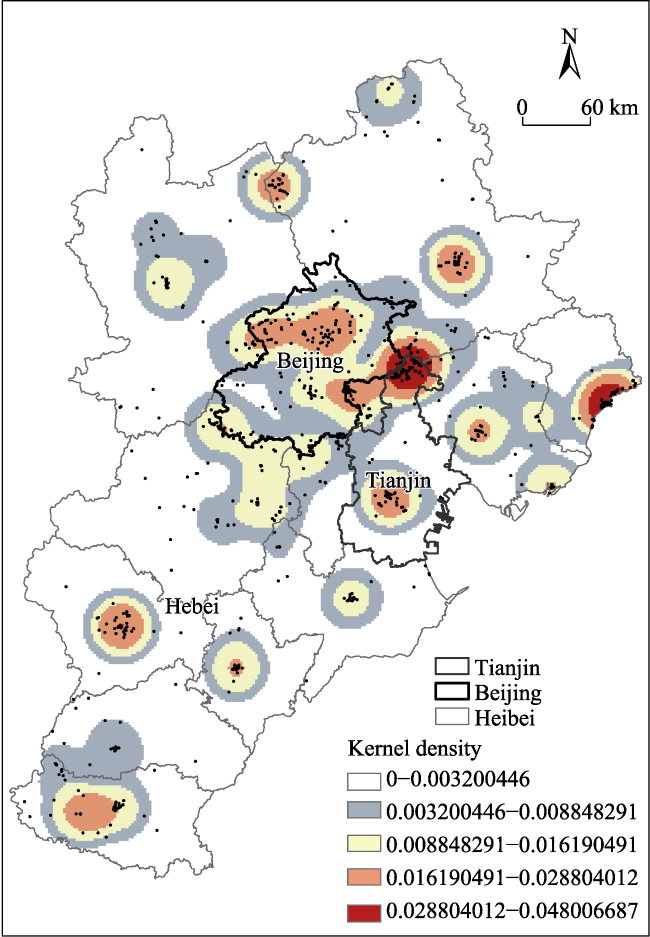
Fig. 3 The kernel density of B&Bs distribution in the BTH
The spatial distribution density of B&Bs in BTH indicates that the overall distribution of B&Bs is exceedingly affected by the level of economic development, mainly concentrated in the rural areas around Beijing and in the more developed cities and counties of Hebei Province with a more developed tourism economy, such as Qinhuangdao, Chengde, and Shijiazhuang. From the results of the kernel density analysis, the Beijing-Tianjin-Hebei Province junction exhibits a concentrated distribution of B&Bs, with Pinggu District in eastern Beijing exhibiting the largest number of B&Bs and the most intensive distribution with Tianjin and Hebei Province. The distribution of tourism resources is a causitive factor for the distribution characteristics of B&Bs in BTH. These suburban areas in Pinggu, Huairou, and Yanqing Districts exhibit more appealing tourist attractions and are the first choice for individuals to travel around the suburbs, with the tourism industry driving the burgeoning development of the B&Bs industry. However, compared with the core areas of the capital function, Dongcheng District, and Xicheng District, as well as other areas with more prominent political, scientific, and technological functions, the B&Bs‘s number is limited and the distribution is relatively scattered, indicating that the distribution of B&Bs is affected by policy support and urban integration strategies, which is consistent with the BTH-related regional integration strategy which can evacuate the non-capital functions of Beijing to the city’s periphery.

5 Influencing factors based on LDA model

To identify the factors which influenced the distribution of B&Bs in BTH, LDA thematic analysis were utilized in BTH based on DMO and UGC; thus, optimal number of topics was decided, and the topic name was synthesized.

5.1 The optimal number of topics based on perplexity

The optimal number of topics for UGC text and DMO text is determined by the topic perplexity, a metric utilized to evaluate the goodness of a language model. It is based on the language model’s ability to predict the text, i.e., the accuracy of the model’s prediction for each word in the text. When the perplexity is lower and the number of topics is at a rational level, the model is more capable of categorizing the topics of the document, and the clustering effect is more optimal. The perplexity curve describes the relationship between perplexity and the number of topics. When the number of topics is low, the perplexity decreases as the number of topics increases. The perplexity curve is used to find the optimal balance between perplexity and the number of topics. This turning point is usually considered to be the optimal number of topics.
Therefore, the perplexity curve of DMO and UGC are depicted in Fig. 4 and Fig. 5, respectively. When topics are 7, the perplexity of DMO topic has decreased to a stable level, and the perplexity after 7 tends to stabilize; the rate of decline continues to become smaller; and combined with the topic text scenario, 7 is the best choice for the number of DMO topics. For UGC, when topics are 5, the perplexity has decreased to a suitable level, and is not increasing; therefore, 5 is the most favorable choice for the optimal number of UGC topics.
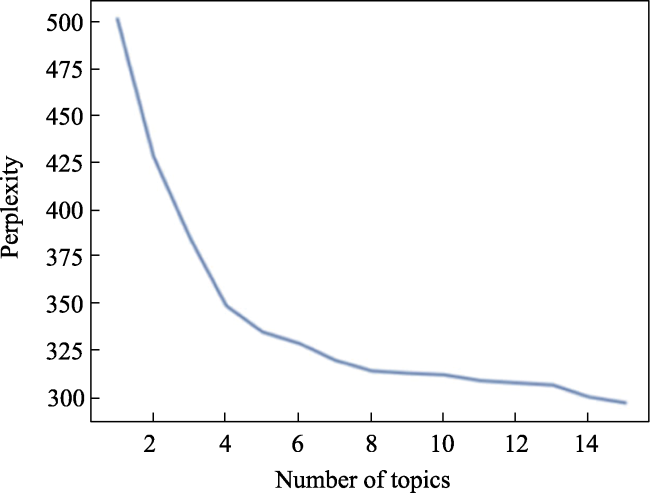
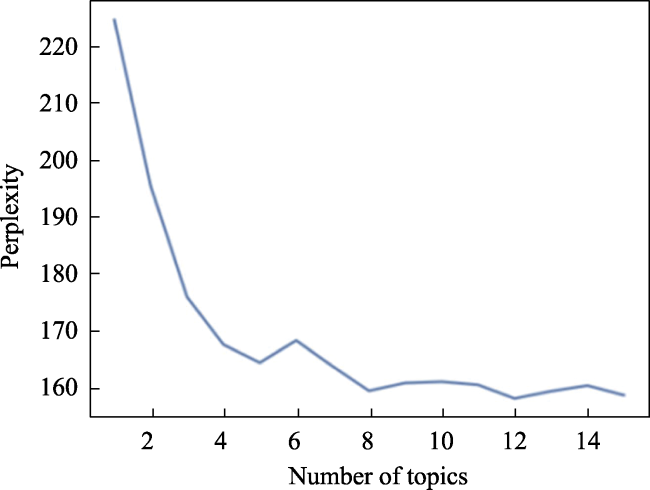
Fig. 4 DMO topic perplexity level
Fig. 5 UGC topic perplexity level

5.2 The high-frequency words and topics

The representative high-frequency words of DMO and UGCselected by the LDA algorithm are depicted in Table 1 and Table 2 respectively. These high-frequency words can must optimally interpret the central meaning of the topic, and the number of high-frequency words under each topic is affected by the text quality. To ensure the unity of the structure, the most representative six high-frequency words were filtered out for each topic. Based on high frequency keywords, topics are synthesized as indicated in the right column.
Table 1 DMO text topics
NO. High frequency keywords Topic
Topic 1 Tourism, B&Bs, countryside, tourists, scenic spots, resources Beautiful countryside
Topic 2 Tourism, culture, sports, ice and snow, market, experience Ice and snow tourism
Topic 3 Pollution, concentration, air quality, weather, environment, atmosphere Air quality
Topic 4 Railroads, high-speed rail, construction, trains, passengers, ports Transportation infrastructure
Topic 5 Cooperation, education, hospital, medical, school, research Education and medical resources
Topic 6 Industry, enterprise, center, science and technology, project, technology Industry cooperation
Topic 7 Services, talent, information, demographics, enterprises, personnel Demographic
Table 2 UGC text topics
NO. High frequency keywords Topic
Topic 1 Room, facilities, arrangement, style, supplies, design Interior room facilities
Topic 2 Scenic spots, water towns, neighborhoods, tourism, places, walking Tourist attractions
Topic 3 Environment, scenery, surroundings, accommodation, location, reforest Scenic environment
Topic 4 Transportation, butler, parking, driver, airport, distance Transportation infrastructure
Topic 5 Landlord, hospitality, room, service, delicious, front desk Landlord services
From Table 1 and Table 2, we inferred that beautiful country, air quality, transportation, demographic, and tourist attractions were both extracted from the UGC and DMO texts. Education and medical resources and industry cooperation from DMO are summarized as Regional GDP because expenditures in the fields of education, health care, and industry account for a large share of regional GDP, whereas the development of these three fields can, in turn, contribute to regional GDP growth. Demographic as Topic 7 of DMO is a factor related to population, herein denoted as population density. The high-frequency words of Transportation focus on the transportation network; therefore, the variable Road Network density is identified. Among the topics extracted from the UGC texts, interior room facilities and landlord services are not included in the factors because they are usually as internal factors related to service quality which is influenced by localization and market positioning. The high frequency words of transportation infrastructure focused on transportation stations; therefore, the variable is identified as Traffic stops. Therefore, 9 influencing factors extracted based on the LDA model are concluded as depicted in Table 3. Ice and snow tourism activities and sports parks variables are extracted based on DMO thematic analysis, which represented the geographical characteristics for Beijing Olympics and Beijing Winter Olympics, whereas the other 7 factors have been validated in previous studies by scholars.
Table 3 Factors influencing the distribution of B&Bs in BTH based on the LDA model
Factor Supporting literatures
Regional GDP Eugenio-Martin et al., 2019; Hou and Hu, 2023
Population density Gutiérrez et al., 2017; Shan et al., 2023
Air quality Wang et al., 2022
Snow and ice activities -
Sports park -
Beautiful countryside Sainaghi and Chica-Olmo, 2022; Sánchez-Franco and Aramendia-Muneta, 2023
Tourist attractions Ioannides et al., 2019; Xu et al., 2020; Ma et al., 2021
Road network Hong and Yoo, 2020
Traffic stops Ki and Lee, 2019

6 Exploring the relationship between the distribution of B&Bs and the factors

The spatial distribution of B&Bs is a typical geospatial concept. According to the administrative division method, it is more appropriate to divide the three BTH regions into 200 units according to the district and county level, factors, and geographic data, all on a district and county basis. The B&Bs distribution data are imported into SPSS software for regression analysis. The density of B&Bs distribution in the BTH was set as the dependent variable Y, and the distribution influencing factors (index) as depicted in Table 4 were set as independent variables X1, X2, $\cdots $, Xn (n is 9, meaning the number of the indexes).
Table 4 Results of regression analysis
NO. Index Unstandardized factor P-value VIF
B Standard errors
Constant -0.001 0.001 0.240 -
X1 Regional GDPs -2.618 <0.001 0.002 1.336
X2 Population density -1.199 <0.001 0.015 5.935
X3 Air quality 0.014 <0.001 <0.001 1.465
X4 Snow and ice venues -0.240 0.356 0.501 1.755
X5 Sports park 1.018 0.204 <0.001 2.267
X6 Beautiful countryside 1.084 0.092 <0.001 2.311
X7 A-class scenic spots 0.072 0.032 0.026 4.610
X8 Road density 0.022 0.005 <0.001 2.613
X9 Transportation stations 0.312 0.153 0.043 1.635

6.1 Correlated relationship between factors

Correlation analysis is a prerequisite for regression analysis, and there is no point in performing regression analysis on variables that are not correlated. The variables are first analyzed for correlation to determine whether there is a highly correlated relationship between the variables. The results of Pearson correlation test indicated that there was a significant correlation between B&Bs density Y and each X variable with P-value <0.05, and there was no need to exclude the variables. Considering the text data characteristics and model superiority, the text exhibits the highest goodness-of- fit using multiple linear regression model.

6.2 Regression analysis of influencing factors

Regression analysis is subsequently performed to infer the interrelationship between the variables. The regression model was built for regression analysis, and the regression model (R=0.900, R2=0.811, Adjust R2=0.802>0.7, F=89.050) fitted well overall. The VIF value is utilized to determine whether the model exhibits a multicollinearity problem, and each VIF value was <7, which was not affected by multicollinearity. The regression coefficients B indicates the degree of influence of the independent variable on the dependent variable; the positive value indicates that the dependent variable increases as the independent variable increases whereas the negative value infers the opposite. The standard error is the fluctuation value of B. Significance implies whether the results are significant or not. The regression coefficients among each variable and B&Bs density are depicted in Table 4.
It can be observed that the influence of different variable factors on the spatial distribution of B&Bs in the BTH region varies. Among the nine factors, all of them are significant, except for snow and ice activity venues which do not exert a significant effect on the aggregation pertaining to the spatial distribution of B&Bs in the BTH region (P=0.501> 0.05). The regression coefficients B were tested for different coefficients of the same model, with larger values denoting a greater influence on the dependent variable, indicating that the distribution of B&Bs in the BTH region was most positively influenced by the distribution of beautiful countryside and least influenced by air quality. In the BTH city cluster, the ranking pertaining to the effect of the distribution of B&Bs being positively influenced by factors is as follows: beautiful countryside (1.084) > sports parks (1.018) > transport stations (0.312) > A-class scenic spots (0.072) > road network density (0.022) > air quality (0.014). Regional GDP, population density, and snow and ice venues exert a negative effect on B&Bs in the BTH, and economic factors and population density exert a negative effect on B&Bs density.

6.3 Discussion

Based on the magnitude of factor impact on B&Bs distribution, 9 factors are grouped into 3 levels: Key factors with the regression coefficients more than 1, non-significant factors with positive effect but not significant, and negative factors with a negative effect.

6.3.1 Negative factors

Negative factors included regional GDPs, population density, and snow and ice venues, which are grouped into two scenarios. Regional GDPs and population density exert a significantly negative effect. For unevenness in the economic development of the BTH region, different factors have different influences on the pattern of B&Bs in the BTH in regard to county area. The inverse ratio of the B&Bs distribution density in the BTH to the population and GDP profile indicates the outward diffusion of capital functions, with non-capital functions in the central area of Beijing being decentralized outwards to relieve pressure on the central city and relocate tourism, entertainment, and accommodation functions to the peripheral areas, consistent with the goal of BTH integrated development.
For ice and snow activities with an insignificant negative influence for its geographically limited to specific locations. The result also reflects the constraints of the natural conditions in the BTH region, where there are still only a few areas where ice and snow activity venues can be built, and the conditions for the construction of B&Bs are limited, thereby increasing the difficulty with which a clustering effect can be created. In the post-Winter Olympics era, ice and snow sports have developed rapidly. The BTH region should comprehensively explore the advantages of ice and snow sports, realize regional linkage for the development of the ice and snow industry, and realize resource sharing and complementary advantages. In addition, ice and snow sports are sports with significant seasonal differences; how to innovate tourism products and leisure products in non-ice and snow seasons exerts a crucial role in introducing the ice and snow factors into the development of B&Bs.

6.3.2 Non-significant factors

Factors with an insignificant positive effect include air quality, A-class scenic spots, road density, and transportation stations. The lower impact of air quality indicates that the location of B&Bs in the BTH is less restricted by the natural environment. Since human landscapes exerts an equivalent role as the natural ones, the distribution of B&Bs are less dependent on the environment. The environmental pollution occasioned by industrial development in central and southern Hebei province and the pollution occasioned by Beijing’s ‘cosmopolis disease’ are enhancing year on year through government efforts, and the disparity in air quality between the regions is narrowing; therefore, they are less affected by the environment.
The distribution of B&Bs in the BTH region is positively influenced by transportation stations such as high-speed rail stations, airports, and train stations, as well as positively correlated with the density of road networks such as highway networks, intercity transportation tracks, and railroad systems. With the development of China’s economy and the BTH integration, abundant transportation options and convenient transportation have further effectively connected various parts within the BTH region. The transportation network has effectively connected all parts of the region. Therefore, the role of transportation in the distribution of B&Bs is not as crucial as it was at the beginning of economic development.
The BTH region is rich in tourism resources, and there are 220 A-scenic spots in Beijing; therefore, the results of analyzing the A-grade scenic spots as an influencing factor are not significant. In the subsequent study, the impact pertaining to the distribution of B&Bs in different grade A scenic spots can be further analyzed.

6.3.3 Key factors

Key factors beautiful countryside and sports park exerted an exceedingly crucial role in the distribution of B&Bs in BTH. Rural tourism development and sports park construction in the context of integration impacted the distribution of B&Bs, emphasizing that the distribution of B&Bs in BTH is influenced by policy orientation. The significant positive impact of beautiful countryside on the distribution of B&Bs reflects the effectiveness of the development of rural accommodation and rural tourism under the BTH integration strategy. Beautiful countryside with level 1 importance and the rural revitalization strategy, with B&Bs revitalizing unutilized rural properties, enhancing rural infrastructure and effectively boosting the economic development of the more backward areas around the city. The BTH region is highly valued by the government and the market: a large amount of money is invested to enhance the residents' sporting environment, and sports parks were built with leisure and relaxation, fitness, and entertainment values.
Beijing successfully hosted the Summer and Winter Olympic Games, leaving behind a wealth of sports resources, such high-level competition venues and sport parks such as Yanqing and Zhangjiakou. These sports park became unique sports experience and sightseeing attractions, which also introduces more opportunities for the development of B&Bs and effects a positive role in promoting the development of tourism in Beijing.

7 Conclusions and suggestions

Optimizing the distribution of B&Bs becomes a crucial factor that promotes the development of regional cultural tourism in the BTH integrated region, and the distribution of B&Bs should capture local characteristics of cultural tourism resources, thereby providing more effective support for the development of local cultural tourism industries. This study goes beyond the research paradigm of individual cities to explore the spatial distribution pattern of B&Bs in the context of BTH city cluster integrated development.
Online big data provided new opportunity for researchers to investigate potential opportunities for B&Bs development. Accordingly, this study utilized B&Bs’ big data such DMO and UGC text, and an intelligent method (i.e., LDA thematic analysis) to investigate the factors influencing the distribution of B&Bs in the BTH region. The result revealed the consistency with the traditional methods and identified some of the geographical characteristics for Beijing Olympics and Beijing Winter Olympics. Based on regression analysis between the B&Bs distribution and these factors, there is a significant effect.
Based on results, this study postulates the following homestay development proposals.
(1) Actively develop rural boutique B&Bs
On one hand, B&Bs can expand and cluster from traditional destinations to rural areas and residential communities, enriching the diversity of B&Bs accommodation and relieving pressure on urban centers, while on the other hand, they can potentially become more intelligent, boutique, and high-end. B&Bs can potentially be dedicated to customer experience, enhance service quality, and increase the interaction between B&Bs owners and customers. The migration and development of the homestay to the junction of the three provinces can be rationalized as follows: rural areas are favored by the market and supported by the government compared to urban centers.
(2) Promoting the construction of community B&Bs
The distribution pattern of B&Bs in the BTH is both consistent with the general rules of industrial spatial development and unique to the region due to the integrated development strategy. Currently, the construction of B&Bs clusters in the BTH is generally achieved through top-down unified intervention, whereas it is difficult to achieve local B&Bs development and form local symbols in a short period of time by relying solely on bottom-up forces (Sacco et al., 2019). The expansion of B&Bs clusters in the BTH region from urban centers to the periphery comprehensively reflects the development trend of rural eco-B&Bs and community B&Bs driven by the integrated development strategy.
(3) Integrating the traits of BTH culture and tourism to develop B&Bs
B&Bs in BTH are even providing accommodation that incorporates local culture, history, and tradition, enabling tourism consumers to understand local culture and promoting the integrated development of local cultural and tourism integration. Building boutique B&Bs in conjunction with ice and snow activity venues and sports venues is also an effective method of creating boutique cultural and tourism projects and enhancing tourism benefits and regional integration. The tourism resources and favorable location advantages around the origin can be effectively utilized to introduce foreign capital and a huge source market, thereby developing the tourism B&Bs industry, and the dispersion from one core to many cores is also conducive to regional integrated development.
The study innovatively selects the BTH urban agglomeration as the case study to conduct the research on the distribution characteristics and influencing factors of geographic elements, and utilizes multi-source data and computerized LDA thematic analysis method, which also realizes the innovation in research data and methods, and provides novel research concepts and methods for exploring the spatial distribution of the B&Bs in BTH. This study still exhibits limitations: for instance, the residents’ perspective, which exerts a crucial role in B&Bs, is not included. According to the LDA method, the bag-of-words model expresses the text as the frequency vector of words, ignoring the contextual information of words, which may lead to the loss of semantic information. When exploring the influencing factors, linear regression may not be the most optimal method. In future research, more perspective and semantic analysis should be considered to conduct a more comprehensive analysis of impact factor analysis. For analyzing the relationship between the influences and the distribution, a more optimal regression method can be chosen.
[1]
Adamiak C. 2018. Mapping Airbnb supply in European cities. Annals of Tourism Research, 71(C): 67-71.

[2]
Adamiak C. 2022. Current state and development of Airbnb accommodation offer in 167 countries. Current Issues in Tourism, 25(19): 3131-3149.

[3]
Adamiak C, Szyda B, Dubownik A, et al. 2019. Airbnb offer in Spain—Spatial analysis of the pattern and determinants of its distribution. ISPRS International Journal of Geo-Information, 8(3): 155. DOI: 10.3390/ijgi8030155.

[4]
Anselin L, Syabri I, Kho Y. 2010. GeoDa:An introduction to spatial data analysis. In: Fischer M M, Getis A (eds.). Handbook of applied spatial analysis: Software tools, methods and applications. Berlin, German, Springer.

[5]
Cheng M M, Jin X. 2019. What do Airbnb users care about? An analysis of online review comments. International Journal of Hospitality Management, 76: 58-70.

[6]
Cheng M M, Zhang G J, Wong I A. 2020. Spanning across the boundary of Airbnb host community: A network perspective. International Journal of Hospitality Management, 89: 102541. DOI: 10.1016/j.ijhm.2020.102541.

[7]
De Neve J E, Sachs J D. 2020. The SDGs and human well-being: A global analysis of synergies, trade-offs, and regional differences. Scientific Reports, 10(1): 15113. DOI: 10.1038/s41598-020-71916-9.

[8]
Dudás G, Vida G, Kovalcsik T, et al. 2017. A socio-economic analysis of Airbnb in New York City. Regional Statistics, 7(1): 135-151.

[9]
Eugenio-Martin J L, Cazorla-Artiles J M, González-Martel C. 2019. On the determinants of Airbnb location and its spatial distribution. Tourism Economics, 25(8): 1224-1244.

DOI

[10]
Gutiérrez J, García-Palomares J C, Romanillos G, et al. 2017. The eruption of Airbnb in tourist cities: Comparing spatial patterns of hotels and peer-to-peer accommodation in Barcelona. Tourism Management, 62: 278-291.

[11]
Hoffman L M, Heisler B S. 2020. Airbnb, short-term rentals and the future of housing. London, UK and New York, USA: Routledge.

[12]
Hong I, Yoo C. 2020. Analyzing spatial variance of Airbnb pricing determinants using multiscale GWR approach. Sustainability, 12(11): 4710. DOI: 10.3390/su12114710.

[13]
Hou Y, Hu H. 2023. Analysis on spatial distribution characteristics and driving force of boutique homestay inns in Yangshuo. Journal of Guilin University of Technology, 43(2): 333-342. (in Chinese)

[14]
Ioannides D, Röslmaier M, van der Zee E. 2019. Airbnb as an instigator of ‘tourism bubble’ expansion in Utrecht’s Lombok neighbourhood. Tourism Geographies, 21(5): 822-840.

DOI

[15]
Ji Y, Dai Y, Hu W. 2013. Collaborative government governance: The realization path of collaborative governance for regional coordinated development in China. Journal of Northwestern University (Philosophy and Social Science Edition), 43(2): 122-126. (in Chinese)

[16]
Jiang H, Mei L, Wei Y, et al. 2022. The influence of the neighbourhood environment on peer-to-peer accommodations: A random forest regression analysis. Journal of Hospitality and Tourism Management, 51: 105-118.

[17]
Ki D, Lee S. 2019. Spatial distribution and location characteristics of Airbnb in Seoul, Korea. Sustainability, 11(15): 4108. DOI: 10.3390/su11154108.

[18]
Kong L, Wang Y, Xie J. 2022. Integration enlargement, coordinated agglomeration and regional innovation in the Yangtze River Delta. Financial Research, 48(12): 34-47. (in Chinese)

[19]
La L, Xu F, Hu M, et al. 2021. Location of Airbnb and hotels: The spatial distribution and relationships. Tourism Review, 77(1): 209-224.

[20]
Lagonigro R, Martori J C, Apparicio P. 2020. Understanding Airbnb spatial distribution in a southern European city: The case of Barcelona. Applied Geography, 115: 102136. DOI: 10.1016/j.apgeog.2019.102136.

[21]
Lee Y J A, Jang S, Kim J. 2020. Tourism clusters and peer-to-peer accommodation. Annals of Tourism Research, 83: 102960. DOI: 10.1016/j.annals.2020.102960.

[22]
Li M Y, Ouyang W, Zhang D Y. 2023. Spatial distribution characteristics and influencing factors of traditional villages in Guangxi Zhuang Autonomous Region. Sustainability, 15(1): 632. DOI: 10.3390/su15010632.

[23]
Lin H, Huang J, Chen Y. 2019. The developmental pattern of urban agglomerations in China. International Journal of Intelligent Information and Management Science, 8(1): 23-24.

[24]
Long F, Liu J, Zhu H, et al. 2019. Spatial distribution of homestay and its influencing factors in the Yangtze River Delta of China. Geographic Research, 38(4): 950-960. (in Chinese)

[25]
Ma X, Hou G, Li L, et al. 2021. Cluster identification, distribution patern and influencing factors of B&B based on DBSCAN: A case study of Nanjing. Human Geography, 36(1): 84-93. (in Chinese)

[26]
Ming Y. 2021. Study on spatial distribution characteristics and influencing factors of Yangshuo B&B from the perspective of territorial tourism, Guangxi, China. Diss., Guilin, China: Guilin University of Technology. (in Chinese)

[27]
Moreau D P. 2001. Governance: A shift in power? The Debate, (3): 165-172. (in French)

[28]
Qi W, Lin Y, Li M. 2023. Integrated development of regional economic circle and manufacturing enterprise innovation—Evidence from Chengdu-Chongqing economic circle. Statistics and Decision Making, 11: 162-167. (in Chinese)

[29]
Quattrone G, Greatorex A, Quercia D, et al. 2018. Analyzing and predicting the spatial penetration of Airbnb in US cities. EPJ Data Science, 7(1): 31. DOI: 10.1140/epjds/s13688-018-0156-6.

[30]
Rabiei-Dastjerdi H, McArdle G, Hynes W. 2022. Which came first, the gentrification or the Airbnb? Identifying spatial patterns of neighbourhood change using Airbnb data. Habitat International, 125: 102582. DOI: 10.1016/j.habitatint.2022.102582.

[31]
Roelofsen M. 2018. Exploring the socio-spatial inequalities of Airbnb in Sofia, Bulgaria. Erdkunde, 72(4): 313-327.

[32]
Ruhrmann H, Fritsch M, Leydesdorff L. 2022. Synergy and policy-making in German innovation systems: Smart specialisation strategies at national, regional, local levels? Regional Studies, 56(9): 1468-1479.

[33]
Sacco P L, Ghirardi S, Tartari M, et al. 2019. Two versions of heterotopia: The role of art practices in participative urban renewal processes. Cities, 89: 199-208.

[34]
Sainaghi R, Baggio R. 2020. Clusters of topics and research designs in peer-to-peer accommodation platforms. International Journal of Hospitality Management, 88: 102393. DOI: 10.1016/j.ijhm.2019.102393.

[35]
Sainaghi R, Chica-Olmo J. 2022. The effects of location before and during COVID-19: Impacts on revenue of Airbnb listings in Milan (Italy). Annals of Tourism Research, 96: 103464. DOI: 10.1016/j.annals.2022.103464.

[36]
Sánchez-Franco M J, Aramendia-Muneta M E. 2023. Why do guests stay at Airbnb versus hotels? An empirical analysis of necessary and sufficient conditions. Journal of Innovation & Knowledge, 8(3): 100380. DOI: 10.1016/j.jik.2023.100380.

[37]
Shan L, He S, Wan C. 2023. Unraveling the dynamic Airbnb-gentrification interrelation before and after the COVID-19 Pandemic: Evidence from Beijing, China. Cities, 137: 104270. DOI: 10.1016/j.cities.2023.104270.

[38]
Shen S, Shi C. 2022. Spatial distribution characteristics and influencing factors for homestay inns in southern Jiangsu and northern Zhejiang. Tropical Geography, 42(1): 123-135. (in Chinese)

DOI

[39]
Souza L H, Pena L C S, Moesch M M. 2017. Knowledge and synergy as drivers of regional innovation in tourism: The case of the Tourism Observatory in the Federal District. Brazilian Journal of Tourism Research, 11(1): 19-38. (in Portuguese)

[40]
Sun S, Wang X, Hu M. 2022. Spatial distribution of Airbnb and its influencing factors: A case study of Suzhou, China. Applied Geography, 139: 102641. DOI: 10.1016/j.apgeog.2022.102641.

[41]
Tan F F, Kong Q X. 2020. Uncovering the driving mechanism of regional synergistic development based on Haken model: Case of the Bohai Rim region. Environment, Development and Sustainability, 22(4): 3291-3308.

[42]
Tang B, Luo H. 2022. Mismatch and coupling: A study on the synergistic development of Tourism-Economy-Ecology systems in the Pearl River Delta. Sustainability, 14(14): 8518. DOI: 10.3390/su14148518.

[43]
Tang C, Sun M, Wan Z. 2019. Spatial distribution characteristics of high-level scenic spots and its influencing factors in Beijing-Tianjin- Hebei urban agglomeration. Economic Geography, 39(10): 204-213. (in Chinese)

[44]
Van Berkel R, van Beers D, Bossilkov A. 2016. Regional resource synergies for sustainable development: The case of Kwinana. Materials Forum, 30: 176-187.

[45]
Wang W, Yang Q, Gan X, et al. 2022. Spatial distribution pattern and influencing factors of homestays in Chongqing, China. Applied Sciences, 12(17): 17. DOI: 10.3390/app12178832.

[46]
Xiao Z, An C. 2022. Spatial distribution and influencing factors of Xinjiang farmhouse resorts: An analysis based on POI data. Journal of Southwestern University (Natural Science Edition), 44(4): 144-154. (in Chinese)

[47]
Xu F, Hu M, La L, et al. 2020. The influence of neighbourhood environment on Airbnb: A geographically weighed regression analysis. Tourism Geographies, 22(1): 192-209.

[48]
Zervas G, Proserpio D, Byers J W. 2017. The rise of the sharing economy: Estimating the impact of Airbnb on the hotel industry. Journal of Marketing Research, 54(5): 687-705.

Outlines

/