
Journal of Resources and Ecology >
Coupling Effect and Driving Mechanisms in High-quality Development of Rural Tourism and Rural Revitalization—Taking Hunan Province as a Case Study
Received date: 2023-06-22
Accepted date: 2023-12-01
Online published: 2024-05-24
Supported by
The Major Projects of Fujian Provincial Social Science Planning Fund(FJ2021Z005)
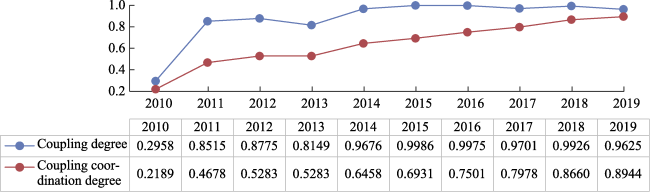
Rural tourism plays a crucial role in promoting rural revitalization and offers excellent opportunities for high-quality development. This study presents a coupling coordination model with Hunan Province as a case study. The model utilizes IAHP (Improved Analytic Hierarchy Process) and trophy-weighted TOPSIS (Technique for Order Preference by Similarity to Solution) to evaluate the dynamic evolution process of the coupling coordination between rural tourism and rural revitalization from 2010 to 2019. Additionally, it explores the dominant factors and driving mechanisms that impact the coupling of this system. The results demonstrate that the rural tourism and rural revitalization indices in Hunan Province increased significantly from 2010 to 2019, whereas the relative priority of tourism gradually declined. The degree of coupling between rural tourism and rural revitalization increased from 0.3 to 0.96 and progressed through three stages: low-level coupling, adjustment, and high-level coupling. The degree of coupling coordination has increased from 0.22 to 0.89. This increase can be divided into four stages: moderately imbalanced with a dual-low index, a transitional stage with a lower index, initial coordination with a moderate index, and relatively good coordination prioritizing revitalization. The relationship between rural tourism and rural revitalization is affected by factors, such as local general public budget revenue, rural tourism satisfaction, road network density, agricultural production conditions, the processing rate of agricultural products, and the Engel coefficient of rural residents. Effective approaches to improve coupling coordination include strengthening financial support, optimizing service facilities, and promoting industrial integration.
Key words: coupling effect; driving mechanisms; rural revitalization; rural tourism; TOPSIS
LI Wei , JI Zuqiang , LIN Jin . Coupling Effect and Driving Mechanisms in High-quality Development of Rural Tourism and Rural Revitalization—Taking Hunan Province as a Case Study[J]. Journal of Resources and Ecology, 2024 , 15(3) : 541 -553 . DOI: 10.5814/j.issn.1674-764x.2024.03.003
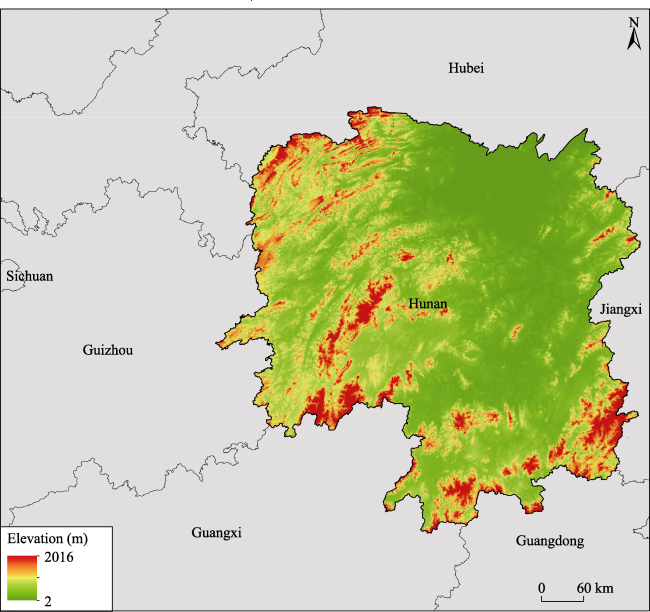
Fig. 1 Study area |
Table 1 Index system of rural tourism rural revitalization coupling system |
| Goal layer | System layer | Criterion layer | Indicator layer | Indicator interpretation | Source | Weight |
|---|---|---|---|---|---|---|
| Coupling and coordination of rural tourism and rural revitalization | Rural tourism subsystem | Overall quality and efficiency | Number of visitors for leisure agriculture and rural tourism (T1) | Measuring the development status of rural tourism from the perspective of tourist numbers | Ma, 2019; Pang, 2019 | 0.07754 |
| Income from leisure agriculture and rural tourism (T2) | Measuring the development of rural tourism from the perspective of tourism revenue | Pang, 2019; Nie, 2019 | 0.07729 | |||
| Proportion of total tourism revenue to GDP (T3) | Total tourism revenue/GDP | Xiao et al., 2022 | 0.07580 | |||
| Resource base | Number of scenic spots above A-Level (T4) | Reflecting the overall endowment of regional tourism resources | Zhao and Lu, 2020; Yin and Tang, 2021 | 0.06634 | ||
| Number of national-level leisure agriculture and rural tourism demonstration sites (T5) | Measuring the development of high quality rural tourism demonstration sites | Hu et al., 2015; Pang, 2019 | 0.05296 | |||
| Number of five-star rural tourism areas (sites) (T6) | Measuring the development of high-level rural tourism areas (points) | Zhao and Lu, 2020 | 0.06395 | |||
| Number of star-rated rural homestays (farmhouses) (T7) | Measuring the development of high standard rural tourism market entities | Hu, 2015; Zhao and Lu, 2020 | 0.06072 | |||
| Market demand | Urban-rural income ratio (T8) | Per capita disposable income of urban residents/per capita disposable income of rural residents | Ma, 2019; Lin and Zeng, 2021 | 0.06576 | ||
| Urbanization rate (T9) | Permanent population/total population | Zhao and Lu, 2020 | 0.06946 | |||
| Per capita tourism consumption expenditure(T10) | Reflecting the consumption expenditure of urban and rural residents on tourism | Yin and Tang, 2021 | 0.07412 | |||
| Local general public budget revenue (T11) | Characterizing the self investment capacity of rural tourism development | Hu et al., 2015 | 0.05994 | |||
| Service pack | Number of homestay operators (T12) | Measuring the reception capacity of rural tourism market | Xiao et al., 2022 | 0.06464 | ||
| Number of tourism enterprises (T13) | Using the approximate replacement of “number of travel agencies” to measure the reception capacity of rural tourism market | Yin and Tang, 2021; Xiao et al., 2022 | 0.07110 | |||
| Level of satisfaction with rural tourism (T14) | Using the “Business Environment Index” as an approximation to reflect the subjective satisfaction level of tourists with the rural tourism experience | Ma, 2019; Dong et al., 2020 | 0.05297 | |||
| Road network density (T15) | Road network length/area, reflecting the level of transportation development | Hu et al., 2015; Nie, 2019 | 0.06740 | |||
| Rural revitalization subsystem | Industrial prosperity | Integrated grain production capacity (R1) | Using the approximate replacement of “total grain crop yield” to reflect the ability and level of food security | National Rural Revitalization Plan, 2018; Nie, 2019 | 0.04694 | |
| Agricultural production conditions (R2) | Total power of agricultural machinery×rural power consumption | Pang, 2019; Zhao and Lu, 2020 | 0.05599 | |||
| Agricultural labor productivity (R3) | Value added of primary industry/labor force in agriculture, forestry, animal husbandry, and fishery | National Rural Revitalization Plan, 2018 | 0.04973 | |||
| Processing rate of agricultural products (R4) | Agricultural product processing output value/total agricultural output value | National Rural Revitalization Plan, 2018 | 0.06133 | |||
| Rural online retail sales (R5) | Measuring the development of rural e-commerce | Rural Revitalization Plan in Fujian Province, 2018 | 0.07145 | |||
| Ecological livability | Forest coverage rate (R6) | Overall reflection of regional ecological environment | Nie, 2019; Lin and Zeng, 2021 | 0.07240 | ||
| Greenery coverage rate of villages (R7) | Village green coverage area/total land area of the village | Ma, 2019; Dong et al., 2020 | 0.05285 | |||
| Percentage of villages with waste management (R8) | Number of villages/total number of villages handling household waste | Nie, 2019; Dong et al., 2020 | 0.08561 | |||
| Coverage rate of sanitary toilets in rural areas (R9) | Number of sanitary toilet renovations/total number of toilets | Zhao and Lu, 2020 | 0.07054 | |||
| Rural culture and civilization | Coverage rate of comprehensive cultural service centers in villages (R10) | Number of comprehensive cultural service centers in villages/total number of village | Dong et al., 2020 | 0.06658 | ||
| Proportion of civilized villages and towns at the county level and above (R11) | Number of civilized villages and towns at or above the county level/total number of villages and towns | Nie, 2019; Xiao et al., 2022 | 0.06842 | |||
| Educational level of rural household leaders (R12) | Reflecting the education status of rural residents | Nie, 2019 | 0.05693 | |||
| Live in affluence | Per capita disposable income of rural residents (R13) | Reflecting the richness of farmers and residents’ wallets | Ma, 2019; Dong et al., 2020 | 0.05748 | ||
| Ownership of household cars among rural residents (R14) | Reflecting the modern lifestyle enjoyed by rural residents | Designed by the author | 0.06134 | |||
| Engel coefficient of rural residents (R15) | Total food expenditure of rural residents/total consumption expenditure of rural residents | Dong et al., 2020; Xiao et al., 2022 | 0.05896 | |||
| Rate of rural household access to piped water rate (R16) | Number of villagers using tap water/total number of villagers | Pang, 2019; Dong et al., 2020 | 0.06345 |
Table 2 Comprehensive development index of rural tourism and rural revitalization (2010-2019) |
| Index | 2010 | 2011 | 2012 | 2013 | 2014 | 2015 | 2016 | 2017 | 2018 | 2019 |
|---|---|---|---|---|---|---|---|---|---|---|
| Comprehensive Rural Tourism Index | 0.245 | 0.308 | 0.375 | 0.419 | 0.470 | 0.490 | 0.550 | 0.599 | 0.723 | 0.750 |
| Comprehensive Rural Revitalization Index | 0.079 | 0.206 | 0.261 | 0.266 | 0.392 | 0.472 | 0.578 | 0.713 | 0.788 | 0.912 |
| Relative Priority of Tourism Index | 3.10 | 1.50 | 1.44 | 1.58 | 1.20 | 1.04 | 0.95 | 0.84 | 0.92 | 0.82 |
Fig. 2 Dynamic evolution curve of coupling coordination of the rural tourism-rural revitalization system |
Table 3 Gray correlation analysis of the coupling degree, coupling coordination degree, and indicators of rural tourism and rural revitalization |
| Indicator | Coupling degree | Coupling coordination degree |
|---|---|---|
| Number of visitors for leisure agriculture and rural tourism (T1) | 0.5911 | 0.7178 |
| Income from leisure agriculture and rural tourism (T2) | 0.5486 | 0.6733 |
| Proportion of total tourism revenue to GDP (T3) | 0.5571 | 0.6740 |
| Number of scenic spots above A-Level (T4) | 0.5695 | 0.7143 |
| Number of national-level leisure agriculture and rural tourism demonstration sites (T5) | 0.6451 | 0.7618 |
| Number of five-star rural tourism areas (sites) (T6) | 0.5974 | 0.7497 |
| Number of star-rated rural homestays (farmhouses) (T7) | 0.6094 | 0.5751 |
| Urban-rural income ratio (T8) | 0.7556 | 0.7472 |
| Urbanization rate (T9) | 0.6161 | 0.5129 |
| Per capita tourism consumption expenditure (T10) | 0.6229 | 0.7362 |
| Local general public budget revenue (T11) | 0.6842 | 0.8418 |
| Number of homestay operators (T12) | 0.4764 | 0.5792 |
| Number of tourism enterprises (T13) | 0.5503 | 0.6614 |
| Level of satisfaction with rural tourism (T14) | 0.6578 | 0.8643 |
| Road network density (T15) | 0.7112 | 0.8128 |
Table 4 Gray correlation analysis of the coupling degree, coupling coordination degree, and indicators of rural revitalization |
| Indicator | Coupling degree | Coupling coordination degree |
|---|---|---|
| Integrated grain production capacity (R1) | 0.6363 | 0.7809 |
| Agricultural production conditions (R2) | 0.6619 | 0.8492 |
| Agricultural labor productivity (R3) | 0.5539 | 0.6681 |
| Processing rate of agricultural products (R4) | 0.6661 | 0.7605 |
| Rural online retail sales (R5) | 0.5022 | 0.5696 |
| Forest coverage rate (R6) | 0.6363 | 0.7809 |
| Greenery coverage rate of villages (R7) | 0.6246 | 0.7537 |
| Percentage of villages with waste management (R8) | 0.5616 | 0.6276 |
| Coverage rate of sanitary toilets in rural areas (R9) | 0.5756 | 0.6918 |
| Coverage rate of comprehensive cultural service centers in villages (R10) | 0.4930 | 0.5777 |
| Proportion of civilized villages and towns at the county level and above (R11) | 0.4862 | 0.5441 |
| Educational level of rural household leaders (R12) | 0.6448 | 0.6636 |
| Per capita disposable income of rural residents (R13) | 0.6007 | 0.7485 |
| Ownership of household cars among rural residents (R14) | 0.6271 | 0.7515 |
| Engel coefficient of rural residents (R15) | 0.7280 | 0.7583 |
| Rate of rural household access to piped water rate (R16) | 0.6045 | 0.7243 |
| [1] |
|
| [2] |
|
| [3] |
|
| [4] |
|
| [5] |
|
| [6] |
|
| [7] |
|
| [8] |
|
| [9] |
|
| [10] |
|
| [11] |
|
| [12] |
|
| [13] |
|
| [14] |
|
| [15] |
|
| [16] |
|
| [17] |
|
| [18] |
|
| [19] |
|
| [20] |
|
| [21] |
|
| [22] |
|
| [23] |
|
| [24] |
|
| [25] |
|
| [26] |
|
| [27] |
|
| [28] |
|
/
| 〈 |
|
〉 |