Ecotourism

The Rationality of the Spatial Layout of Beijing Sports Parks and the Evaluation of Tourism Experience Quality

  • ZHANG Youyin , 1 ,
  • XU Heng , 2, *
Expand
  • 1. School of Leisure Sports and Tourism, Beijing Sport University, Beijing 100084, China
  • 2. School of Urban Planning and Design, Peking University Shenzhen Graduate School, Shenzhen, Guangdong 518055, China
*XU Heng, E-mail:

ZHANG Youyin, E-mail:

Received date: 2022-09-05

  Accepted date: 2023-01-30

  Online published: 2024-03-14

Supported by

The Central University Project Fund(2021TD009)

Abstract

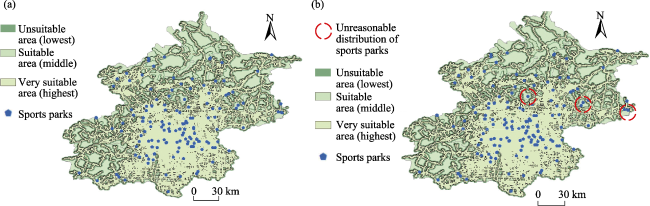
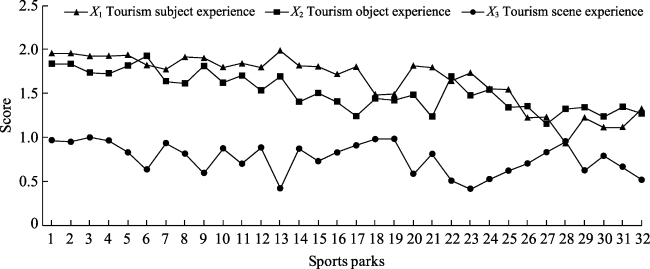
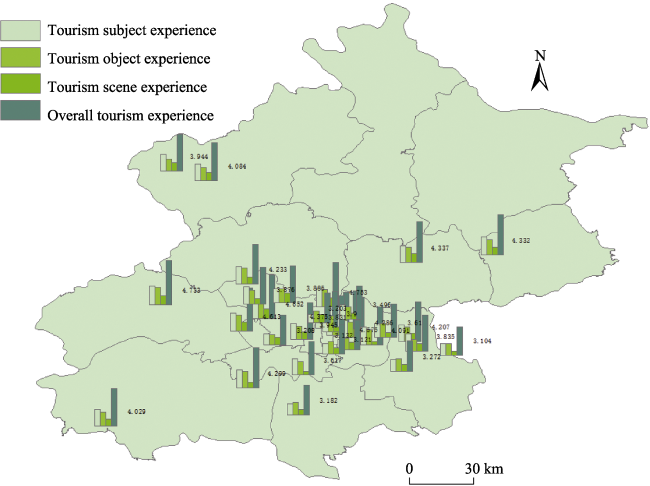
Based on big data such as POI and tourism online reviews, the spatial distribution characteristics, distribution rationality and evaluation of the tourism experience quality of Beijing sports parks were explored by comprehensively using AHP analysis, GIS spatial analysis and other methods. The results show four important points. (1) From the perspective of overall spatial distribution rationality, the overall location distribution of the Beijing sports park layout is reasonable, but there are deviations and inappropriate distributions in local areas, showing a trend of regional tilt to the middle and North. The unsuitable areas for local distribution are mainly concentrated in the central and eastern regions, which are distributed in a state of “three scattered points”. (2) The evaluation system was constructed from the three dimensions of tourism subject, tourism object and tourism scene, and the evaluation index system for sports park tourism experience quality including three first-class indicators and 17 second-class indicators was established. (3) At present, the overall level of experience quality of sports parks in Beijing is relatively weak, since it was rated only at the level of good, so there is still a certain gap from the level of satisfaction. (4) The indicators of tourism experience quality at all levels are densely distributed, mainly in the main urban areas and southern areas of Beijing. Among the points at all levels, the experience of tourism objects is the most dispersed, the experience of tourism subjects is moderately distributed, and the experience of tourism scenes is the most concentrated. Finally, according to the spatial distribution characteristics and the evaluation of tourism experience quality, an optimization path of sports parks is constructed, and targeted suggestions are provided for the reasonable layout of sports parks and the improvement of tourist satisfaction.

Cite this article

ZHANG Youyin , XU Heng . The Rationality of the Spatial Layout of Beijing Sports Parks and the Evaluation of Tourism Experience Quality[J]. Journal of Resources and Ecology, 2024 , 15(2) : 496 -409 . DOI: 10.5814/j.issn.1674-764x.2024.02.024

1 Introduction

Chinese govenment incorporated ecological progress into the five-sphere integrated overall plan for the cause of socialism with Chinese characteristics. With the policy that clear waters and green mountains are as good as mountains of gold and silver, the ecological recreation space is not only an important carrier for promoting local ecological civilization construction, but also an important indicator for measuring the transformation of tourism toward green, ecological and sustainable development (Wang et al., 2020). The tourism infrastructure service facility is a public service system that is used to ensure the normal operation of ecotourism activities, which is of great significance for the development of ecotourism (Tang et al., 2022). As human society has entered a fast-paced and efficient information age, comprehensive social problems such as the decline of the population and physical fitness and ecological environmental damage are intensifying. People are also paying more attention to health issues, and the concept of the healthy city came into being. Sports parks have the dual advantages of simultaneously meeting people’s daily fitness and ornamental leisure needs, and now they have become a new direction of park green space construction in various major cities throughout China.
The sports park refers to a special park with stadiums, cultural and educational buildings, and service buildings set up in a large area of green space that can allow citizens to exercise, visit and rest, or it can be used for sports competitions. The difference between sports parks and general sports venues is that the former have a large area of landscaping, can provide citizens with diversified sports services, and have certain functions of sightseeing and recreation. They are an important part of the ecological recreation space (Xu et al., 2015). Seven ministries and commissions, including the National Development and Reform Commission, the General Administration of Sport and the Ministry of Natural Resources, jointly issued the Guiding Opinions on Promoting the Construction of Sports Parks, have particularly emphasized that the construction of sports parks should have a clear direction, and an open sports park should be built with green as the background, integrated with natural ecology, and organically embedded with green space for fitness facilities. Sports parks have the dual advantages of meeting people's daily fitness and viewing leisure needs at the same time. At present, they have become the new direction of park green space construction in major cities all across China.
During the period of “the 14th Five-Year Plan (2021-2025)”, the construction of sports facilities and spaces in China, such as large stadium (exceeding 20000 seats), large gymnasiums (exceeding 3000 seats), and outdoor fitness venues (exceeding 1500 seats), has been growing, and the State Physical Culture Administration has documented the new reconstruction of more than 1000 sports parks (Du, 2022; You, 2022). The concept of the sports park has gone through a process of development and evolution. The United States, Canada and other North American countries initially set up parks in cities in order to introduce rural landscapes into the cities, beautify the urban environment, and make parks the breathing space of the cities. In the early days, parks only provided passive entertainment for viewing. Later, at the end of the 20th century, the concept of sports parks gradually developed in European and American countries to have dual functions of driving the local economy and increasing the residents' sports and fitness, taking on the ecological and seasonal characteristics as the important design principles of sports parks. However, compared with western developed countries, the scale of sports park construction in China is still insufficient, and the imbalance between supply and demand between urban and rural areas is still serious. Therefore, optimizing the construction and layout of sports parks are the key issues in the research and practice of sports and ecology in the new era (Chen and Zhang, 2010).
At present, many countries in the world are developing sports parks on a large scale, such as Central Park in New York, USA and Central Stadium in Moscow, Russia. Almost all the local government agencies in western developed countries have functional departments of parks and leisure committee members, which manage the sports parks of large, medium and small scales to meet the various sports needs of residents to the greatest extent. Research on the rationality of the distribution of sports parks is also relatively mature. Through reviews of the foreign literature, this research has been found to focus on the scientific and sustainable development of park construction (Dai et al., 2019; Sun et al., 2022), market-oriented operation of the sports parks (Li, 2020), sports park landscape ecological planning (Martin, 2020), and other topics. In contrast, the construction of domestic sports parks started late in China, the progress of theoretical research is lagging behind, the existing research on sports park definition and classification is diverse with no unified conclusions, and most researchers think of sports parks with sports as the core of the outdoor recreation space. The current research is concentrated on its future development direction, development potential, operation management, development mode, architectural design, etc. (Zhang and Pan, 2011; Zhang and Jing, 2013; Li, 2021; Song and Huang, 2022; Yuan et al., 2022). Some scholars have also explored the spatial distribution characteristics of sports parks. For example, Zeng and Zuo (2022) has analyzed the spatial distribution pattern of the coordinate data points of national sports parks, and Ye and Pan (2019) has studied the evolution of the sports park model and the development of the spatial system.
On the whole, a comprehensive perspective shows that the content and perspective of the existing research are limited. Most studies are based on economic management, physical medicine, spatial design and other analysis angles. Although a few studies have considered the geographical spatial distribution, the spatial scale of such research is mostly limited to the national macro scale. There is a lack of systematic analysis of the spatial distribution patterns of sports parks from the micro level, such as the city or community, and a lack of clear classification standards for the types of sports parks (Li et al., 2016). Similarly, there are obvious differences and no unified guidance in the research on the rational construction and development paths of sports parks, and few scholars have conducted preliminary spatial distribution analyses on sports parks, especially on the rationality of distribution. Therefore, based on this new research perspective, the research on the spatial distribution and rationality of sports parks needs to be further expanded.
Furthermore, on the basis of ensuring reasonable site selection and layout, the operation and management of sports parks should also pay attention to the quality and satisfaction of the tourists’ tourism experience (Sun et al., 2018). Specifically, the evaluation of tourism experience quality is a measure of the accumulated psychological emotions of tourists, and the scientific and accurate accounting of tourist experience quality is an important guarantee for the sustainable development of tourist attractions and tourism enterprises and for improving their competitiveness. The current systems for the research and evaluation of the quality of tourism experience in sports parks is not perfect and relatively limited (Xiao et al., 2019).
Therefore, this study used Beijing as an example, and the AHP method, average nearest neighbor method and nuclear density analysis to assess its urban sports park spatial distribution and characteristics, and the rationality of its spatial distribution. Then, the tourism experience quality concept framework was used to build a full-dimensional sports park tourism experience evaluation system. Finally, a review of tourism network big data samples was used to provide a scientific reference for measuring the Beijing sports park quality upgrade, spatial layout optimization and tourism service competitiveness.

2 Data and research methods

2.1 Research area

Beijing is the capital, a municipality directly under the Central Government, national central city, national political center, cultural center, international communication center, science and technology innovation center and a comprehensive transportation hub. As early as 2018, Beijing proposed the development idea of jointly building and sharing sports venues, enriching the sports space, and improving sports infrastructure, venues and other conditions (Chen et al., 2014). Therefore, the selection of Beijing for this study has a certain rationality. In recent years, Beijing has promoted the construction of a number of key parks, built a number of representative sports parks, and encouraged the integrated development of various public facilities and sports facilities. The Special Plan for Sports Facilities in Beijing (2018-2035) incorporates the construction of public sports facilities into the national land space planning in order to promote the balanced development of public sports facilities. Beijing will also promote the construction of a number of key sports parks and increase public sports facilities. Therefore, it is representative to choose Beijing sports parks for this analysis.

2.2 Research methods

2.2.1 AHP analysis method

AHP is a systematic and hierarchical decision-making method that combines qualitative and quantitative methods, and it has been widely used in site selection, resource allocation, and evaluation (Zhang et al., 2019). The selection of indicators should be based on the specific site selection problem or expert experience, then the index system should be established, and finally, the weight of each index influencing site selection should be calculated through evaluation by experts. This study combined population, transportation, the geographical environment and other factors, applied the AHP method to determine the indicators, and analyzed the rationality of the distribution of sports parks in Beijing. This process was accomplished through three steps. Firstly, by reading relevant literature and asking experts to give scores, the core influencing factors affecting the distribution of sports parks were determined and the hierarchical structure was established. Secondly, the results of the model and expert judgment were combined, the judgment matrix of each level element was constructed, and the indexes were quantified. Thirdly, the relative weights and combination weights were calculated (Yuan et al., 2015).

2.2.2 The ArcGIS spatial analysis method

Based on the ArcGIS 10.2 geographic information system analysis platform and taking the site selection of Beijing Sports Park as an example, the GIS spatial analysis method (spatial autocorrelation analysis, buffer zone analysis and spatial superposition analysis, etc.) was comprehensively used to establish a spatial factor analysis model. By assigning a weight value of each index, the suitability area established by Beijing Sports Park was finally calculated. The specific process is shown in Fig. 1.
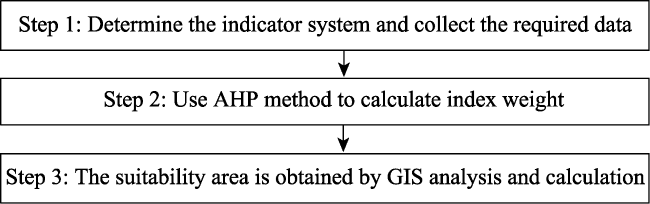
Fig. 1 Basic procedures of the research

2.2.3 Semantic and emotional analysis

The semantic network is a method of social network analysis, which is composed of a large number of common-sense ideas and concepts. Users make use of blogs and other network media platforms to build the contact networks with social media tools. They identify the connections between the evaluation subject and the comment subject through the semantic network (Song et al., 2006; Sun et al., 2018). In this study, the positive and negative emotional words were first divided in Chinese, and two high-frequency words with different emotions were extracted. Then, the semantic network relationship between the two different high frequency words was studied, and finally the row features were extracted to build the semantic network, thus generating two semantic sets of positive and negative emotions, and assigning the values. The ROST-CM6 software was used to realize the quantitative analysis of the semantic network graph (Song et al., 2006).

2.2.4 Multi-objective linear weighted function method

On the basis of the analysis method above, the quality of tourism experience for each influence factor was quantified with the help of the Linket-5 scale. For example, Beijing Xishan National Forest Park has very good scenery, pavilions, lakes and mountains (natural environment, 4 points), it is suitable for couples (tourism social interaction, 4 points), it is very large (scale, 4 points), etc. In order to comprehensively and objectively evaluate the quality of tourism and experience of the sports parks, the entropy method was used to objectively empower the data based on the performance of the influence factors. The specific steps are described by Wang et al. (2013). On the basis of determining the index weights and index assignments, the multi-objective linear weighted function method was adopted to evaluate the tourism experience quality of 32 Beijing sports parks. The evaluation results range from 0~5 points, and the calculation formula is:
Y g = j = 1 6 P g j × W j
where, Yg is the tourism experience quality of sports park g, Wj is the weight of secondary index Xij, and Pgj is the performance of secondary index Xij of sports park g. The point worth noting is the letter i represents the coefficient of the first-level indicator, while j represents the coefficient of the second-level indicator. Xij represents the second-level indicator (such as X12 in Table 3, where i=1 represents subject of tourism, and j=2 represents participation).

2.3 Data sources and processing

2.3.1 Spatial data sources

For the spatially distributed feature data, this study mainly used the big data and small data combination mode. Sports park big data came from the capture of POI data. Based on the authority of the selection organization, data availability and its influence, the sports park directory data came from the coordinate points of the map API data open platform; the project types of each sports park mainly came from the names and coordinate points of “Beijing Sports Park”; and the small data of sports parks came from the official website of government departments and the Grade A sports park directory with statistical caliber. The spatial data came from the map of Beijing in the national vector map of 14000 of the National Basic Geographic Information System database. The comprehensive scope of the data fully ensures the comprehensiveness, rationality, authenticity and reliability of the data.
For the data cleaning of the big data portion, there is a large volume data for the sports parks on the Gaode data open platform. These data may have some errors due to equipment accuracy and other problems, which will cause a certain amount of interference in the attribute division. To ensure the accuracy of the study results, four steps of initial quality control were taken before the data analysis.
(1) Remove both invalid data and non-standard data, such as sporting goods stores, tobacco and alcohol stores, Internet cafes, cinemas, amusement parks, restaurants, beauty salons, flower, bird, fish and insect markets, and other keywords due to the system instability for the capture of other keyword data.
(2) Remove the coordinate points for duplicate records. Records with the same latitude and longitude coordinates are considered to be repeat records, and only one of them was retained, while all the others were deleted.
(3) Employ keyword algorithm screening, compile clear keyword screening criteria, classify crawling data, and eliminate irrelevant data.
(4) Conduct filters and checks one by one to ensure that all the climbing data belong to the sports park. The big data were combined with the small data component, the size data was merged, through the small data comparison, and the big data induction and integration, and finally the POI point set of Beijing Sports Park was obtained. This dataset included 136 POI points for sports parks, with 96 considered as valid after cleaning and merging the data.

2.3.2 Some comments on the data source

Tourism network evaluation represents the “post-travel feeling”, which is about the restoration of the tourism itinerary and situation. By mining the tourism network evaluation data, researchers can mathematically analyze the tourist perception and tourism situation that were previously difficult to quantify (Zhen et al., 2015). Based on the 96 sports parks identified above, 32 of them were selected (the one-third with representative data). Based on data collection methods (Xu et al., 2015), the TOP 3 online media social networking sites of Weibo, Hornet’s Nest and Tuniu ranked highest in the number of Chinese users in July 2022, so they were used as the data sources (Qin and Zhu, 2014). The above 32 sports parks were searched one by one, and the comment data from January 1, 2018 to July 27, 2022 were obtained. After deleting the false publicity comments, each sports park had no less than 600 valid comments, with a total of 19000 valid comments and a total of 230000 words collected.

3 Analysis of the spatial pattern

The sports park refers to an open sports-themed leisure and ecological park that integrates ecological functions, sports competitions, sports training, performance, fitness, entertainment and leisure, tourism and recreation, and also integrates sports commerce and sports technology. It is an important part of the ecological recreation space (Wang and Zhou, 2019). At the same time, it is also a material carrier for leisure tourism, sports training, outdoor recreation and viewing competitions (Jing et al., 2020). However, due to the lack of systematic research on the classification of sports parks in China, many problems have arisen, such as blind construction, repeated construction, low utilization rate, etc. of sports parks. A clear statistical caliber determination of the sports park is conducive to the subsequent spatial distribution, and quality evaluation and analysis. This will allow a better understanding of the value of the sports park construction, so as to correctly grasp the direction of the sports park construction and layout, and to provide a theoretical guarantee for the sustainable development of the sports park (Zhang et al., 2019). The types of sports parks in this study mainly covered the levels shown in Table 1.
Table 1 Sources of attribute information for the sports parks
Classification basis Statistical caliber source Sports parks cover metrics
Nature of the construction use Gaud API
Data open platform
(1) A sports park built to undertake major events
(2) A sports park directly transformed from a sports center
(3) A sports park specifically built for public sports and fitness activities
Administrative area The Beijing municipal government
Department directory
(1) Community-level sports park
(2) County sports park
(3) Municipal comprehensive sports park
(4) Regional type (provincial or cross-provincial) of sports park circle
Sports park evaluation grade Beijing class A sports parks directory and other directories (1) Class A scenic spot parks (including fitness areas)
(2) Non-A level scenic area parks (with fitness areas)

3.1 Overall distribution characteristics

The overall distribution of sports parks in Beijing shows characteristics of “intermediate agglomeration and scattered around” (Fig. 2). The number of sports parks in the central city is more concentrated in the distribution, while in the surrounding municipal districts (such as Fangshan, Huairou, etc.) the density is lower, and the distribution is scattered. According to the analysis results of spatial cold and hot spots, the heat point in the eastern region is higher, while the hot spots in the central and western regions are low or not related. In addition, the Moran index was calculated, and the results showed a clustered distribution (Z=38.397334, P<0.001, Moran’s I=0.128986, Variance=0.000013), so the Beijing sports parks show a clustered distribution.
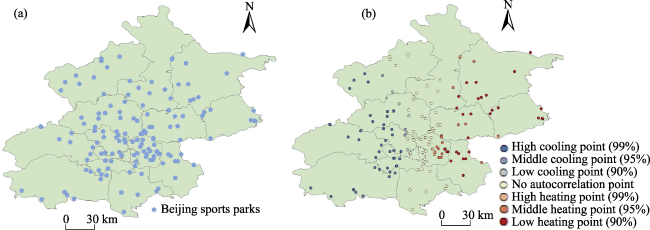
Fig. 2 Spatial distribution of sports parks in Beijing

3.2 Rational analysis of the spatial distribution

As a basic factor affecting the layout of sports parks, the natural ecological environment, mainly including river, terrain and other conditions, has a significant impact on the distribution of sports parks. With the “two mountains theory” put forward, the construction of ecological recreation space is in full swing, and the natural ecological environmental factors also have a very important impact on the location and development of sports park spatial layout. Social factors are also important indicators that affect the layout of sports parks. Economic location conditions affect the economic benefits and sustainable and healthy development of sports parks, mainly including traffic facilities and other major factors. The large population density, rich products and high level of economic development have laid the foundation and created a good economic and market environment for the germination and development of sports parks. Whether in the historical period or now, urban residents are the main consumer group in the industrial and commercial markets, indicating that sports parks that are closely related to residents’ lives constitute the main types of daily consumption, which is of great significance to the spatial layout of sports parks.
According to the analyzed site selection principle and influencing factors, the specific operation process for generating grading results is shown in Fig. 3. The judgment matrix is mainly obtained by comparing the influences of various factors at the same level on the related factors in the previous layer. The process basically follows three steps. Firstly, 10 experts evaluate the criterion layer, and obtain the relative weights of the criteria. Secondly, by analyzing the importance of the same layer of factors to the previous layer of phase criteria, the relative weight of each decision factor is obtained. Thirdly, after the consistency standard is reached, the average of each expert’s ranking weight is calculated as the final index weight in the group decision. The final weight results of each index are: residential area (0.0927), road (0.3491), parking lot (0.0819), cultural attractions (0.0399), surface water (0.1790), and terrain (0.2574). According to the data required by the above evaluation indicators, the data of Beijing settlements, existing sports park data, parking lot spatial distribution data, and traffic and road spatial distribution data were selected for studying the site selection of sports parks (Ma and Sun, 2010; Zhang et al., 2020). Based on the availability and representativeness of the comprehensive data, in addition to the five factors listed, other factors (such as proximity, private income level, etc.) will also affect the distribution of sports parks, but no more will be listed here.
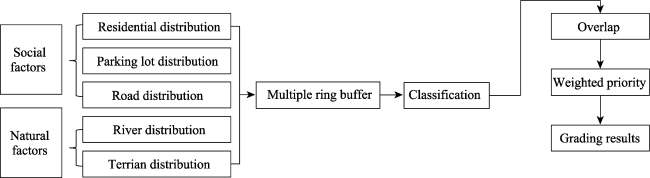
Fig. 3 GIS operation process
By means of distance analysis, buffer analysis and point density analysis, the influence of each factor was expressed using GIS vector data. Three regions were buffered from the various data respectively, and the score values of 30, 20 and 10 were assigned respectively to obtain the hierarchical map of each factor. Because the importance levels of the different indicators that actually affect the location of sports parks are different, the data cannot be calculated directly as combined by GIS, which is the reason for also using the hierarchical analysis method in this study. Using the superposition function of GIS, each weight obtained through AHP was assigned to the various factors in the map respectively. The analysis was based on the data in Table 2, and the regional superposition results were finally obtained.
Table 2 Information of the analyzing index variables
Metric Grading values Weighted value
Residential quarter Distance classification: x≤3000 m: 30;
3000 m <x<6000 m: 20; x≥6000 m: 10
0.0927
Road Distance classification: x≤500 m: 30; 500 m <x≤1000 m: 20; 1000 m<x≤1500 m: 10 0.3491
Depot Distance classification: x≤500 m: 30; 500 m <x≤1000 m: 20; 1000 m<x≤1500 m: 10 0.0819
Surface water (River) Distance classification: x≤500 m: 30; 500 m <x≤1000 m: 20; 1000 m<x≤1500 m: 10 0.1790
Topography Slope classification: x≤8.55°: 30; 8.55°<x<22.73°: 20; x≥22.73°: 10 0.2973
By analyzing the spatial distribution of the element layer buffer zones of appropriate sports parks according to the index information, the buffer zones of residential areas, roads and parking lots mainly refer to the “2021 National Fitness Site Construction and Service Standards”. The classification of the river buffer zone mainly refers to the Site Selection and Construction Standard of Outdoor Sports Places. The topography and landform mainly refer to the Construction Standard of Nature Reserve Project (Construction Standard 2020). The final result scores are respectively represented as: appropriate area (30 points), restricted area (20 points), and unsuitable area (10 points), which are denoted in different colors. The five maps in Fig. 4 show the influences of surface water, residential area, parking lot, road, and terrain.
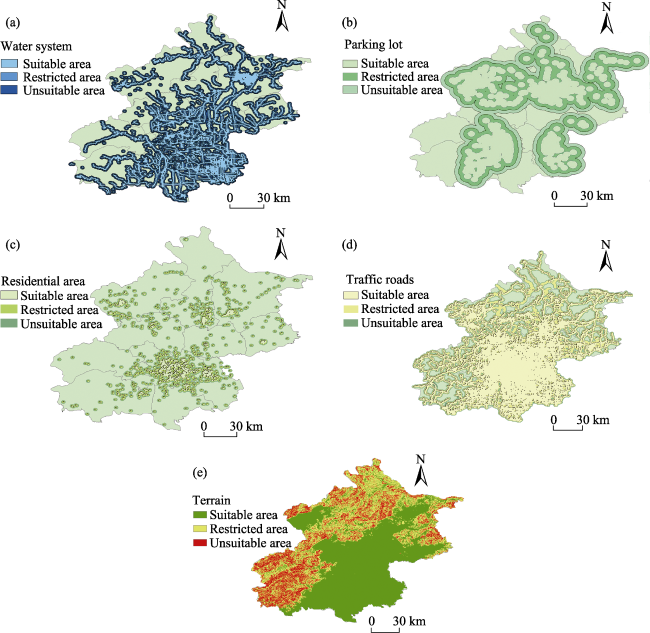
Fig. 4 Factors influencing the distribution of sports parks
The next step was to create all layer superposition and obtain a new layer analysis. The new layer contains all the location factor layer attribute information, so superposition will produce valuable new information. All of the natural environmental factors, social factors, traffic factors, demographic factors were incorporated into the superposition analysis tools, and mainly summarized into three types of area: Very suitable area (superposition value maximum 21 points), suitable area (superposition value medium 18 points), and not suitable area (superposition value minimum 14 points). The appropriate distribution area after stacking was compared with the distribution of the built sports park, which contains the overlapping layer attribute information and the sports park attribute information (Fig. 5). The current Beijing sports park was found to have the following three layout characteristics.
Fig. 5 Factors influencing the distribution overlay map of sports parks and unreasonable areas
Firstly, the overall layout of the site selection and distribution is reasonable. Most sports parks are located in the “very suitable area”, while a few sports parks are located in the “suitable area”, but some sports parks are located in the “not suitable area”. Secondly, suitability for the layout position is mainly concentrated in the central, southern, and southeastern areas of Beijing, as well as parts of the southwestern and northeastern regions, considering that the current Beijing sports park layout is concentrated in the central and northern areas. Therefore, the future of sports park construction should be considered for the southern area, and located in the illustrated “very suitable area”. Thirdly, the unsuitable area shows an overall trend towards the central and northern tilt. Locally unsuitable areas are mainly concentrated in the central and eastern regions, and are distributed as scattered points (Fig. 5).

4 Quality evaluation

4.1 The tourism experience quality evaluation index system

Determining the factors that influence the spatial distribution of Beijing sports parks and its rationality is conducive to the initial site selection and layout. In order to ensure reasonable site selection and layout, sports parks should pay attention to the sense of quality and satisfaction among tourists. The rationality of spatial distribution and the effectiveness of spatial operation are the two key problems facing the ecological recreation space that is represented by sports parks.
Tourism experience quality refers to the resulting feeling obtained by tourists in the tourism world when they are deeply integrated with their current situation, which is manifested as the degree of satisfaction of their tourism needs and the evaluation of the accumulated emotion of tourism psychology. The quality of the tourism experience directly affects the tourists’ willingness to revisit and recommend a destination or activity (Huang et al., 2017). This study considered the existing measurement indicators of tourism experience quality and service quality, and chose indicators based on the theory of “expectation perceived performance difference”. Combining this with the existing research on tourism experience quality, the factors influencing tourism experience quality were classified into three dimensions: tourism subject factor, tourism object factor and tourism situation factor. In the Beijing sports parks, the high-frequency vocabulary terms were extracted for interpretation and classification. According to the four main principles of “combination of scientificity and collectability”, “combination of conciseness and comparability”, “combination of characteristics and general indicators”, and “combination of hierarchy and systematic hierarchy”, mature references are also cited (Li et al., 2006). Moreover, the 17 influencing factors were extracted and classified by the above three dimensions. On this basis, a sports park tourism experience quality evaluation index system that includes three first-level indicators and 17 second-level indicators was finally established.

4.2 Evaluation and measurement of tourism experience quality

4.2.1 Global analysis

The quality of the tourism experience was measured for 32 sports parks in Beijing (Table 4). According to the comprehensive score, the tourism experience quality is divided into five levels: A excellent (4.51-5.00 points), B satisfied (4.01-4.50 points), C good (3.51-4.00 points), D qualified (3.01-3.51 points), and E unsatisfactory (less than 3 points).
Table 3 Evaluation index system of tourism experience quality in sports parks
Level I indicator [weight] Secondary index [weight]
X11 Sense of place (refers to the local identity and local dependence generated by the tourists in the process of tourism, and the tourists’ emotional perception, functional association and special feeling of the material environment of the sports park) [0.0803]
X12 Participation (refers to the time and energy spent by tourists in the process of tourism, which is manifested in the initiative, sustainability, and integration of participating in various sports projects, leisure and entertainment activities) [0.0542]
Tourism subject X1
[0.4052]
X13 Cultural real perception (refers to the tourists’ perception of the realistic “appearance” and “texture” of the material carrier, which is the result of the mutual verification of tourists' expectations, preferences and park publicity) [0.0653]
X14 Attraction experience (refers to the perception of the tourism attraction ability of the whole sports park, which is the tangible product and intangible service that can encourage tourists to visit the sports park) [0.0525]
X15 Waiting experience (refers to the tourists’ perception of the objective waiting time, psychological waiting time, queuing order, and effective experience time in the sports field, sports experience items, or other activities) [0.0621]
X16 Entertainment value (refers to the fact that sports parks are the main places of leisure and entertainment for urban residents. It provides residents with the possibility of a large number of outdoor recreational activities and serves the main function of meeting the needs of urban residents for leisure and recreation activities. Tourists feel relaxed and mentally happy by visiting sports parks, enjoying sports facilities and participating in various sports activities) [0.0908]
X21 Safety guarantee (refers to the degree of safety importance shown in various safety assurance details or characteristics in the sports park, which is reflected in improving the emergency plan for emergency practice in the park, doing a good job in safety assistance, strengthening security forces, strengthening daily prevention and control measures, and implementing responsibility rules and regulations to ensure the safety of tourists) [0.1112]
X22 Scale (refers to the volume of a sports park, which covers the land area, reception capacity, number of service personnel, total play time, and amusement facilities) [0.0409]
Tourism object X2
[0.3884]
X23 Popularity (refers to the extent that the reputation of a sports park is known to tourists, showing whether the level of the sports park and the city status of the sports park accord with the expectations of tourists) [0.0535]
X24 Tourism assistance (refers to the conditions that are necessary to ensure the normal operation of the sports park, manifested in the degree of transportation, catering and shopping to satisfy tourist satisfaction) [0.0399]
X25 Service management (refers to the service quality management for the purpose of exceeding customer expectations, manifested as the degree of sports park service personnel, service process and service results to ensure tourist satisfaction) [0.0201]
X26 Sports park positioning (refers to the positioning of the sports park for tourists’ consumption preferences in the target market, which is suitable for family members, lovers, friends, classmates, colleagues and other group tourism) [0.0328]


X31 Tourist reception volume (also called tourism reception capacity, which refers to the scale and number of tourists that a country, region or department can accept in a certain period according to the standard. The number of people who visit the scenic spot at the same time, which is reflected in the degree of tourism congestion, and popularity, including at least the following aspects: Hotel reception capacity; transportation capacity; supply capacity of various tourism materials; supply capacity of energy required by tourism; capacity of tourist spots; supporting capacity of public facilities, etc.) [0.0363]
X32 Tourism order (refers to the working state in the operation of the sports park) [0.0386]
Tourism scene X3
[0.2064]
X33 Tour route arrangement (refers to the route followed by the tourists from entering to leaving the scenic spots, which shows the sequence of the tour and the rationality of the spatial layout of the scenic spots) [0.04342]
X34 Atmosphere (refers to the atmosphere surrounding the sports park, which creates the integrity, unity of the theme through architectural style, catering culture, festival activities, logo interpretation, etc.) [0.03361]
X35 Natural environment (refers to the natural geographical environment in which the sports park is located, which is reflected in the green vegetation, hydrology, climate and air quality of the sports park; relative to the social environment, it is the sum of all naturally formed materials and energies that directly or indirectly affect human beings) [0.04447]
Table 4 The scores and ranking of tourism experience for 32 sports parks in Beijing
Sports park X1 X2 X3 Y Sort Grade
The Olympic Forest Park 1.955 1.834 0.964 4.753 1 A
The Moon Bay Camping Base 1.955 1.833 0.945 4.733 2 A
Beijing Xishan National Forest Park-Fitness Area 1.922 1.735 0.995 4.652 3 A
Beigong National Forest Park-Fitness District 1.925 1.727 0.961 4.613 4 A
Workers’ Stadium Outdoor Field 1.936 1.814 0.825 4.575 5 A
Chaoyang Park 1.819 1.924 0.632 4.375 6 B
Shunyi Olympic Water Park 1.770 1.636 0.931 4.337 7 B
Beijing Youth Outdoor Sports Camp 1.910 1.611 0.811 4.332 8 B
Qinglong Lake Park-Fitness Area 1.899 1.808 0.592 4.299 9 B
Red Scarf Park-Fitness Area 1.796 1.619 0.871 4.286 10 B
Daoxianghu Park-Fitness Area 1.838 1.699 0.696 4.233 11 B
Tongzhou Olympic Sports Park 1.795 1.531 0.881 4.207 12 B
Baihua Park Fitness area 1.985 1.690 0.416 4.091 13 B
East Lake Park-Fitness District 1.815 1.401 0.868 4.084 14 B
Qingjiang Kowloon Longtan Kaibu Ruishi Outdoor Development Park 1.803 1.501 0.725 4.029 15 B
Yuyuantan Park-Fitness Area 1.717 1.404 0.824 3.945 16 C
Wild Duck Lake National Wetland Park-Fitness Area 1.801 1.238 0.905 3.944 17 C
Youth Lake Park-Fitness District 1.486 1.438 0.976 3.900 18 C
Bowang Mountain Forest Park-Fitness Area 1.487 1.419 0.979 3.885 19 C
Hot Spring Ice and Snow Sports Park 1.813 1.481 0.582 3.876 20 C
Urban Green Heart Forest Sports Park 1.793 1.234 0.808 3.835 21 C
North Sea Park-Fitness Area 1.639 1.689 0.503 3.831 22 C
Xinghua Fitness Park 1.731 1.474 0.412 3.617 23 C
Changying Sports Park 1.549 1.540 0.521 3.610 24 C
Dashanzi Sports Park 1.542 1.337 0.617 3.496 25 D
Xing Wulin Village Sports Park 1.222 1.351 0.699 3.272 26 D
Five Fangyuan Sports Park 1.228 1.153 0.827 3.208 27 D
Maden Park-Fitness District 0.931 1.320 0.952 3.203 28 D
Zang Village Culture and Sports Park 1.223 1.338 0.621 3.182 29 D
Pingyuan Community Sports Park 1.113 1.233 0.786 3.132 30 D
Fangzhuang Sports Park 1.115 1.344 0.662 3.121 31 D
Li Tuan Sports Park 1.323 1.268 0.513 3.104 32 D
Overall, the sports park experience quality has an average measurement value of 3.93, or grade C, indicating a tourism experience of “good”. Among the individual parks, the tourism experience quality class A sports parks (i.e., tourism experience quality of “excellent”) include the Olympic Forest Park, Moon Bay Camping Base, Beijing Xishan National Forest Park, Beigong National Forest Park, and Workers’ Stadium Outdoor Field, totaling 5 parks, which account for 15.625% of the parks and have an average score of 4.6652. There are 10 class B sports parks (i.e., tourism experience of “satisfactory”), accounting for 31.250%, and their average value is 4.2273.
There are nine class C sports parks (i.e., tourism experience of “good”), accounting for 28.125%, with an average value of 3.827. There are eight class D sports parks (i.e., tourism experience quality is “qualified”), accounting for 25.000%, with an average value of 3.215. None of the sports parks have an experience quality less than 3.0 points (Fig. 6). The quality of the tourism experience presents the characteristics of a “uniform distribution” hierarchical structure.
Fig. 6 The scores of X1, X2, X3 for sports tourism in Beijing
At present, the overall level of the experience quality of sports parks in Beijing is relatively weak, at only a “good” level, so there is still a certain gap between them and the higher “satisfaction” level. Secondly, looking at individual sports parks, the top-ranked Olympic Forest Park and the sixth-ranked Chaoyang Park belong to different levels. Olympic Forest Park is classified as Grade A, while Chaoyang Park is classified as Grade B. This indicate that Chaoyang Park needs improvement in various aspects to reach the level of Olympic Forest Park. At the extremes, the score for the first Olympic Forest Park is 1.5 times the score for the last Li Tuan Sports Park. There are 17 sports parks with tourism experience quality comprehensive scores higher than the average, accounting for 53.13% of the parks, which shows that the Beijing sports park tourism experience quality is quite variable, but the tourism experience quality of “very satisfied” class A sports park is not very common.

4.2.2 Analysis of the first-level index scores

The score values for the three first-level indicators of tourism experience quality (X1, X2 and X3) were analyzed (Fig. 6). The advantages and disadvantages for the development of various sports parks were clarified, and the fundamental causes of the comprehensive evaluation results for the tourism experience quality of sports parks were further explored.
Tourism subject experience indicates that tourists actively construct the tourism object and tourism situation according to some needs, and internalize it into the value judgment and emotional experience of the tourism object and tourism situation (Li et al., 2006). Tourism subject experience quality is the core of tourism experience quality (Xiao et al., 2019). Overall, the highest score for the experience quality of tourism subjects is 1.985, the lowest score is 0.931, the average score is 1.651, and the overall equal difference distribution of this dimension score is significant. For the individual sports parks, the ones with scores of more than 1.900 are the Olympic Forest Park, the Moon Bay camping base, Beijing Xishan National Forest Park, Shunyi Olympic Water Park and seven others, accounting for 21.88%. There are 13 Sports parks with scores from 1.700 to 1.900, accounting for 40.63%; five sports parks with scores from 1.400 to 1.700, accounting for 15.62%; and seven sports parks with scores below 1.400 points, including Xing Wulin Village Sports Park, accounting for 21.87%. The distribution showed a “bimodal” type fluctuation.
Tourism object experience is the perception of the tourists’ objective carriers, such as scenic spots, facilities, activities and services of sports parks, which constitutes the cognitive basis for the quality of the tourism experience (Chen and Cai, 2012). Overall, the highest score of the tourist object experience quality is 1.924, the lowest score is 1.153, and the average score is 1.519. The overall difference distribution of this dimension score is not as significant as that of tourist subject experience above. For the individual sports parks, only one (Chaoyang Park) has a score above 1.900, accounting for 3.13%; six sports parks have scores of 1.700-1.900, accounting for 18.75%; 15 sports parks have scores of 1.400-1.700, accounting for 46.88%; and 10 sports parks have scores below 1.400 points, accounting for 31.24%. In general, the tourism object experience shows normal distribution characteristics.
Tourism scene experience is a blend of the “feeling” of the main body of tourism, and the “scene” of the tourism object, so the tourism scene experience is the adhesive and catalyst for the quality of tourism experience (Xiao et al., 2019). Overall, the highest score of tourism scene experience quality is 0.995, the lowest score is 0.412, and the average score is 0.759. The score of this dimension shows a certain volatility, indicating that the quality of the tourism scene experience in Beijing Sports Park is quite variable. For individual sports parks, there are 9 with scores above 0.900, accounting for 28.13%; 10 with scores of 0.700- 0.900, accounting for 31.24%; 13 with scores of 0.400- 0.700, accounting for 40.63%; and none with scores below 0.400. This tourism scene experience presents the structural characteristics of the rising type.

4.2.3 Distribution analysis of the first-level indicators

The analysis of the score spatial distribution of the three first-level indicators of tourism experience quality was conducted (Fig. 7) to clarify the advantages and disad-vantages of the distribution and service quality of sports parks, and further point out the future direction of spatial optimization of the sports parks.
Fig. 7 Geographical analysis of the scores of sports tourism indicators in sports parks
The spatial distribution of the scores of tourism subject experience is moderate in the three indicators, among which the highest score (1.900-2.026) is distributed along the east-west axis of Beijing, the second score (1.700-1.900) is distributed from north to south, and the third (1.400-1.700) and fourth scores (less than 1.400) are mainly distributed in the main urban areas of Beijing (i.e., main urban areas: Dongcheng District, Xicheng District, Chaoyang District, Haidian District, Fengtai District and Shijingshan District).
The spatial distribution of the tourism object experience is scattered among the three indicators, among which the highest score (1.900-1.943) is in Chaoyang District, showing a “single point” distribution. The second score (1.700-1.900) is mainly concentrated in the south-central region and the southwestern region. The third score (1.400-1.700) as well as the fourth score (less than 1.400) are very scattered in Beijing, mainly concentrated in the southern region.
For tourism scene experience, the scores of spatial distribution are the most concentrated in the three indicators, including the highest score (0.900-1.032) points with dense distribution, concentrated in Haidian district, Chaoyang district; the second score (0.790-0.900) is mainly concentrated in the central and eastern regions, and the third (1.400- 1.700) and fourth scores (less than 1.400) are distributed in the southern region of Beijing.
Overall, the tourism experience quality index distribution at all levels is dense, mainly concentrated in the southern part of Beijing, while each level index top score is mainly distributed in the main urban area (i.e., Dongcheng District, Xicheng District, Chaoyang District, Haidian District, Fengtai District and Shijingshan District). The measurement of the “tourism object experience” indicator is the most decentralized, the “tourism subject experience” is moderately distributed, and the “tourism scene experience” is the most centralized.

5 Discussion and conclusions

5.1 Discussion

As an important part of the ecological recreation space and the material carrier of the state’s development of the sports tourism industry, the sports park is of great practical significance for promoting the improvement of the urban ecological environment and the high-quality development of sports tourism. Future investigations can overcome the shortcomings of this study and carry out more in-depth research.
(1) As there are many factors affecting the site selection, the evaluation indicators of sports park site selection are very subdivided, so more reference indicators for site selection can be considered in future research to make the sports park site selection model universal. Through the investigation of more experts and ordinary people in the construction of sports parks, future research should also consider the opinions of upper decision-makers and the needs of the actual people. More reasonable construction of sports parks is the direction of future efforts.
(2) Regarding the tourism quality evaluation, future researchers can extend the scope to include more research destinations; analyze a time series year by year of the sports park tourism experience quality tracking evaluation; further study the driving mechanisms; extend the study to include comparative research at home and abroad; and conduct an analysis of temporal and spatial evolution at the national level.

5.2 Conclusions

From the perspective of the rationality of spatial distribution, the overlapping analysis results of the influencing factors of Beijing sports parks were compared with the distribution of existing sports parks, and the layout of Beijing sports parks presents three main characteristics.
(1) The overall site selection and distribution of the layout is reasonable. Most sports parks are located in the “very suitable area”, but a few sports parks are located in the “suitable area”, and some sports parks are located in the “not suitable area”.
(2) Deviations and inappropriate distributions occur in some local areas of the layout. The locations that are suitable for the layout of Beijing sports park are mainly concentrated in the central, southern and southeastern regions of Beijing, as well as parts of the southwestern and northeastern regions, while the current layout of Beijing sports parks is concentrated in the central and northern regions.
(3) The unsuitable parts tend to be in the central and northern areas. The unsuitable local distribution is mainly concentrated in the central and eastern regions, with a “three scattered spots” distribution.
Based on the conceptual framework of tourism experience quality, a full-dimensional evaluation system of sports park tourism experience was constructed. That system was used to analyze the measurements of Beijing sports parks based on a big data sample of tourism network evaluations, and four conclusions could be drawn.
(1) An evaluation system could be constructed from three dimensions: tourism subject, tourism object and tourism situation, and the established evaluation index system of sports park tourism experience quality included three first-level indicators and 17 second-level indicators.
(2) The Beijing sports park tourism experience quality shows differences overall, including sports parks with tourism experience quality levels of A, B, C, and D which account for 15.625%, 31.250%, 28.125%, and 25.000% of the parks, respectively. They present a “uniform distribution” of grade structure characteristics, and the grade quality spans significant differences. The current Beijing sports park experience quality level is relatively weak overall, being only at a “good” level, so there is a certain gap between the current level and the “satisfied” level.
(3) The experience quality of the tourism subject is significant, showing “bimodal” fluctuation distribution characteristics. Tourism object experience shows “normal” distribution characteristics, and tourism scene experience shows certain volatility, but mainly “rising” distribution characteristics.
(4) On the whole, the various indicators of tourism experience quality are densely distributed, mainly occurring in the main urban areas and southern areas of Beijing. Among the various points, the tourism object experience is the most scattered, while the tourism subject experience distribution is moderate, and the distribution of tourism scene experience is the most concentrated.

5.3 Suggestions

To address the site location problem, several development suggestions can be put forward from the perspective of the rationality of the spatial distribution. For areas that are unsuitable for the overall distribution, the future construction of Beijing sports parks can be considered for the southern region tilt. For sports parks located in unsuitable areas, field visits to each park can be conducted, to analyze the current development status and operation status of the parks. Thus, for their future development, they could consider the migration of site selection. They could also analyze the reasons for good operating benefits, and adjust the model construction based on the findings of this study. In order to better optimize the evaluation indicators of this study and provide a positive reference scheme for the development of the sports park, more sports parks to be built should be located in the very suitable area shown in the figures above.
For the evaluation of their tourism experience quality, the analyzed sports parks can find ways to improve their low scores from the three dimensions of main body experience, object experience and situational experience. Other sports parks can also improve their services and facilities for various indicators to improve the quality of the tourism experience in three ways. First, enhance the sense of place, participation, cultural reality, attraction experience, waiting experience, entertainment value, etc. of the tourism subject experience. Second, improve the security, scale, popularity, tourism assistance, service management, etc. of tourism objects. Third, enrich the satisfaction of the tourism scene and atmosphere. These steps would improve tourists' satisfaction with the quality of the tourism experience in an all-encompassing way.
In view of the future development trend and prospects of sports parks, sports parks integrate various functions such as physical exercise, leisure and entertainment, and ecological environment improvement, which can effectively improve the utilization of urban space and promote the improvement of residents’ quality of life. In the future, the construction of sports parks will reintegrate the urban sports industry and stadiums, strengthen the effective use of urban resources, and promote the improvement of urban functions, so as to drive the attraction of the surrounding areas, give play to the agglomeration benefits and scale benefits, and become a new growth point of the urban economy. The sports park will also fully reflect the concepts of “people-oriented” and “symbiosis” of humans and nature, and make efforts for the modernization, human culture and harmony of urban development.
[1]
Chen C, Xiu C L, Chen W, et al. 2014. Spatial distribution characteristics of place-name landscape based on GIS approach in Beijing and its reasons for the formation. Scientia Geographica Sinica, 34(4): 420-429. (in Chinese)

DOI

[2]
Chen D P, Zhang J. 2010. Research on the classification and sustainable development direction of sports parks. Journal of Xian Jiaotong University (Social Science Edition), 30(4): 58-60. (in Chinese)

[3]
Chen X E, Cai J M. 2012. On the collective relationship between the authenticity of tourism object and the authenticity of tourism subject—Taking the cultural heritage of the Forbidden Museum as an example. Human Geography, 27(4): 153-160. (in Chinese)

[4]
Dai P C, Zhang S L, Chen Z X, et al. 2019. Perceptions of cultural ecosystem services in urban parks based on social network data. Sustainability, 11(19): 53-86.

DOI

[5]
Du S H. 2022. The dilemma and optimization path of intelligent sports stadium construction under the vision of national fitness. Sports Culture Guide, (3): 45-51. (in Chinese)

[6]
Huang S, Li Y L, Dai P J. 2017. Evaluation of tourism competitiveness of smart tourism cities. Acta Geographica Sinica, 72(2): 242-255. (in Chinese)

[7]
Jing J Q, Zhang J, Zhang F. 2020. Design and analysis of urban national fitness engineering in the new era based on ecology horizon. Journal of Beijing Sport University, 43(8): 41-50. (in Chinese)

[8]
Li S G. 2020. An analysis of the value of sports park construction based on the concept of ocean ecological environment. Journal of Coastal Research, 104(4): 25-30.

[9]
Li S S, Wang X, Sun Q H. 2016. Investigation and analysis of the development status of Datong Sports Park. Contemporary Sports Technology, 6(14): 110-111. (in Chinese)

[10]
Li W M, Li J, Zhong Y D. 2006. Leisure is the only way to promote tourism, which is based on the vision of tourism subject, object and media. Tourism Journal, (9): 8-9. (in Chinese)

[11]
Li Y S. 2021. On the landscape design strategy of urban sports park. Environmental Engineering, 39(8): 272. (in Chinese)

[12]
Ma Y C, Sun J H. 2010. Design and development of urban sports facilities information system based on GIS technology. Journal of Beijing Sport University, 33(4): 27-30. (in Chinese)

[13]
Martin C. 2020. Design with nature now. Landscape Architecture Australia, 12(166): 20-25.

[14]
Qin X, Zhu S J. 2014. Research on the spatial distribution pattern of catering industry in Nanjing urban area based on network reputation—Taking dianping.com as an example. Scientia Geographica Sinica, 34(7): 810-817. (in Chinese)

[15]
Song T N, Huang J. 2022. Post-evaluation of urban sports parks based on the perspective of audience satisfaction. Journal of Shenyang Sports University, 41(1): 76-82. (in Chinese)

[16]
Song Z B, An Y M, Zheng P. 2006. Analysis on the topographic image of tourist destination, which takes the image perception of residents in Xi’an as an example. Tourism Journal, (10): 26-32. (in Chinese)

[17]
Sun X D, Ni R X. 2018. Product cognition, emotional expression and brand image perception of Chinese cruise tourists, which is a content analysis based on online comments. Geographical Research, 37(6): 1159-1180. (in Chinese)

[18]
Sun X L, Lin B, Gao J. 2018. Evaluation of tourism experience quality evaluation: Research progress, factor interpretation and outlook. Human Geography, 33(1): 143-151. (in Chinese)

[19]
Sun Y W, Tan S H, He Q X, et al. 2022. Influence mechanisms of community sports parks to enhance social interaction: A Bayesian belief network analysis. International Journal of Environmental Research and Public Health, 19(3): 1466. DOI: 10.3390/ijerph19031466.

[20]
Tang M G, Hu J, Lu L, et al. 2022. Spatiotemporal evolution characteristics of ecological recreation space and its driving factors in Guizhou Province. Journal of Ecology, (21): 1-11. (in Chinese)

[21]
Wang F X, Mao A H, Li H L, et al. 2013. Quality measurement and spatial difference analysis of urbanization in Shandong province based on entropy method. Scientia Geographica Sinica, 33(11): 1323-1329. (in Chinese)

[22]
Wang F Y, Wang K Y, Yu H, et al. 2020. Characteristics and associations of ecological recreation space in the Pearl River Delta urban agglomeration. Geographical Research, 39(9): 2148-2164. (in Chinese)

[23]
Wang X X, Zhou Y. 2019. Urban sports park development research—Taking the Jiangsu, Zhejiang and Shanghai regions as an example. Journal of Shandong University of Physical Education, 35(5): 49-55. (in Chinese)

[24]
Xiao N, Huang Y, Liu J S. 2019. Research on tourism experience quality evaluation and spatial differentiation characteristics of local sports parks in China. Scientia Geographica Sinica, 39(6): 978-986. (in Chinese)

DOI

[25]
Xu X B, Zhao L, Liu B Y, et al. 2015. Study on perceived image of Chinese tourist cities. Geographical Research, 34(7): 1367-1379. (in Chinese)

[26]
Ye Y, Pan S R. 2019. Research on the logic of sports parks based on competition, scenery and catalyst. Chinese Garden, 35(9): 62-66. (in Chinese)

[27]
You M L. 2022. The development strategy of urban sports field and facilities in China based on the 13th Five-Year Plan practice. Sports Culture Guide, (2): 56-62. (in Chinese)

[28]
Yuan J W, Xie X, Shen Y X. 2022. China’s urban sports park construction value, opportunity and practice paths. Sports Culture Guide, (5): 55-60, 74. (in Chinese)

[29]
Yuan W, Zhang J, Tan J Q, et al. 2015. The suitability spatial pattern of Langxiang Nature Reserve based on GIS. Chinese Journal of Applied Ecology, 26(9): 2785-2793. (in Chinese)

PMID

[30]
Zeng H F, Zuo Y F. 2022. Spatial distribution pattern and influencing factors of sports parks in China. Journal of Wuhan University of Sport, 56(4): 49-57. (in Chinese)

[31]
Zhang J, Pan P. 2011. Preliminary discussion on the development of sports parks in south China. Northern Gardening, (13): 102-105. (in Chinese)

[32]
Zhang J G, Wei W, Cheng Y Y, et al. 2020. Site selection study in small and medium-sized urban parks based on GIS suitability evaluation. Journal of Nanjing Forestry University (Natural Science Edition), 44(1): 171-178. (in Chinese)

[33]
Zhang S Y, Liu J M, Zhu H, et al. 2019. Research progress of urban ecological recreation space at home and abroad. Human Geography, 34(5): 15-25, 35. (in Chinese)

[34]
Zhang X L, Jing S H. 2013. The development context of urban sports park from the perspective of ecological needs. Chinese Garden, 29(5): 57-60. (in Chinese)

[35]
Zhen F, Qin X, Xi G L. 2015. An innovation in geography and human geography in the information age. Scientia Geographica Sinica, 35(1): 11-18. (in Chinese)

Outlines

/