Ecotourism

The Carbon Emission Characteristics of Tourism Scenic Spots in China: A Meta-analysis

  • FENG Wenjing , 1 ,
  • WEI Yunjie 2, 3 ,
  • KONG Lei 1 ,
  • LIU Minhua , 4, *
Expand
  • 1. School of Business, Beijing Technology and Business University, Beijing 100048, China
  • 2. Beijing Polytechnic College, Beijing 100042, China
  • 3. School of Economics, Beijing Technology and Business University, Beijing 100048, China
  • 4. Institute of Culture and Tourism Development of Beijing Technology and Business University, Beijing 100048, China
*LIU Minhua, E-mail:

FENG Wenjing, E-mail:

Received date: 2023-04-17

  Accepted date: 2023-10-30

  Online published: 2024-03-14

Supported by

The Beijing Postdoctoral Research Foundation(2021-ZZ-149)

Abstract

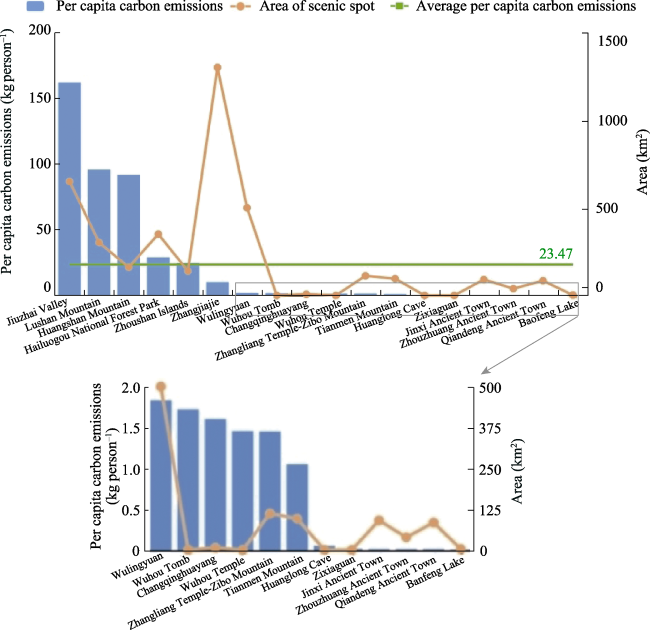
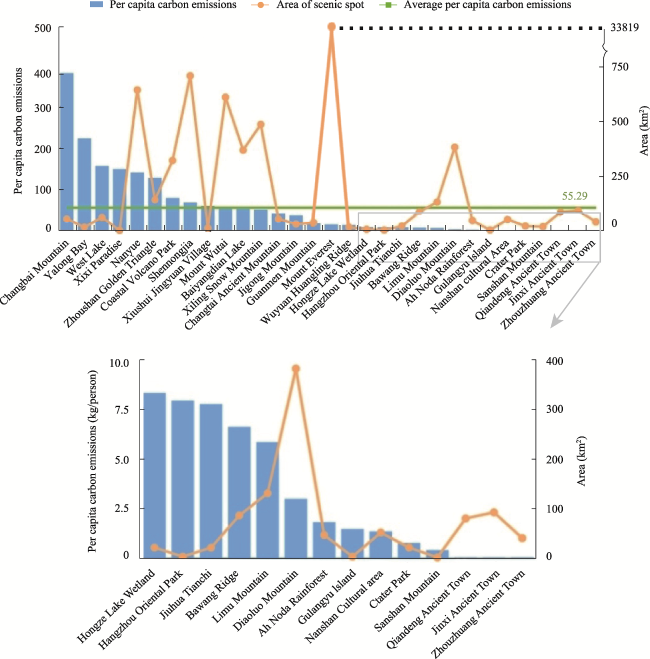
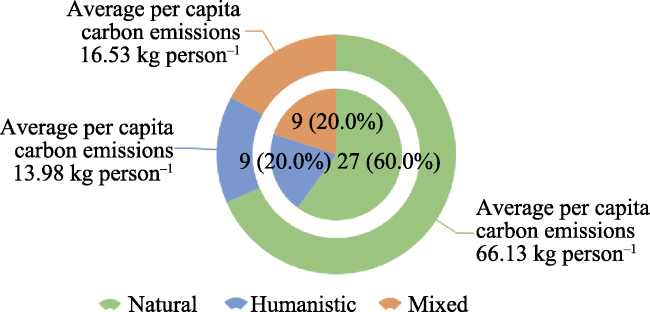
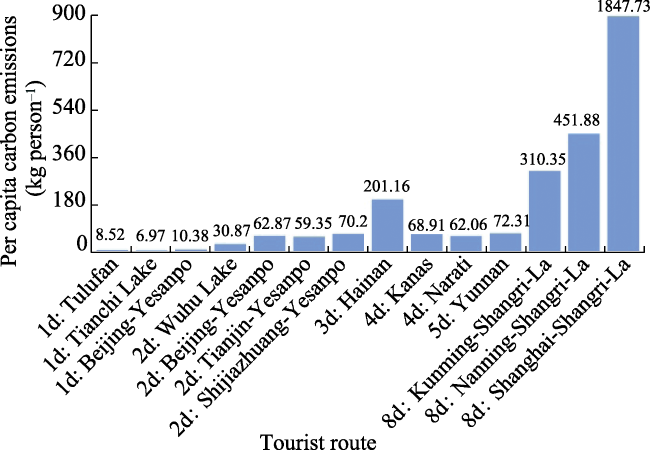
Tourism is an essential pillar to promote economic development. Under the context of “dual carbon” goal, which means the Chinese government delivery that China will reach peak CO2 emissions by 2030 and achieve carbon neutrality by 2060, the measurement of tourism carbon emissions facilitate preparation for carbon reduction work, and premise the development of sustainable tourism. In this study, based on existing studies, meta-analysis was used to extract relevant data of all studies on carbon emissions of domestic scenic spots before 2022, and visualized methods and SPSS correlation analysis were used to analyze the relationship between per capita carbon emissions of tourists of scenic spots and other variables of scenic spots. The results show that: (1) With the year 2010 as the node, the number of study areas and the per capita carbon emissions of tourists in the scenic spot show an increasing trend over time. Before 2010, the average per capita carbon emissions in the scenic spot was 23.47 kg person-1, and after 2010, it increased to 55.29 kg person-1; (2) Within different types of scenic spots, the per capita carbon emissions of tourists were ranked as follows: natural category > mixed category > humanistic category. The per capita carbon emission of natural scenic spots is the largest, which is 66.13 kg person-1; (3) By analyzing the factors affecting per capita carbon emissions, it is found that there is a significant positive correlation between per capita carbon emissions of tourists and the area of the scenic spots, whereby the larger the area of the scenic spots, the larger the per capita carbon emissions; (4) An increase in the number of days of tourist routes leads to a rise in per capita carbon emissions, and in this part of the research, the influence of the source of tourists, the type of hotels and the mode of transportation on per capita carbon emissions was studied.

Cite this article

FENG Wenjing , WEI Yunjie , KONG Lei , LIU Minhua . The Carbon Emission Characteristics of Tourism Scenic Spots in China: A Meta-analysis[J]. Journal of Resources and Ecology, 2024 , 15(2) : 464 -473 . DOI: 10.5814/j.issn.1674-764x.2024.02.021

1 Introduction

Tourism is no longer perceived as a “smoke-free industry” and has become one of the primary emission sources contributing to global climate change (Li et al., 2021). A study by the United Nations World Tourism Organization and the United Nations Environment Programme on Climate Change and Tourism Development shows that the greenhouse effect caused by carbon emissions from tourism accounts for about 14% of the total global impact (World Tourism Organization, 2007).
From 2005 to 2020, the average annual growth rate of China’s total tourism carbon emissions reached 2.31% (Tang et al., 2021). However, it is undeniable that tourism has a significant contribution to regional economic growth (Lee and Brahmasrene, 2013). In the post-epidemic era, the pressure to recover from global tourism, one of the world’s largest financial industries, has led to severe challenges to the sustainability of the world’s tourism industry (Dong et al., 2023). In September 2020, the Chinese government stated at the 75th UN General Assembly General Debate that China will strive to reach peak CO2 emissions by 2030 and achieve carbon neutrality by 2060, which is “dual carbon” target (Zhang, 2022). Carbon emission has gradually become a research hotspot in various fields. Zhu and Han (2023) proposed that the upgrading of China’s industrial structure and the improvement of total factor efficiency can promote regional carbon emission reduction, and Xiao et al. (2021) conducted low-carbon city evaluation of urban areas. In the context of the “dual carbon” (carbon peak and carbon neutrality) target, researchers have been increasingly focused on measuring and controlling carbon emissions from tourism.
Research on tourism carbon emissions began in the early 21st century, and there are many methods available to measure them, including two mainstream methods: the “bottom-up” approach based on life cycle assessment theory (Luo et al., 2010) and the “top-down” method based on environmental input-output theory. The latter is calculated by collecting secondary data and applies to national (Gu and Wu, 2020; Han et al., 2021; Weng et al., 2021) and provincial (Liu, 2020; Ma, 2020; Tu and Liu, 2021) areas. The former applies to smaller scales, such as scenic spots (Lu, 2018). In 2002, Gössling first measured the carbon emissions of global tourism (Gössling, 2002). Moreover, in 2004, Zhang and Zhang (2004) proposed an ecological footprint model for tourism. Furthermore, in 2006, Patterson et al. chose the “bottom-up” and “top-down” methods to measure the carbon footprint of tourism in New Zealand. They found that the values of energy consumption and carbon emission measured by the two methods were very similar (Becken and Patterson, 2006).
Today, these two methods are still the main methods for calculating carbon emissions, but both of them have certain limitations. The lifecycle method requires first-hand data collection, which leads to a very high demand for data. Although the input-output method can use second-hand data, the data are old and rough, and the error in micro scale is significant. In order to get better results and avoid the limitations of each method as far as possible, some scholars combined the two methods for calculation. Sun and Drakeman (2020) combined the life cycle method and input-output method to evaluate the carbon emission of cellar door tourism when calculating the carbon footprint of cellar door sales of British wine tourists in Australia. In order to get more accurate results, some scholars combined various methods to calculate the carbon emissions of scenic spots. Tang et al. (2017) adopted top-down method, life cycle method and material flow theory, combined with Kaya identity and LMDI decomposition method to calculate tourism energy consumption in Wulingyuan.
With continuous research on tourism carbon emissions, scholars have found that, in terms of the sectoral structure of tourism carbon emissions, among the three main segments of tourism transportation, accommodation, and activities, tourism transportation has the most significant carbon emissions, accounting for 73%-79% of total tourism carbon emissions every year (Wang et al., 2014). However, with the implementation of relevant carbon reduction policies, tourism carbon emissions have improved. Not only have carbon emissions in urban transportation been reduced to a certain extent (Tu et al., 2022), but the carbon emission data of tourism areas and even urban agglomerations have also improved (Agnieszka et al., 2021; Wang, 2021). Some scholars have predicted the carbon emissions of regional tourism (Wang and Zhu, 2023). Therefore, under the conditions of strictly implementing energy-saving and emission-reduction measures and vigorously promoting the transformation of tourism development, the tourism industry will have considerable potential for carbon emission reduction (Ma et al., 2021).
With the introduction of the “dual carbon” target, domestic carbon emission-related research has exploded. However, in terms of the measurement of carbon emissions in scenic spots, there is no research has been done to integrate the carbon emissions data of domestic scenic spots. In addition, it is worth noting that no unified calculation method was used when calculating the carbon emissions of scenic spots, resulting in inaccurate results in some studies. In addition, due to the lack of integration of results data, there is no general standard for carbon emissions, which presents specific difficulties when implementing policies to reduce emissions. To address this research gap, data on carbon emission measurements of domestic scenic spots in the existing literature are extracted and integrated to 1) Provide a comprehensive overview of carbon emission levels in scenic spots; 2) Reveal the characteristics of carbon emissions of different types of scenic spots; and 3) Summarize the factors affecting the per capita carbon emission of tourists in scenic spots.
Firstly, this study uses meta-thought to screen the existing literature on carbon emission measurement of scenic spots in China and extracts data on the size of carbon emissions per capita, measurement year, visitor volume, and sizes of scenic spots. Secondly, this study analyzes carbon emissions per capita in scenic spots from four aspects. Firstly, under the time measure, the trend of carbon emissions per capita of different scenic spots in two periods with 2010 as the time point is explored. Secondly, the sample scenic spots are divided into three types, and the characteristic relationships between carbon emissions per capita in various scenic spots are summarized. Thirdly, correlation analysis explores the relationship between carbon emissions per capita in scenic spots and other important variables in those scenic areas. Then, we analyze the characteristics of carbon emissions of scenic tourist routes. Finally, research suggestions and outlooks on the problem of carbon emission measurement in scenic spots will be presented, and the research limitations of this study will be described.

2 Materials and methods

2.1 Data

2.1.1 Data sources

As this study is related to Chinese scenic carbon emissions, and foreign research on scenic carbon footprints differs significantly with regard to scenic spot management and tourists’ preferences compared with domestic ones, the literature data used in this study were obtained from the China National Knowledge Infrastructure (CNKI) to screen the Chinese literature related to scenic carbon emission. The search included data up to January 2023. In order to include existing literature and to combine the research contents, this study conducted an advanced search in CNKI with the following conditions: topic= “tourism carbon” OR “topic= scenic spot carbon” OR “topic=tourism eco-efficiency”, 2343 works of literature were retrieved, and after excluding articles that did not match the theme, and articles that did not contain carbon emission measurement, such as qualitative analysis of carbon emission characteristics, influencing factors, low carbon willingness, tourists’ cognition, low carbon management mode, etc., review articles and newsstudy columns about the progress of carbon emission research, 134 articles related to carbon emission measurement were selected. Then, after manual eliminating the literature on carbon emission measurement at national, provincial, and municipal scales, as well as the literature on the measure of a single sector in the tourism business process, the remaining literature was read and refined. As a result, 54 empirical studies containing specific data on tourism destinations’ carbon emissions were selected.

2.1.2 Data pre-processing

Among these 54 studies, 102 scenic tourism carbon emission measurement data and 18 tourism route data are available. The 102 data involve 46 scenic spots from 2004 to 2019. In the literature on measuring 18 tourism routes, only the carbon emission of tourists in a single tourist source and a single tourist mode were measured. Therefore, these data cannot represent the per capita carbon emissions of the scenic spot, only the carbon emissions generated by tourists visiting specific tourist routes, so they must be analyzed separately. Furthermore, in the manual screening process, because the calculated results of one particular scenic spot deviated too much from the average value, this paper excluded 9 studies of this spot from 2005 to 2013.
After screening, 93 carbon emission measurements per capita from 45 scenic spots were selected for this study. In contrast, data such as measurement time, scenic spot, tourist volume, and location information of the county where the scenic spot is located were counted for each study. Furthermore, the data were scientifically averaged as needed for joint analysis among the data. Finally, the carbon emission characteristics of scenic tourist routes measured in the literature are analyzed separately.

2.2 Methodology

2.2.1 Meta-analysis

Meta-analysis aims to refine and filter the existing research literature and its data, categorize, and organize them, and then analyze the statistical relationships between them. Before Gene Glass introduced the concept of meta-analysis in 1976 (Glass, 1976), its ideas had been used in marketing, health, and other fields. In the study of sustainable tourism, meta-analysis has been used in tourism resource value assessment (Johnston et al., 2005; Johnston et al., 2016; Jin, 2021), tourism environmental perception (Shi and Sun, 2020), etc. In this paper, by searching the literature on per capita carbon emissions in scenic spots, we summarize the information on scenic spot location, measurement year, and carbon per capita emissions, and analyze the relationship between carbon emissions in scenic spots and measurement time, scenic spot type, and tourist volume.

2.2.2 Natural breakpoint grading method

Natural breaks use clustering to maximize the similarity within each group and the dissimilarity between the external groups. However, different from clustering, it will take into account the range and number of elements between each group as close as possible. In this study, the natural breakpoint grading method is used to grade the tourist volume of scenic spots and the level of GDP of the municipality to which they belong, providing a scientific evaluation of the size of the variables.

2.2.3 Correlation analysis

SPSS (Statistical Product and Service Solutions) is the earliest statistical analysis software used worldwide. It is now widely used in various natural, technical, and social science fields. Correlation analysis refers to studying two or more variable elements to measure the closeness of correlation between two variables. In this study, we use IBM SPSS Statistics 26.0 to analyze the correlation between carbon emission per capita and the area of scenic spots.

3 Results

3.1 Temporal characteristics of carbon emission of tourism scenic spots

The existing research data on carbon emission measurement of domestic scenic spots starts in 2004 and ends in 2019. In terms of policy, in December 2009, the State Council of China issued the Opinions on Accelerating the Development of Tourism, in which it was proposed to “promote energy conservation and environmental protection, implement energy and water conservation and emission reduction projects in tourism” and the tourism industry in China started to advocate energy conservation and emission reduction (Wang and Li, 2010). After that, on November 16, 2011, the National Tourism Administration issued the Guiding Opinions of the National Tourism Administration on Further Accelerating the Development of Tourism and Promoting the Great Development and Prosperity of Socialist Culture, which emphasized the positive role of tourism in promoting the development of socialist culture. At this time, tourism and low-carbon tourism have been paid great attention by the government. Moreover, the current research data on carbon emission measurement of domestic scenic spots show that before 2010, the measured carbon emission per capita was low, and the estimated scenic spots were fewer. Therefore, this study selects 2010 as the time node to analyze scenic spot carbon emissions per capita.
Before 2010, there were 18 scenic spots and 38 items of measurement data; after 2010, there were 31 scenic spots and 41 items of measurement data. Moreover, some scenic spots have carbon emission calculation data for many years, so this study will take 2010 as the node and average this kind of data. The average per capita carbon emission represents the carbon emission level of the scenic spot in the average measurement year.
It is evident that, over time, the number of research areas regarding carbon emission measurement of domestic scenic spots is increasing, and the measurement data is becoming increasingly detailed. Thus, after data processing and adding the area of each scenic spot for joint analysis, we determined that before 2010, the per capita carbon emission of 14 scenic spots was 23.47 kg person-1 (Fig. 1); after 2010, the per capita carbon emission of 34 scenic spots was 55.29 kg person-1 (Fig. 2), and the per capita carbon emission increased compared with the previous time.
Fig. 1 Per capita carbon emissions and scenic area before 2010
Fig. 2 Per capita carbon emissions and scenic area after 2010

3.2 Characteristics of carbon emission in different tourism scenic spots

Different scenic spots have other characteristics in terms of carbon emissions due to the different ways of visiting and tourism attractions. Therefore, based on available data, all 45 scenic spot samples are classified into natural, humanistic, and mixed categories. The classification is based on the main attraction of the scenic spots. For example, Jiuzhaigou is famous for its natural scenery of mountains and waters; Jiuzhaigou is, therefore, classified in the natural category. Wutai Mountain is one of the four famous Buddhist mountains, and tourists visit to partake in activities related to Buddhist culture; therefore, it is classified in the humanistic category. Gulangyu Island has both beautiful natural island scenery and ancient humanistic buildings such as Sanyudo and Peasant Garden; hence, it is classified in the mixed category.
After classification, natural scenic spots are the largest of the three categories, with 27 samples, accounting for 60.0%; humanistic and mixed scenic spots have the same number of samples, with 9, accounting for 20.0% each. Then, according to the same principle as before, scenic spots with multiple years of measurement data were scientifically averaged to represent the average per capita carbon emissions in the average year. After data processing, it was calculated that the average per capita carbon emissions of scenic spots in the natural category were the largest at 66.13 kg person-1, which was more significant than that of mixed scenic spots at 16.53 kg person-1. On the other hand, the average per capita carbon emissions in the humanistic category were the smallest at 13.98 kg person-1 (Fig. 3).
Fig. 3 Average per capita carbon emissions of different types of scenic spots
To further study the characteristics of carbon emissions per capita of different categories of scenic spots, considering that the visitor volume of scenic spots is an important vari able affecting the size of carbon emission per capita, data on visitor volume of each scenic spot in the measurement year were collected. In addition, the type of scenic spot, visitor volume, measurement year, and carbon emissions per capita were jointly analyzed. The natural breakpoint grading method was applied to the scenic spot visitor volume. The visitor volume of all scenic spots in the sample measure- ment year was graded into nine levels. The Fig. 4 shows the above four variables, where the bubble size represents carbon emissions per capita, and the bubble color represents the type of scenic spot.
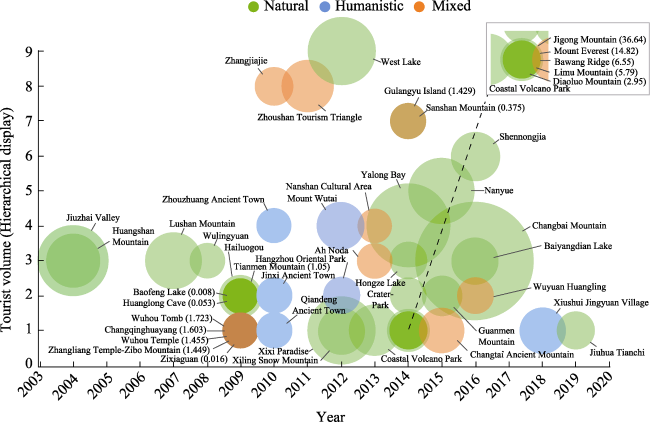
Fig. 4 Comprehensive graph of year, number of visitors, type of scenic spot, and per capita carbon emissions

Note: The bubble size represents carbon emissions per capita, and the bubble color represents the type of scenic spot.

Several bubbles overlap in the figure, such as Jigong Mountain, Mount Everest, Bawang Ridge National Forest Park, Limu Mountain National Forest Park, and Diaoluo Mountain National Forest Park, all of which are natural scenic spots. Nevertheless, the figure shows that their measured years, visitor numbers, and per capita carbon emissions are similar, indicating that these five scenic spots have similarities regarding visiting methods and so on.

3.3 The relationship between carbon emission and the area of tourism scenic spots

We listed all relevant factors that may affect per capita carbon emissions in the study, including the visitor volume, annual income of the scenic spot, GDP of the city and county where the scenic spot is located, year of study meas- urement and area of the scenic spot. We found that none of these variables had a significant impact on per capita carbon emissions except the area of the scenic area.
The area of the scenic spot is an important factor affecting the per capita carbon emission. It will affect the tourists’ visiting methods and visiting time, thus affecting the per capita carbon emission of the scenic spot. SPSS Statistics 26.0 was used to analyze the correlation between the two variables, carbon emissions per capita and the size of the area. Since the above two data do not conform to a normal distribution, the Spearman correlation coefficient was used to indicate the strength of the correlation. The results show that the correlation coefficient value between carbon emissions per capita and the scenic spot is 0.479 and shows significance at the 0.01 level, indicating a significant positive correlation between the two. We conclude that the size of the scenic area and carbon emissions per capita are positively correlated; the bigger the scenic spot, the higher the carbon emissions per capita of the scenic spot.

3.4 Characteristics of carbon emissions of scenic routes

In the process of meta-analysis, apart from the carbon emission measurement data of scenic spots, carbon emission measurement data of 18 tourist routes were also screened. This carbon emission data per capita can only represent carbon emissions from one kind of visitor source, transportation, and accommodation modes. A complex visitor source, a variety of transportation modes, and a wide range of tour and accommodation modes make it impossible to take the carbon emission data of such lines as the carbon emission per capita for the entire scenic spot, so it is necessary to analyze the data of each of these 18 lines separately. To facilitate our comparison of the results, the carbon emissions are averaged for the data of tourist routes with the same scenic spots and touring days. Finally, different transportation and accommodation modes and the final carbon emission data per capita for 14 scenic routes are obtained (Fig. 5).
Fig. 5 Per capita carbon emissions of different tourist routes
In Fig. 5, the horizontal coordinate “1d” represents the one-day tour route, while “Beiing-Yesanpo” represents the tourist route with Beijing as the tourist source and Yesanpo as the tourist destination. For example, “2d: Tianjin-Yesanpo” represents a two-day tour route originating from Tianjin and destined for Yesanpo.
With the increase in the number of days of the tour route, the per capita carbon emissions showed a rising trend. Furthermore, the greater the distance from the source, the greater the per capita carbon emissions under the same conditions. Among the data of these 18 routes, studies compared the differences in carbon emissions brought by dif-ferent transportation modes chosen by tourists; there are also studies showing that the carbon emissions caused by different types of hotels, such as farmhouses, general hotels, and star hotels, are also different.

4 Discussion

This study on the per capita carbon emission characteristics of domestic scenic spots responds to the existing research conclusions on Chinese tourism carbon emission characteristics. The research conclusion of Wang et al. (2015) on the spatial pattern of tourism carbon emission efficiency and its influencing factors shows that Chinese tourism carbon emission efficiency presents a slow trend of improvement. This study confirms that per capita carbon emissions from tourist attractions in China are increasing, which well supports previous studies. In the process of meta-analysis, we found that there were great differences in the system boundaries chosen by the studies when measuring the carbon emissions of scenic spots. Tang et al. (2021) proved that tourism industry faces five major challenges to achieve the goal of “dual carbon”: Rapid growth of tourism carbon emission, threat of global climate change, blurred carbon emission boundary, strong demand for high-quality tourism, and insufficient carbon reduction technology. It is further confirmed that the determination of the system calculation boundary will have a great impact on the carbon reduction work.
This study has certain theoretical contributions. Combined with previous studies on carbon emission measurement, this study integrated all the effective data on carbon emission of domestic scenic spots, provided a basis for the accuracy of carbon emission measurement of scenic spots, and deepened the research on the measurement of carbon footprint at the scale of scenic spots. Existing studies have analyzed the factors affecting carbon emissions and tourists’ intention to low-carbon. On this basis, this study obtains the factors influencing tourists’ per capita carbon emissions through quantitative data analysis. The results will help understand the emission reduction mechanism and guide the emission reduction work better.

4.1 Implication and prospect

4.1.1 Uniform measurement method

There are many ways to measure tourism carbon emissions, among which there are two mainstream methods: the “bottom-up” method based on life cycle assessment theory (LCA) and the “top-down” approach based on environmental inputs and outputs. However, due to the complexity of the statistical data required by LCA, some studies choose to use other methods to calculate carbon emissions in a specific tourism sector as a proxy for data, such as the questionnaire survey method, input-output method, etc. Such measurement methods make the results less reliable, especially for scenic spots on a small research scale, and the impact of this inaccuracy will be magnified.
Taking the questionnaire survey method as an example, some studies defined the boundary of carbon emission measurement for scenic spots as the sum of carbon emission inside the area and carbon emission from external transportation. Since it is difficult to obtain data on external transport of one scenic spot, this part of the study calculates the number of tourists and their transportation choice by the proportion of questionnaires collected. Still, since tourists often visit more than one scenic spot during tourism activities, the calculated scenic spot should bear only some of the transportation carbon emissions of tourists to and from the source. Therefore, the measurement results are different from the actual value. Because of the large number of tourists, the error of this calculation cannot be ignored. In future research, we need to choose a measurement method that is more scientifically sound.

4.1.2 Uniform carbon emission factor

When domestic scholars adopt the life-cycle approach to carbon emission measurement, there is no uniform standard for the carbon emission coefficients used. Instead, they mainly refer to existing literature or select the current coefficients scientifically on average. Some scholars (e.g., Wu and Tian, 2016) choose to use the latest locally obtained parameters in order to obtain more accurate carbon emission data. This will increase the difficulty of calculation to some extent, and even lead to the deviation of the final calculation results of carbon emissions.
A unified carbon emission coefficient should be adopted to make measurement results more scientifically rigorous in future carbon emission measurement processes. Moreover, some organizations have built carbon emission coefficient databases to facilitate researchers to calculate carbon emissions accurately, conveniently, and uniformly, such as the China City Greenhouse Gas Working Group (CCG), which was established in 2017 to build a public set of greenhouse gas emission coefficients for the whole life cycle of Chinese products at no cost.

4.1.3 Focus on similar scenic spots to find carbon reduction paths

The research and analysis process shows that many scenic spots of the same type have similar measurement years, sizes, and visitor volumes. Still, the magnitude of carbon emissions differs significantly under the premise of adopting similar measurement methods. For example, two pairs of good examples are Wulingyuan and Jiuzhaigou, Jigong Mountain and Crater Park (Table 1). When we compared them in pairs, we found that they were similar in category, year of measurement, number of visitors and size. Still, their per capita carbon emissions are different. Therefore, attention should be paid to similar scenic spots, and comparisons should be made in scenic spot management to find ways to reduce carbon emissions.
Table 1 Comparison of per capita carbon emissions in similar natural scenic spots
Name Year Visitor (10000 people) Area
(km2)
Carbon emission per capita (kg person-1)
Wulingyuan 2008 189.12 500.00 78.94
Jiuzhai Valley 2004 191.20 650.75 36.64
Jigong Mountain 2014 15.40 29.17 36.64
Crater Park 2014 40.00 20.00 0.73

4.2 Limitations

The measurement of carbon emissions is the most fundamental issue in the “measurement-emissions-compensation” carbon compensation model implemented in New Zealand and Scotland. In this study, the meta-analysis revealed that most of the qualitative carbon emission studies in scenic spots had conducted quantitative carbon emission measurement studies, i.e., measuring carbon emissions is a prerequisite for qualitative studies, reinforcing that carbon emission measurement is the most fundamental issue.
The object of meta-analysis in this study is the domestic research on the measurement of tourism carbon emissions at the scale of scenic spots. Although the sample size has been exhausted, there are still many scenic spots in China that do not have measurement data related to tourism carbon emissions. Moreover, even the tourism carbon emission of some scenic spots focusing on ecological protection has yet to be measured accurately, and a significant research gap exists.
In addition, because the domestic research on carbon emission measurement of scenic spots is less than that in foreign countries, a manual screening in the meta-analysis process is sufficient to count the domestic literature. However, meta-analysis of foreign studies on carbon emissions of scenic spots will require big data software for efficient and error-free data acquisition.

5 Conclusions

This study conducts a meta-analysis of existing studies on carbon emissions measurement, summarizes the carbon emission characteristics and clarifies the factors affecting the per capita carbon emission of tourists in domestic scenic spots, in order to provide some clarity and theoretical reference for achieving the goal of “dual carbon”.
Since 2010, there have been more studies on carbon emissions of tourists in domestic scenic spots, and tourists’ average per capita carbon emission has increased. Among the 45 scenic spots, both the number of natural scenic spots and the average carbon emission per capita were larger than those of the other two types, with the average carbon emission per capita being 66.13 kg person-1. By screening other important variables of scenic spots, this study found that there is a significant positive correlation between the size of the scenic spot and per capita carbon emissions. Furthermore, since natural scenic spots are usually more extensive than the other two types, this finding further confirms the more significant per capita carbon emissions in natural scenic spots. An analysis of studies related to carbon emission measurement of scenic tourist routes shows that, generally, an increase in the number of tourist route days leads to a rise in per capita carbon emissions. This part of the study often involved a cross-sectional comparison of different modes of transportation or hotel types involving the same source of tourists.
[1]
Agnieszka G K, Jacek D, Ewa A, et al. 2021. Human Health Risk Assessment of Air Pollution in the Regions of Unsustainable Heating Dources: Case Study—The Tourist Areas of Southern Poland. Atmosphere, 12(5): 615. DOI: 10.3390/atmos12050615.

[2]
Becken S, Patterson M. 2006. Measuring national carbon dioxide emissions from toxirian as a key step towards achieving sustainable tourism. Journal of Sustainable Tourism, 4: 323-338.

[3]
World Tourism Organization. 2007. Climate change and tourism:Responding to global challenges. Second International Conference on Climate Change and Tourism, 2007, October 3, Davos. Davos, Switzerland: World Tourism Organization.

[4]
Dong S C, Xia B, Li F J, et al. 2023. Spatial-temporal pattern, driving mechanism and optimization policies for embodied carbon emissions transfers in multi-regional tourism: Case study of provinces in China. Journal of Cleaner Production, 382: 135362. DOI: 10.1016/j.jcle pro.2022.135362.

[5]
Glass G V. 1976. Primary, secondary, and meta-analysis of research. Educational Research Review, 5(10): 3-8.

[6]
Gössling S. 2002. Global environmental consequences of tourism. Global Environmental Change, 12(4): 283-302.

DOI

[7]
Gu S Y, Wu Y W. 2020. Calculation and analysis of carbon emission of tourism industry in mainland China based on input-output method. Northern Economy and Trade, 2: 150-155. (in Chinese)

[8]
Han Z Y, Li T, Liu X M. 2021. Temporal and spatial characteristics and evolution of China’s inbound tourism carbon footprint. Journal of Resources and Ecology, 12(1): 56-67.

DOI

[9]
Jin Z. 2021. Carbon peak, carbon neutralization and high-quality transformation of tourism. Tourism Tribune, 36(9): 3-5. (in Chinese)

[10]
Johnston R J, Besedin E Y, Iovanna R, et al. 2005. Systematic variation in willingness to pay for aquatic resource improvements and implications for benefit transfer: A meta-analysis. Canadian Journal of Agricultural Economics, 53(2-3): 221-248.

DOI

[11]
Johnston R J, Besedin E Y, Stapler R. 2016. Enhanced geospatial validity for meta-analysis and environmental benefit transfer: An application to water quality improvements. Environmental & Resource Economics, 68: 343-375.

[12]
Lee J W, Brahmasrene T. 2013. Investigating the influence of tourism on economic growth and carbon emissions: Evidence from panel analysis of the European Union. Tourism Management, 38: 69-76.

DOI

[13]
Li S X, Cheng J H, Cheng Z H. 2021. Research progress and visualization analysis of low-carbon tourism in the context of global climate change. Journal of Chinese Ecotourism, 11(1): 141-158. (in Chinese)

DOI

[14]
Liu X Z. 2020. A comparative decomposition analysis of the factors driving energy-related carbon emissions from three typical provinces in China: Jiangsu, Henan and Inner Mongolia. Journal of Resources and Ecology, 11(5): 483-498.

DOI

[15]
Lu H. 2018. Research progress and prospect of tourism carbon footprint measurement. Tourism Research, 10(2): 75-83. (in Chinese)

[16]
Luo F, Zhong Y D, Wang H C. 2010. Carbon footprint and low carbon tourism research. World Regional Studies, 19(3): 105-113. (in Chinese)

[17]
Ma J. 2020. Study on tourism ecological efficiency of Gansu Province based on carbon footprint. Diss., Lanzhou, China: Lanzhou University of Finance and Economics.

[18]
Ma X J, Han M M, Luo J, et al. 2021. The empirical decomposition and peak path of China’s tourism carbon emissions. Environmental Science and Pollution Research, 28: 66448-66463.

DOI

[19]
Shi J L, Sun J. 2020. Meta-understanding of environmental perception in tourism: Implications for China’s tourist attractions. Sustainability, 12(4): 1658. DOI: 10.3390/su12041658.

[20]
Sun Y Y, Drakeman D. 2020. Measuring the carbon footprint of wine tourism and cellar door sales. Journal of Cleaner Production, 266: 121937. DOI: 10.1016/j.jclepro.2020.121937.

[21]
Tang C C, Zha J P, Zhang J K, et al. 2021. Dual-carbon goal of China’s tourism industry under high-quality development: Evaluation & prediction, major challenges and realization path. Journal of Chinese Ecotourism, 11(4): 471-497. (in Chinese)

[22]
Tang C C, Zhong L S, Pin Ng. 2017. Factors that influence the tourism industry’s carbon emissions: A tourism area life cycle model perspective. Energy Policy, 109: 704-718.

DOI

[23]
Tu W, Liu Q P. 2021. Study on the relationship between tourism carbon emission and carbon carrying capacity in east China. Ecological Economy, 37(11): 144-149, 155. (in Chinese)

[24]
Tu Z, Cao Y, Kong J. 2022. The impacts of low-carbon city pilot projects on carbon emissions in China. Atmosphere, 13(8): 1269. DOI: 10.3390/atmos13081269.

[25]
Wang K, Huang Z F, Cao F D. 2015. Spatial pattern and influencing factors of carbon dioxide emissions efficiency of tourism in China. Acta Ecologica Sinica, 35(21): 7150-7160. (in Chinese)

[26]
Wang K, Li J, Xi J C. 2014. Linking between carbon dioxide emission and tourism economic growth in China. Tourism Tribune, 29(6): 24-33. (in Chinese)

[27]
Wang L G, Zhu H. 2023. Multi-scenario evolution of tourism carbon emissions in Jiangxi Province under the “carbon peak and neutrality” target. Journal of Resources and Ecology, 14(2): 265-275.

DOI

[28]
Wang Y. 2021. The spatial distribution characteristics of carbon emissions at county level in the Harbin-Changchun urban agglomeration. Atmosphere, 12(10): 1268. DOI: 10.3390/atmos12101268.

[29]
Wang Y, Li W. 2010. An overview of low-carbon economy research situation. Journal of Inner Mongolia University, 42(3): 27-33.

[30]
Weng G M, Li C H, Pan Y, et al. 2021. Decoupling effect and influencing factors of carbon emissions in China’s tourism industry. Geography and Geo-Information Science, 37(2): 114-120. (in Chinese)

[31]
Wu P, Tian M. 2016. On estimating transportation energy consumption and carbon dioxide emissions from off-shore island tourism—A case study of Haikou City, China. Journal of Resources and Ecology, 7(6): 472-479.

DOI

[32]
Xiao H B, He X Y, Kuang Y L, et al. 2021. Carbon emission evaluation in Jinan Western New District based on multi-source data fusion. Journal of Resources and Ecology, 12(3): 346-357.

DOI

[33]
Zhang J H, Zhang J. 2004. Touristic ecological footprint model and analysis of Huangshan City in 2002. Acta Geographica Sinica, 59(5): 763-771. (in Chinese)

DOI

[34]
Zhang Y. 2022. Analysis of China’s energy efficiency and influencing factors under carbon peaking and carbon neutrality goals. Journal of Cleaner Production, 370: 133604. DOI: 10.1016/j.jclepro.2022.133604.

[35]
Zhu M F, Han Z Y. 2023. Industrial upgrading, total factor energy efficiency and regional carbon emission reduction in China. Journal of Resources and Ecology, 14(3): 445-453.

DOI

Outlines

/