
Journal of Resources and Ecology >
Optimization of the Land Use Structure of Opencast Coal Mine under the Background of Low Carbon—A Case Study of Luotuoshan Mountain Mining Area in Wuhai City of Northwest China
|
LIU Jiaqi, E-mail: 1748620425@qq.com |
Received date: 2022-10-08
Accepted date: 2023-04-30
Online published: 2024-03-14
Supported by
The Integrated Demonstration Research on Ecological Restoration and Ecological Safety Guarantee Technology in Mining Area(2017YFC0504406)
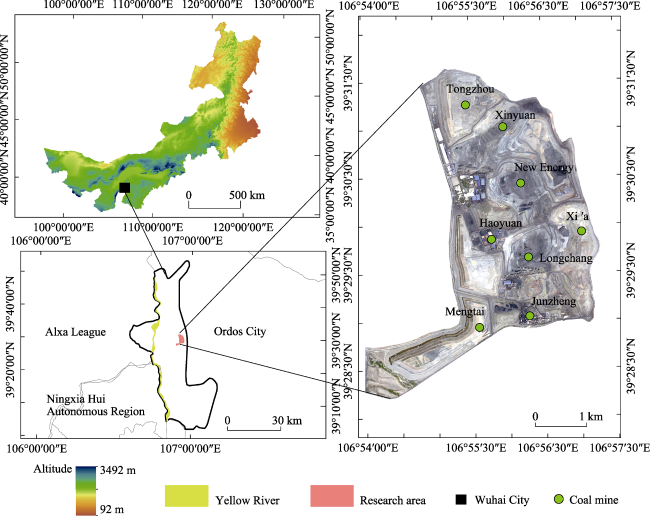
Humans affect the global carbon cycle primarily through land use activities. In particular, the acceleration of opencast coal mining has induced serious problems such as the increase of carbon emissions in mining areas and the decline of ecosystem functions. Therefore, it has become critical to explore optimal land use structures with the best ecological benefits under low carbon emissions and provide theoretical support for the optimization and adjustment of land use structures in arid desert mining areas, especially in northwest China. Taking the Luotuoshan mining area in Wuhai City of northwest China as the research area, this study estimated carbon emissions from land use activities in the mining area and constructed a land use optimization scheme focused on low carbon emission and high ecological service value using a multi-objective programming model. The results showed that under the optimization scheme, the area of grassland and water land use types increased, while those of mining land and unused land decreased. Compared with 2021, the optimization scheme could decrease carbon emissions by 19045.93 tC and increase the ecosystem service value by 53381400 yuan. Thus, the optimization scheme of land use structure can improve the ecological benefits of land use and ensure low carbon emission in mining areas. The findings will provide scientific guidance for the optimization of the land use structure and ecological restoration in arid desert areas of northwest China.
LIU Jiaqi , YANG Jianying , ZHAO Tingning , WEI Guangkuo , LI Ruipeng , KUI Guoxian , AI Xianfeng . Optimization of the Land Use Structure of Opencast Coal Mine under the Background of Low Carbon—A Case Study of Luotuoshan Mountain Mining Area in Wuhai City of Northwest China[J]. Journal of Resources and Ecology, 2024 , 15(2) : 455 -463 . DOI: 10.5814/j.issn.1674-764x.2024.02.020
Fig. 1 Distribution map of study area |
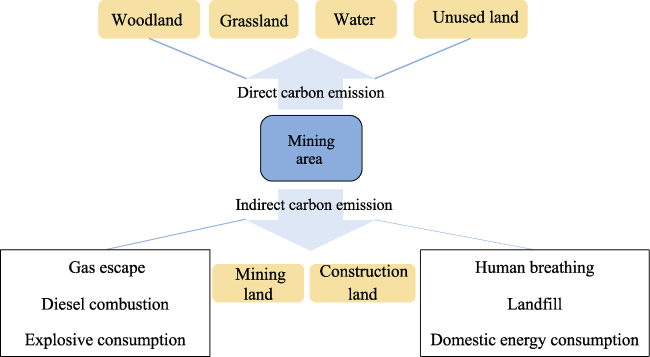
Fig. 2 Composition of carbon emission from land use in mining area |
CI = CI1+CI2+CI3
CL = CL1+CL2+CL3
Table 1 Calculation of carbon emissions from mining land |
| Carbon emission type | Formula | Symbolic meaning |
|---|---|---|
| Gas escape (CI1) | CI1=a×G×ρ×(EFa+EFb) (3) | CI1 is CH4 emission, t yr-1; a is the global warming potential of CH4, taking 24.5; G is the coal mining amount, t yr-1; ρ is the density of CH4 under standard conditions, taking 0.714 kg m-3; EFa is the CH4 emission factor during mining, which is 1.2 m3 t-1 (referring to the 2006 IPCC Guidelines for National Gas Inventory); EFb is the CH4 emission factor after mining, which is 0.1 m3 t-1 |
| Diesel combustion (CI2) | CI2= E × P (4) P = F × R × O × 10-6 (5) | CI2 is the carbon emission from diesel consumption, tC; E is the consumption of diesel oil, t; F is the average low calorific value of diesel oil, which is 42652 kJ kg-1 (referring to the General Rules for Calculation of Comprehensive Energy Consumption GB/T 2589-2008); R is the carbon content per unit calorific value of diesel oil, taking 20.2 tC tJ-1; O is the carbon oxidation rate of diesel oil, taking 0.98 (referring to the Guide for Compilation of Provincial Greenhouse Gas Inventory) |
| Explosive consumption (CI3) | CI3= GE× p (6) | CI3 is the carbon emission of ammonium nitrate explosive, tC; GE is the amount of ammonium nitrate explosive, t; p is the carbon emission factor of ammonium nitrate explosive, taking 0.2629 tC t-1 (Zhang, 2013) |
Table 2 Calculation of carbon emissions of construction land |
| Carbon emission type | Computing formula | Symbolic meaning |
|---|---|---|
| Human respiration (CL1) | CL1 = Nh×fh (7) | CL1 is the carbon emission from human and animal respiration; Nh is the total population of the study area; fh is a parameter of annual respiratory volume per capita of human body, with a value of 0.079 (Fang et al., 2007; Kuang et al., 2010) |
| Landfill (CL2) | CL2=M×0.167×(1‒71.5%) (8) | CL2 is the total carbon emission from landfills of domestic garbage, and M is the amount of domestic garbage landfill in the study area within one year. Referring to the default value in the 2006 IPCC Guidelines for National Greenhouse Gas Inventory, the emission factor of methane in landfill was set as 0.167, and the moisture content of garbage was set as 71.5% (Guo, 2009) |
| Domestic energy consumption (CL3) | CL3= ∑(Bi× bi× ci) (9) | CL3 is the total carbon emissions of domestic energy consumption; Bi is the consumption of type i energy; bi is the conversion coefficient of the i energy source into standard coal; ci is the carbon emission coefficient of the i energy source (IPCC Guidelines for National Greenhouse Gas Inventory, Zhao et al., 2011) |
max(or min)f(x) = (f1(x), f2(x),…fp(x))T
max(or min)F(x)=wi f(x)
min f1 (x) = −0.487 x1−0.191 x2 + 63.443 x3 + 56.276 x4 − 0.410 x5 − 0.005 x6
Table 3 Loss equivalent of ecosystem service function value of industrial and mining land |
| Land use type | Ecosystem service function | Basic data | Land use type area (ha) | Service value equivalent (ha) | ||
|---|---|---|---|---|---|---|
| Data type | Quantity (t) | Cost (yuan t-1) | ||||
| Mining land | Water conservation | Water resources supply | 318780 | 2.5 | 793.46 | 1165.10 |
| Sewage treatment fee | 0.3 | |||||
| Water resource fee | 0.1 | |||||
| Waste disposal | Tailings discharge | 90000 | 15 | 1701.41 | ||
| Construction land | Water conservation | Water resources supply | 43560 | 1.3 | 100.92 | 690.61 |
| Sewage treatment fee | 0.2 | |||||
| Water resource fee | 0.1 | |||||
| Waste disposal | household garbage | 528.84 | 20.43 | 107.06 | ||
Table 4 Ecosystem service value coefficient of land use types |
| Ecosystem service function | Land use type | |||||||
|---|---|---|---|---|---|---|---|---|
| First-class type | Secondary type | Plough | Woodland | Grassland | Construction land | Mining lease | Water area | Unused land |
| Adjustment service | Gas regulation | 2069.3218 | 4354.841 | 6084.424 | 0.00 | 0.00 | 2378.176 | 339.7394 |
| Climate regulation | 1111.8744 | 13064.52 | 16091.29 | 0.00 | 0.00 | 7072.757 | 308.854 | |
| Water conservation | 833.9058 | 10346.61 | 11798.22 | -690.61 | -1165.1 | 315772.3 | 648.5934 | |
| Waste disposal | 308.854 | 3953.331 | 5312.289 | -107.06 | -1701.41 | 17141.4 | 957.4474 | |
| Supply service | Food supply | 2625.259 | 586.8226 | 1173.645 | 0.00 | 0.00 | 2470.832 | 30.8854 |
| Support services | Soil conservation | 3181.1962 | 5312.289 | 7412.496 | 0.00 | 0.00 | 2872.342 | 401.5102 |
| Biodiversity | 401.5102 | 4849.008 | 6733.017 | 0.00 | 0.00 | 5837.341 | 370.6248 | |
| Amount | 10531.9214 | 42467.4216 | 54605.38 | -797.67 | -2866.51 | 353545.1 | 3057.655 | |
max f2(x) = 42467.42 x1+54605.38 x2‒797.67 x3‒2866.51 x4+353545.15 x5+3057.65 x6
76.46 ≤x1≤145.46
x2≥167.94
457.64≤x4≤793.49
0.29≤x5≤48.55
x6≤383.00
Table 5 Optimization results of land use structure in Luotuoshan Mining Area |
| Variable | Area in 2016 (ha) | Area in 2021 (ha) | Optimized area (ha) |
|---|---|---|---|
| x1 | 38.44 | 76.46 | 76.46 |
| x2 | 72.72 | 81.11 | 750.05 |
| x3 | 76.29 | 100.92 | 100.92 |
| x4 | 458.19 | 793.49 | 457.64 |
| x5 | 3.27 | 0.29 | 48.55 |
| x6 | 786.37 | 383.00 | 0 |
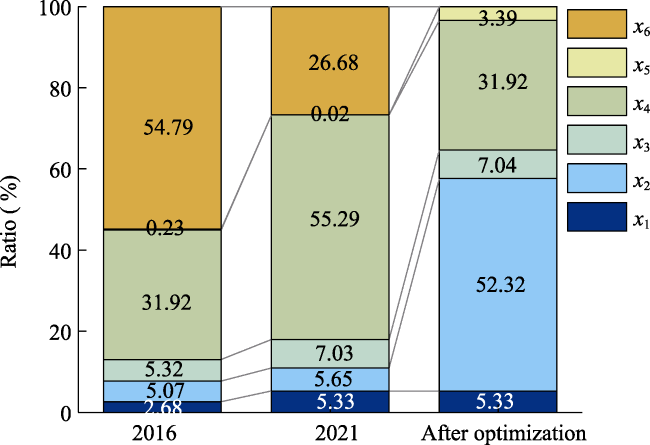
Fig. 3 Proportion of land use types before and after optimization |
Table 6 Carbon emissions of land use before and after optimization (Unit: tC) |
| Carbon emissions | x1 | x2 | x3 | x4 | x5 | x6 |
|---|---|---|---|---|---|---|
| 2016 | -18.72 | -13.89 | 4844.72 | 25785.10 | -1.34 | -3.93 |
| 2021 | -37.24 | -15.49 | 6408.82 | 44654.44 | -0.12 | -1.92 |
| After optimization | -37.24 | -143.26 | 6408.82 | 25754.15 | -19.91 | 0.00 |
Table 7 Changes of carbon emissions and ecological benefits before and after optimization |
| Index | Before the optimization | After the optimization | Change value |
|---|---|---|---|
| Carbon emissions (tC) | 51008.50 | 31962.57 | -19045.93 |
| Ecosystem service value (104 yuan) | 659.47 | 5997.61 | 5338.14 |
| [1] |
|
| [2] |
|
| [3] |
|
| [4] |
|
| [5] |
|
| [6] |
|
| [7] |
|
| [8] |
|
| [9] |
|
| [10] |
|
| [11] |
|
| [12] |
|
| [13] |
|
| [14] |
|
| [15] |
|
| [16] |
|
| [17] |
|
| [18] |
|
| [19] |
|
| [20] |
|
| [21] |
|
| [22] |
|
| [23] |
|
| [24] |
|
/
| 〈 |
|
〉 |