Natural Disaster Assessment

GIS Analysis for Hazard Assessment of Drought Using SPI in Fars Province, Iran

  • MASOUDI Masoud , 1 ,
  • TAHERI Zahra , 2, *
Expand
  • 1. Department of Natural Resources and Environmental Engineering, School of Agriculture, Shiraz University, Shiraz 13131-71441, Iran
  • 2. Department of Environmental Science, Faculty of Natural Resources, University of Tehran, Tehran 31587-77871, Iran
*TAHERI Zahra, E-mail:

MASOUDI Masoud, E-mail:

Received date: 2022-10-11

  Accepted date: 2023-05-10

  Online published: 2024-03-14

Abstract

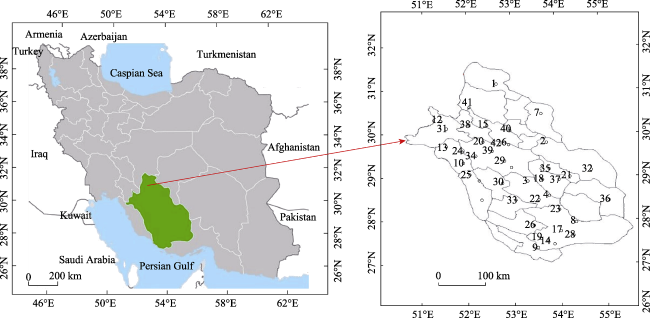
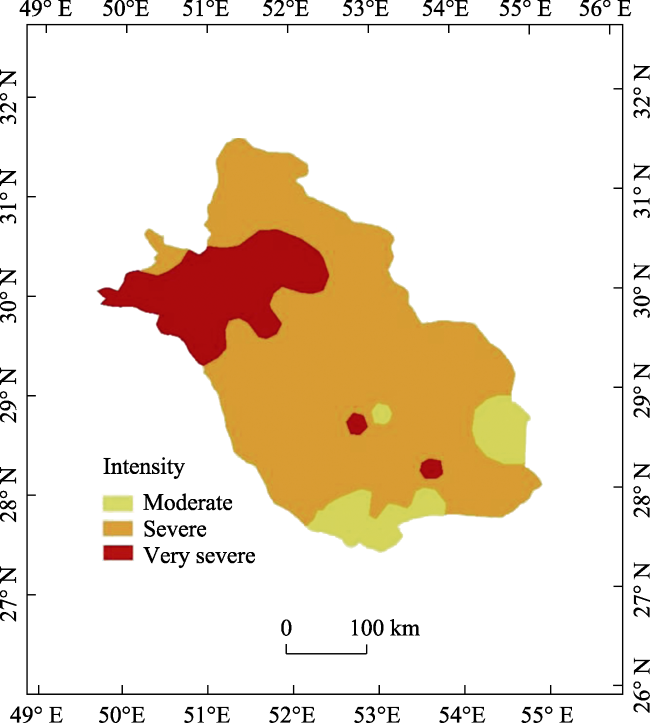
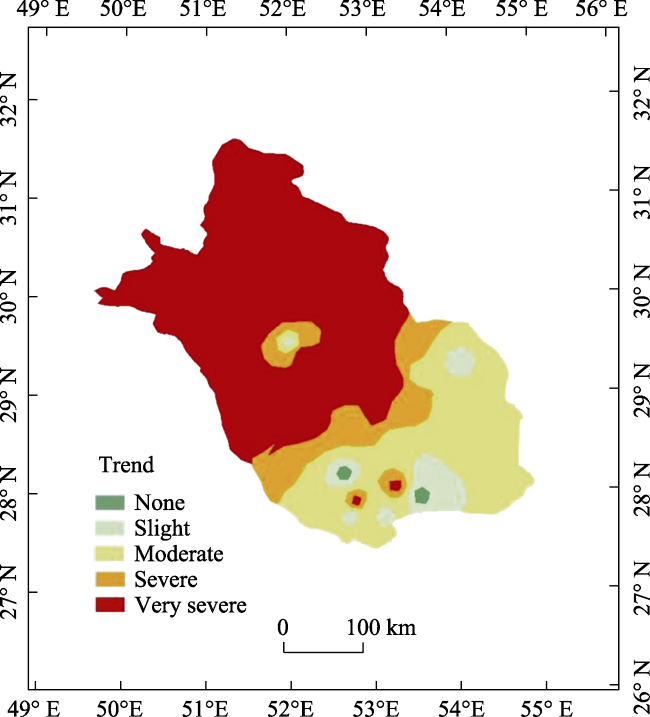
Drought is one of the main natural hazards affecting large areas’ economies and the environment. Therefore, it is necessary to study the different aspects of the drought on the land with several indices like the Standard Precipitation Index (SPI) index which can clarify the existing conditions for decisions and planning. The objective of this study was to analyze the spatial pattern of drought by SPI index in the Fars Province located in the Southern part of Iran. In this paper, according to the data from 42 stations in Fars Province, during 1990-2019, the pattern of drought hazard is evaluated. In the presented model, several drought hazard criteria were used including the maximum severity of drought in the period, the trend of drought, and the maximum number of sequential arid years. The final drought risk map was obtained with an arithmetic mean of 3 criteria: intensity, continuity, and trend. The three criteria maps and final hazard map were interpolated by the Inverse Distance Weightage (IDW) method and classified into five hazard classes none, slight, moderate, severe, and very severe. The obtained maps showed that the intensity, trend, and continuity of drought increases from the southeast to the northwest. The final vulnerability map shows that moderate hazard areas (36% of the region) observed in the Southern parts of the region are less widespread than areas under severe and very severe hazard (64% of the region) observed in the northern and central parts of the region. Preparation of these hazard maps may prove to be helpful for regional managers, and policymakers for environmental and agricultural strategies, not only in Iran but also in other countries facing this hazard.

Cite this article

MASOUDI Masoud , TAHERI Zahra . GIS Analysis for Hazard Assessment of Drought Using SPI in Fars Province, Iran[J]. Journal of Resources and Ecology, 2024 , 15(2) : 439 -447 . DOI: 10.5814/j.issn.1674-764x.2024.02.018

1 Introduction

Drought, which is known as one of the environmental phenomena due to the lower number of rainfall events, is one of the most severe natural disasters caused due to water scarcity, causing an adverse impact on an area’s agriculture and water resources (Kalura et al., 2021; Liu et al., 2021; Song and Park, 2021; Zarei et al., 2022). It is in fact a part of climate change that can occur in any geographical area and have a major impact on that (Song and Park, 2021). The phenomenon of drought causes a lot of damage every year in different parts of human life (Safarianzengir et al., 2020).
Studies show that severe drought causes fractures and cracks in the rocks that cover and under the salt (Kim et al., 2019) and a considerable proportion of the damaging sinkholes worldwide correspond to human-induced subsidence events related to groundwater withdrawal and the associated water-table decline (Xiao et al., 2020). Considering the impact of drought on agricultural products and human food security (Swain et al., 2017; Dai et al., 2020; Wu et al., 2020; Gupta et al., 2020) understanding the drought is a significant process considering the current erratic rainfall situation (Arul Prasad et al., 2019). On the other hand, climate change poses a significant threat to global biodiversity (Barbarossa et al., 2021) and Drought is detrimental to both natural systems and human societies (Yue et al., 2021). Climate change will alter the distribution of water in time and space (Naumann et al., 2021).
Droughts of the future are likely to be more frequent, severe, and longer lasting than they have been in recent decades (Ault, 2020). Therefore, the selection of the appropriate drought index to assess drought conditions is very important (Jahangir et al., 2020; Swain et al., 2021; Zarei et al., 2021a).
Scientists introduce drought as a known environmental disaster. Unlike aridity, which is a permanent feature of the climate and is limited to low-rainfall areas, drought is a temporary diversion (Belal et al., 2014). Scientists consider climatic phenomena, especially consecutive and severe droughts, to be the most important cause of desertification. The drought is not specific to the region, and it affects different parts of the world (Safarianzengir et al., 2020). South Asian countries have been experiencing frequent drought incidents recently, and due to this reason, many scientific studies have been carried out to explore drought in South Asia (Chandrasekara et al., 2021).
The impact of the drought phenomenon in rural areas is wider, which poses significant challenges for the rural economy in general and agricultural production in particular. A common strategy for drought management is based on crisis management. However, for effective drought management, risk management seems to be more in line with drought early warning systems (Sharafi et al., 2020).
The percentage of normal precipitation index (PNPI) and rainfall anomaly index (RAI) were used for analysis and evaluation of meteorological drought in KwaZulu-Natal, South Africa, and changes in rainfall patterns for 48 years and identification of wet and dry years (Ndlovu and Demlie, 2020).
Standard Precipitation Index (SPI) is an index based on the cumulative probability of recording a given amount of precipitation at a station. Therefore, the probability of rainfall being less or more than a certain amount can be determined (Zareiee et al., 2014). The SPI is a widely used statistical technique for the characterization of droughts and numerous studies have been conducted worldwide on drought with the SPI (Stricevic et al., 2011; Şen and Almazroui, 2021).
Comparative analysis showed that RAI is more robust than PNPI in understanding drought conditions (Ndlovu and Demlie, 2020) and PNPI was not a suitable indicator, especially for humid regions. Whereas, the Standardized Precipitation Evapotranspiration Index (SPEI) showed better performance on drought monitoring in wetter regions (Bazgeer et al., 2021). Several studies have projected increases in drought severity, extent, and duration in many parts of the world under climate change (Dewes et al., 2017).
Droughts can become disasters if the lack of water impacts vulnerable households. One of the important and basic measures in drought studies in each region is to determine the indicators based on which the severity, duration, and trend of drought can be assessed (Erfanian and Alizadeh, 2009; Jahangir et al., 2020). Undoubtedly, the first step in tackling drought and its consequences is to understand and understand this phenomenon and its implications in different dimensions so that effective strategies can be formulated and applied (Ataei et al., 2020).
Future drought outlook is of vital importance for policy- making to combat drought risk and water crises over the long term (Zeng et al., 2021). During a dry period, various local authorities, ministries of agriculture, or governments have to make important decisions about, for example, declaring disasters, subsidizing farmers for certain crops, or providing financial aid to agricultural producers, based on voluminous and diverse data about local precipitation, the yield of various crops, or the condition of soil (Stricevic et al., 2011).
Considering the importance of the drought phenomenon, the main goal of this research is to investigate the SPI meteorological drought index to evaluate the severity, trend, and continuity of drought and its final risk zoning in Fars Province in the south of Iran. the data of the studied stations were used to generalize to the entire province by interpolating IDW in the GIS environment.

2 Material and methods

2.1 Study area

This research has been done in Fars Province in the south of Iran. It covers an area of 12 million ha, which lies between the latitudes of 27°02′N and 31°43′N and the longitudes of 50°42′E and 55°36′E. Precipitation changes between 100 to 600 mm showing an average of 330 mm in the region (Masoudi and Afrough, 2011). This province has 8.6 million ha of rangeland, 1.2 million ha of forest, and 1.6 million ha of cropland. The climate in the north of this province is cold, in the central part it has mild and rainy winters and dry summers and in the south and south-east, winters are mild, and summers are hot.

2.2 Data and methodology

The meteorological data used in this study, consisting of monthly precipitation measurements for 42 meteorological stations distributed fairly evenly in the region (Fig. 1), were collected from the Iran Meteorological Organization and Regional Water Organization of Fars Province. An exhaustive list of the selected stations is given in Table 1.
Fig. 1 Scattering of stations in Fars Province
Table 1 Name of the selected stations over the study area
Code Name Latitude (°N) Longitude (°E) Code Name Latitude (°N) Longitude (°E)
1 Abadeh 31.16 52.65 22 Jahrom 28.48 53.53
2 Abadeh Tashk 29.81 53.73 23 Juyom 28.26 53.98
3 Asman Jord 28.91 53.31 24 Kalani-Abdouei 29.59 51.88
4 Baba Arab 28.58 53.77 25 Khanik 29.07 52.03
5 Bachon 28.93 52.25 26 Khonj 27.89 53.43
6 Bande Amir 29.78 52.85 27 Kohenjan 29.23 52.96
7 Bavanat 30.47 53.63 28 Lar 27.65 54.28
8 Beriz 27.96 54.33 29 MahmudAbad-Maharlu 29.38 52.80
9 Beyram 27.43 53.51 30 Meymand 28.87 52.75
10 Bidzard Kazeroun 29.35 51.87 31 Nour Abad 30.12 51.52
11 Dehram 28.49 52.30 32 Qatruyeh 29.15 54.70
12 Dejak dehno 30.31 51.40 33 Qir- Karzin 28.48 53.04
13 Deris Shapur 29.68 51.58 34 Richi 29.50 52.17
14 Didehban 27.54 53.73 35 Roniz 29.19 53.77
15 Dorudzan Dam 30.21 52.42 36 Rostagh 28.45 55.07
16 Emadeh 27.45 53.86 37 Sheshdeh 28.95 54.00
17 Evaz 27.76 54.01 38 Sheshpir 30.21 52.04
18 Fasa 28.95 53.63 39 Shiraz 29.61 52.53
19 Fedagh 27.59 53.57 40 Sivand 30.08 52.92
20 Ghalat 29.83 52.33 41 Tanghe Boragh 30.63 52.05
21 Ij 29.02 54.24 42 Zarghan 29.78 52.70

2.3 Standard Precipitation Index and hazard assessment of drought

Using this index is one of the simplest methods to assess the severity of drought, which is useful for the initial expression of this phenomenon. The equation of the index is as follows (Asrari and Masoudi, 2014):
$S P I=\frac{P_{i}-\bar{P}}{S D}$
where Pi is the annual rainfall, P ¯is the average rainfall, SD is the standard deviation of annual precipitation in the period.
For each station, we checked the normality of the data using the Kolmogorov-Smirnoff test and the “Normality Test” option in the SPSS 22 software. We analyzed the P-values and found that values above 0.05 indicate a normal distribution of data within the period of record, while values below 0.05 indicate a non-normal distribution. According to our assessment, 90% of the stations had normal data, which was acceptable for the assessment.
The synoptic stations’ statistics were analyzed to determine the annual Standardized Precipitation Index (SPI) values using Formula (1). To assess drought risk, we used three indicators severity, trend, and duration of drought. A year was classified as a dry year if the SPI value was less than -0.5, with the classification presented in Table 2. The drought severity hazard class was determined based on the minimum SPI value in the study period, according to Table 2. Furthermore, the duration of drought was determined based on the maximum number of consecutive drought years during the study period. We calculated the drought trend by analyzing the first and second half of the study period (Asrari and Masoudi, 2014):

Trend=[(Percentage of the second half-Percentage of the first half)/(Percentage of the first half)]×100

Table 2 Criteria used for the hazard assessment of drought using SPI (Werick et al., 1994; Asrari et al., 2012)
Indicators Class limits and their rating score
None (1) Slight (2) Moderate (3) Severe (4) Very severe (5)
Maximum severity of drought in the period >-0.50 -0.99 to -0.50 -1.49 to -1.00 -1.99 to -1.50 ≤-2.00
Percentage of increasing trend ≤0 1-32 33-65 66-99 ≥100
Maximum number of sequential arid years in the period 0-1 2 3 4-5 ≥6
Finally, using Table 3, the final drought risk map was obtained by calculating the arithmetic mean of the hazard class intensity, continuity and trend based on Formula 3 in Fars Province according to the SPI indicator (Asrari et al., 2012).
Table 3 The severity classes of hazard map produced in the GIS
Class None (1) Slight (2) Moderate (3) Severe (4) Very severe (5)
Hazard score <1.49 1.50-2.49 2.50-3.49 3.50-4.49 ≥4.50

Hazard score for drought=(Maximum severity of drought+Trend of drought+Maximum number of sequential arid years)/3

2.4 Preparation of indicators and final hazard maps by IDW interpolation

The final risk of drought is obtained by averaging the indicators including severity, duration and trend. To prepare the maps, after entering the data in ArcMap, the drought indicators (severity, duration, trend) and the final risk of drought in the entire province are done with the IDW interpolation method.
To determine the interpolation method, there are various methods such as nearest neighbor, trend, kriging, and inverse distance weightage (IDW), which was chosen as the interpolation method of this research according to the number of available points and previous tests. Of course, this method has many advantages, including the most widely used and successful interpolation methods, which are fast and can be modified for specific tasks (Masoudi, 2018).
The IDW method works as follows: The value of each unknown cell is equal to the weighted average of the distance of the known points around it. According to this definition, the greater the distance between the known point and the unknown point, the less impact it has, and vice versa.
The general equation for IDW is (Masoudi, 2018):
x = i = 1 n z i   w i i = 1 n w i
where x is the unknown point to be estimated, as an evaluation object; zi represents the control value for the i-th sample point, and wi is a weight that defines the relative importance of the individual control value zi in the interpolation procedure.

3 Results

After applying the IDW method for interpolation and classifying the results according to Tables 2 and 3, we calculated the area under hazard classes and obtained the following results. Among the hazard criteria maps used in the model, the map for “maximum severity of drought” was found to be the most hazardous. In this map, about 91% of the area falls under the severe and very severe classes, indicating that most parts of the study area have experienced the worst droughts during the study period. Figures 2 and 3 provide a visual representation of the hazard criteria maps used in the model.
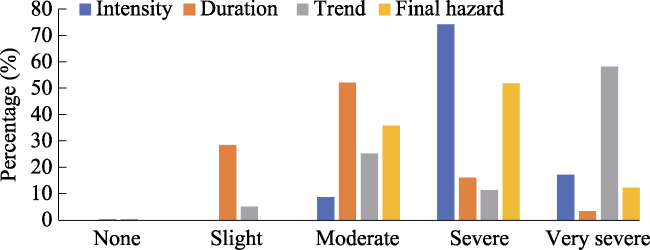
Fig. 2 Percent area under hazard classes of three criteria used in the model of drought in the region
Fig. 3 Drought intensity based on SPI index
Figures 2 and 4 indicate that almost 70% of the area in the “trend of drought” hazard map is under severe and very severe classes, which suggests that most parts of the region have experienced an increasing trend of drought in recent years during the second part of the study period compared to the first part. The hazardous areas with severe and very severe hazard classes are observed more in the middle and northern parts of the province.
Fig. 4 Drought trend based on SPI index
On the other hand, the “maximum number of sequential arid years” hazard map, shown in Figs. 2 and 5, is found to be the least hazardous among the three criteria used in the model. The majority of this hazard map falls under the moderate hazard class (52%), indicating that the period of droughts did not continue for a long duration (more than three years) in most parts of the region. The hazardous areas with severe and very severe hazard classes are observed more in the northwestern parts of the province.
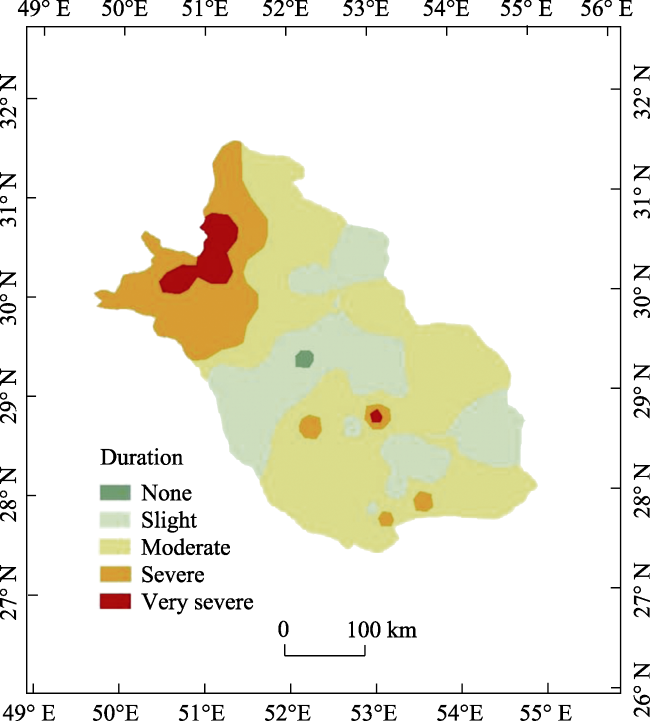
Fig. 5 Duration of drought based on SPI index
The final hazard map of Fars Province, as shown in Figs. 2 and 6, suggests that a smaller proportion (36%) of the area is under moderate hazard of drought, while the majority of the region is under severe and very severe risk classes of drought (64%). The hazardous areas are observed more in the middle and northern parts of the province, particularly in the northwestern parts, where the very severe and severe hazard classes are more prevalent.
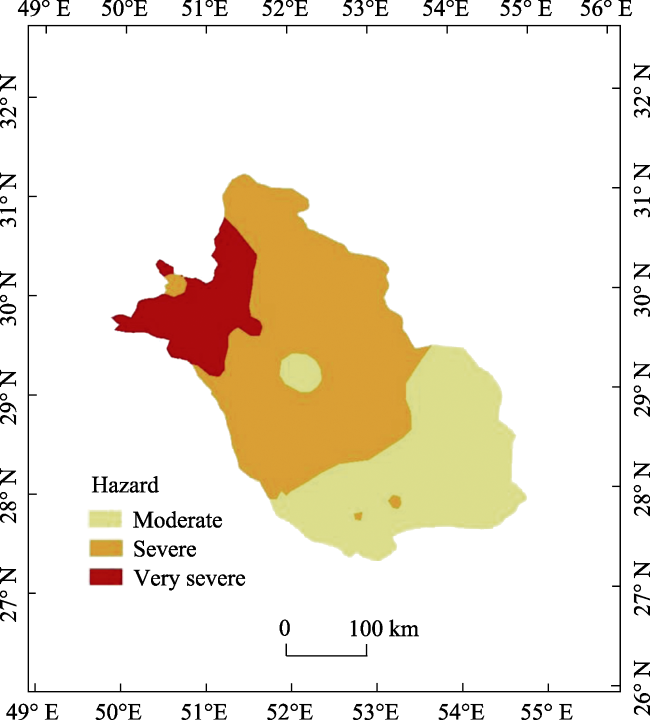
Fig. 6 Hazard map of drought vulnerability in the region
Additionally, the analysis of the RMSE and R-Pearson between predicted values and actual values in the final hazard map indicates that the IDW interpolation method used for assessing the risk of drought produced a good- quality hazard map. The RMSE and R-Pearson values are 0.428 and 0.767, respectively, and significant at the 0.01 level.
Figure 7 presents an analysis of the spatial variations of the hazard degree of the drought criteria and the final hazard. In all maps, there is an increasing trend of hazard degree from the eastern parts to the western parts. Similarly, this trend of increasing hazard degree is observed from the southern parts to the northern parts for all criteria and the final hazard, except for the duration of hazard, where the southern and especially the northern parts have more hazard duration than the middle parts.
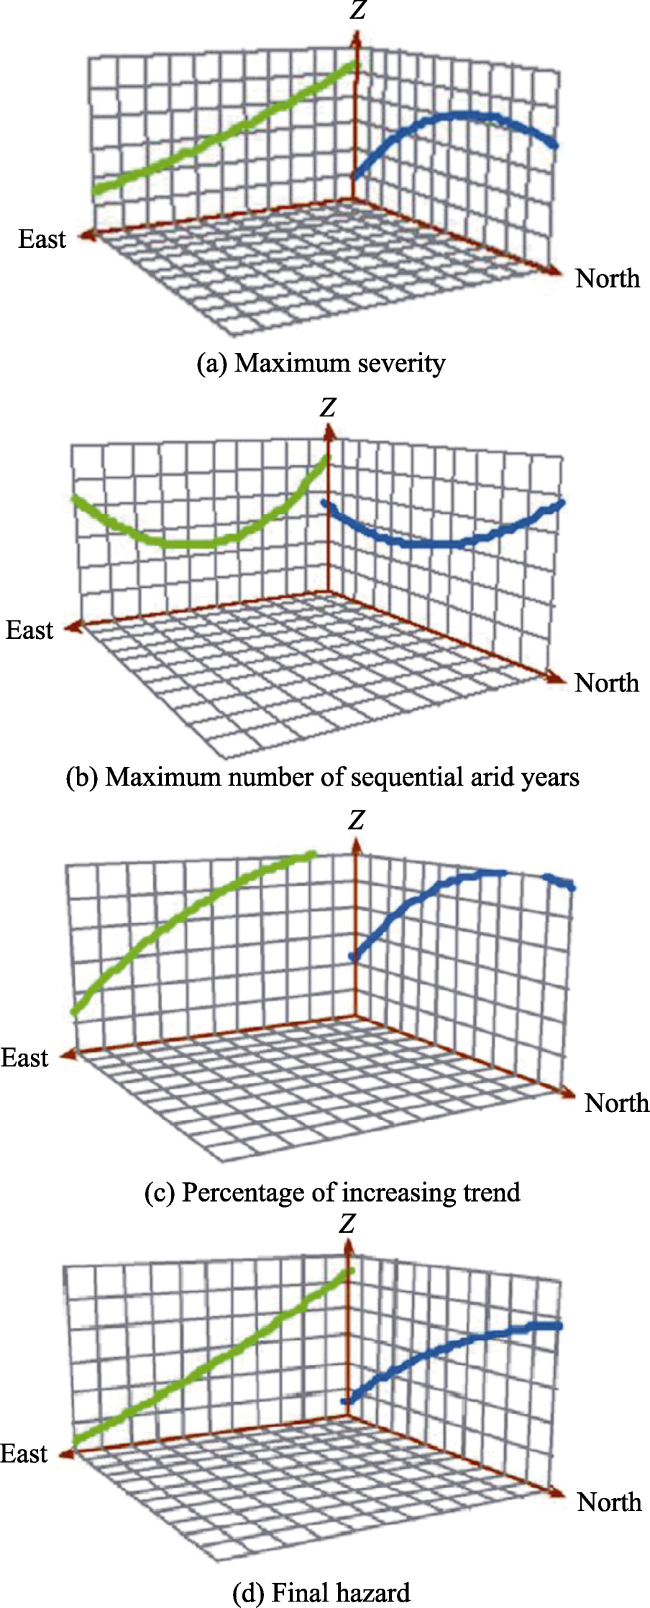
Fig. 7 Trend analysis of spatial variations of drought. (a) Maximum severity; (b) Maximum number of sequential arid years; (c) Percentage of increasing trend; (d) Final hazard
Table 4 presents the correlation table of the calculated criteria. The table indicates that the final hazard has a significant relationship at the 0.01 level with duration, intensity, and trend factors, particularly with the trend factor. Furthermore, the only relation found between criteria is between intensity and trend.
Table 4 Correlation among different calculated criteria and final hazard of drought
Variable Criteria Intensity Duration Trend Final hazard
Intensity Pearson correlation 1 0.077 0.364* 0.587**
Sig. (2-tailed) 0.627 0.018 0.000
N 42 42 42 42
Duration Pearson correlation 0.077 1 0.094 0.596**
Sig. (2-tailed) 0.627 0.555 0.000
N 42 42 42 42
Trend Pearson correlation 0.364* 0.094 1 0.800**
Sig. (2-tailed) 0.018 0.555 0.000
N 42 42 42 42
Final hazard Pearson correlation 0.587** 0.596** 0.800** 1
Sig. (2-tailed) 0.000 0.000 0.000
N 42 42 42 42

Note: * Correlation is significant at the 0.05 level (2-tailed); ** Correlation is significant at the 0.01 level (2-tailed).

4 Discussion and conclusions

Most studies done so far in Iran and the world have based their estimation on the ‘present state’ of the hazard of drought during a specific year using some indices like SPI and PNPI (Ensafi Moghaddam, 2007; Raziei et al., 2007). Such Indicator maps or information alone based on the present state of hazard derived from the specific year are inadequate to show those areas that are more vulnerable to the hazard (Masoudi et al., 2007).
Annual precipitation data for 42 meteorological stations from 1990-2019 in Fars Province have been analyzed for vulnerability assessment of drought. Three criteria for drought were studied and considered to define areas under vulnerability using the SPI index. Drought hazard criteria used in the present model include the maximum severity of drought in the period, the trend of drought, and the maximum number of sequential arid years.
“Maximum severity of drought” is the most hazardous indicator among the hazard criteria maps used in the model. Most parts of the study area are under severe and very severe classes. Other results regarding drought intensity evaluation in different parts of Iran show the same results (Ensafi Moghaddam, 2007; Raziei et al., 2007; Sarhadi et al., 2008; Zarei et al., 2021b; Darand and Pazhoh, 2022).
Most parts of the study area in the ‘trend of drought’ hazard map are under severe and very severe classes, showing an increasing trend for this indicator. These results confirm those studies showing climate change is going to drier conditions in many parts of region and country (Asrari and Masoudi, 2010; Masoudi and Hakimi, 2014; Masoudi and Elhaeesahar, 2016; Jokar and Masoudi, 2018; Zarei et al., 2021b). Also, many other studies all over the world show that the drought trend is increasing (Jehanzaib et al., 2020; Zhang et al., 2020; Hoque et al., 2021).
On the other hand, the ‘maximum number of sequential arid years’ shows the least hazardous among the three criteria used in the model. Most parts of the study area are under the moderate hazard class, indicating the period of droughts do not continue for more than three years. It is really like what Asrari and Masoudi (2014) also represented that duration criteria covered 69% of the area in the moderate class. This aspect of drought was used alone to show the risk of drought in some studies, showing the importance of this indicator in the hazard evaluation (Feiznia et al., 2001; Zehtabian et al., 2002).
Overall results derived from the final hazard map of drought based on this kind of classification indicate that areas under severe hazard are more extensive than the other hazard classes and show that the process of climate change in the Fars Province is going to drier conditions. The hazardous area is detected more in the central and the northern parts of the study area mainly in the north-western parts with very severe hazard class. According to the maps of the study area, wetlands of the region are more exposed to drought, which can be seen in other similar articles (Jahangir et al., 2020).

Acknowledgement

We are grateful to all of the National Offices and Organizations for providing the data for monitoring the work.
[1]
Arul Prasad S, Maragatham N, Guhan V, et al. 2019. Assessment of occurrence and frequency of drought by percent normal precipitation index (PNPI) for western zone of Tamil Nadu. Journal of Pharmacognosy and Phytochemistry, (S2): 850-852.

[2]
Asrari E, Masoudi M. 2010. Hazard assessment of climate changes, a case study area: Fars Province, Iran. International Pollution Research, 29(2): 275-281.

[3]
Asrari E, Masoudi M. 2014. A new methodology for drought vulnerability assessment using SPI (Standardized Precipitation Index). International Journal of Scientific Research in Knowledge, 2(9): 425-432.

DOI

[4]
Asrari E, Masoudi M, Hakimi S S. 2012. GIS overlay analysis for hazard assessment of drought in Iran using Standardized Precipitation Index (SPI). Journal of Ecology and Field Biology, 35(4): 323-329.

[5]
Ataei Y, Ghanbari S, Fotohi S. 2020. The impact of two decades of climate drought (1991-2011) on developmental instability in Heshiwar Village, Darab County. Regional Planning, 11(42): 170-188.

[6]
Ault T R. 2020. On the essentials of drought in a changing climate. Science, 368(6488): 256-260.

DOI PMID

[7]
Barbarossa V, Bosmans J, Wanders N, et al. 2021. Threats of global warming to the world’s freshwater fishes. Nature Communications, 12(1): 1-10.

DOI

[8]
Bazgeer S, Asadi Oskouei E, Abbasi F, et al. 2021. Comparative study of efficiency of some meteorological drought indices in different climate regions of Iran. Iranian Journal of Soil and Water Research, 51(11): 2751-2760.

[9]
Belal A A, El-Ramady H R, Mohamed E S, et al. 2014. Drought risk assessment using remote sensing and GIS techniques. Arabian Journal of Geosciences, 7(1): 35-53.

DOI

[10]
Chandrasekara S S, Kwon H H, Vithanage M, et al. 2021. Drought in South Asia: A review of drought assessment and prediction in South Asian countries. Atmosphere, 12(3): 369. DOI: 10.3390/atmos12030369.

[11]
Dai M, Huang S, Huang Q, et al. 2020. Assessing agricultural drought risk and its dynamic evolution characteristics. Agricultural Water Management, 231: 106003. DOI: 10.1016/j.agwat.2020.106003.

[12]
Darand M, Pazhoh F. 2022. Spatiotemporal changes in precipitation concentration indicators over Iran during 1962-2019. Climatic Change, 173(3): 1-22.

DOI

[13]
Dewes C F, Rangwala I, Barsugli J J, et al. 2017. Drought risk assessment under climate change is sensitive to methodological choices for the estimation of evaporative demand. Plos One, 12(3): e0174045. DOI: 10.1371/journal.pone.0174045.

[14]
Ensafi Moghaddam T. 2007. An investigation and assessment of climatological indices and determination of suitable index for climatological droughts in the Salt Lake Basin of Iran. Iranian Journal of Range and Desert Research, 14(2): 271-288.

[15]
Erfanian M, Alizadeh A. 2009. Investigating the situation of droughts in Razavi Khorasan Province. Journal of Geography and Regional Development, 13(7): 1-17.

[16]
Feiznia S, Gooya A N, Ahmadi H, et al. 2001. Investigation on desertification factors in Hossein-Abad Mish Mast Plain and a proposal for a regional model. Journal of Biaban, 6(2): 1-14.

[17]
Gupta A, Rico-Medina A, Caño-Delgado A I. 2020. The physiology of plant responses to drought. Science, 368(6488): 266-269.

DOI PMID

[18]
Hoque M A A, Pradhan B, Ahmed N, et al. 2021. Agricultural drought risk assessment of Northern New South Wales, Australia using geospatial techniques. Science of the Total Environment, 756: 143600. DOI: 10.1016/j.scitotenv.2020.143600.

[19]
Jahangir M H, Abolghasemi M, Mousavi Reineh S M. 2020. Application of Artificial neural networks to the simulation of climate elements, drought forecast by two indicators of SPI and PNPI, and mapping of drought intensity: Case study of Khorasan Razavi. Journal of Renewable Energy and Environment, 7(2): 19-26.

[20]
Jehanzaib M, Sattar M N, Lee J H, et al. 2020. Investigating effect of climate change on drought propagation from meteorological to hydrological drought using multi-model ensemble projections. Stochastic Environmental Research and Risk Assessment, 34(1): 7-21.

DOI

[21]
Jokar P, Masoudi M. 2018. Analyzing spatial pattern of drought in Iran, using Percent of Normal Index (PNI). Fresenius Environmental Bulletin, 27: 2011-2018.

[22]
Kalura P, Pandey A, Chowdary V, et al. 2021. Assessment of hydrological drought vulnerability using geospatial techniques in the Tons River Basin, India. Journal of the Indian Society of Remote Sensing, 49: 2623-2637.

DOI

[23]
Kim J W, Lu Z, Kaufmann J. 2019. Evolution of sinkholes over Wink, Texas, observed by high-resolution optical and SAR imagery. Remote Sensing of Environment, 222: 119-132.

DOI

[24]
Liu C, Yang C, Yang Q, et al. 2021. Spatiotemporal drought analysis by the Standardized Precipitation Index (SPI) and Standardized Precipitation Evapotranspiration Index (SPEI) in Sichuan Province, China. Scientific Reports, 11(1): 1-14.

DOI

[25]
Masoudi M. 2018. Land use planning using computer‏. Tehran, Iran: Payame Noor University Publisher.

[26]
Masoudi M, Afrough E. 2011. Analyzing trends of precipitation for humid, normal and drought classes using Standardized Precipitation Index (SPI), a case of study: Fars Province, Iran. International Journal of AgriScience, 1(2): 85-96.

[27]
Masoudi M, Elhaeesahar M. 2016. Trend assessment of climate changes in Khuzestan Province, Iran. Natural Environment Change, 2: 143-152

[28]
Masoudi M, Hakimi S. 2014. A new model for vulnerability assessment of drought in Iran using Percent of Normal Precipitation Index (PNPI). Iranian Journal of Science & Technology, Transaction A: Science, 38: 435-440.

[29]
Masoudi M, Patwardhan A, Gore S. 2007. Risk assessment of lowering of ground water table using GIS for the Qareh Aghaj sub basin, Southern Iran. Journal of the Geogical Society of India, 70: 861-872.

[30]
Naumann G, Cammalleri C, Mentaschi L, et al. 2021. Increased economic drought impacts in Europe with anthropogenic warming. Nature Climate Change, 11(6): 485-491.

DOI

[31]
Ndlovu M S, Demlie M. 2020. Assessment of meteorological drought and wet conditions using two drought indices across KwaZulu-Natal Province, South Africa. Atmosphere, 11(6): 623. DOI: 10.3390/atmos11060623.

[32]
Raziei T, Daneshkar Arasteh P, Akhtari R, et al. 2007. Investigation of meteorological droughts in the Sistan and Balouchestan provinces, using the Standardized Precipitation Index and Markov Chain Model. Iran-Water Resources Research, 3: 25-35.

[33]
Safarianzengir V, Sobhani B, Asghari S. 2020. Modeling and monitoring of drought for forecasting it, to reduce natural hazards atmosphere in western and north western part of Iran. Air Quality, Atmosphere and Health, 13(1): 119-130.

[34]
Şen Z, Almazroui M. 2021. Actual precipitation index (API) for drought classification. Earth Systems and Environment, 5(1): 59-70.

DOI

[35]
Sharafi L, Zarafshani K, Keshavarz M, et al. 2020. Drought risk assessment: towards drought early warning system and sustainable environment in western Iran. Ecological Indicators, 114: 106276. DOI: 10.1016/j.ecolind.2020.106276.

[36]
Song Y, Park M. 2021. A study on the appropriateness of the drought index estimation method using damage data from Gyeongsangnamdo, South Korea. Atmosphere, 12(8): 998. DOI: 10.3390/atmos12080998.

[37]
Stricevic R, Djurovic N, Djurovic Z. 2011. Drought classification in Northern Serbia based on SPI and statistical pattern recognition. Meteorological Applications, 18(1): 60-69.

DOI

[38]
Swain S, Mishra S, Pandey A. 2021. A detailed assessment of meteorological drought characteristics using simplified rainfall index over Narmada River Basin, India. Environmental Earth Sciences, 80(6): 1-15.

DOI

[39]
Swain S, Patel P, Nandi S. 2017. Application of SPI, EDI and PNPI using MSWEP precipitation data over Marathwada, India. IEEE International Geoscience and Remote Sensing Symposium (IGARSS), 5505-5507. DOI: 10.1109/IGARSS.2017.8128250.

[40]
Werick W J, Willeke G, Guttman N B, et al. 1994. The national drought atlas developed. Eos, Transactions American Geophysical Union, 75(8): 89-90.

DOI

[41]
Wu B, Ma Z, Yan N. 2020. Agricultural drought mitigating indices derived from the changes in drought characteristics. Remote Sensing of Environment, 244: 111813. DOI: 10.1016/j.rse.2020.111813.

[42]
Xiao X, Gutierrez F, Guerrero J. 2020. The impact of groundwater drawdown and vacuum pressure on sinkhole development. Physical laboratory models. Engineering Geology, 279: 105894. DOI: 10.1016/j.enggeo.2020.105894.

[43]
Yue X, Tian C, Lei Y. 2021. Relieved drought in China under a low emission pathway to 1.5 °C global warming. International Journal of Climatology, 41: E259-E270.

[44]
Zarei A R, Mahmoudi M R. 2022. Assessing and predicting the vulnerability to agrometeorological drought using the Fuzzy-AHP and second-order Markov chain techniques. Water Resources Management, 36(11): 4403-4424.

DOI

[45]
Zarei A R, Mahmoudi M R, Koohi E. 2021a. Sensitivity assessment to the occurrence of different types of droughts using GIS and AHP techniques. Water Resources Management, 35(11): 3593-3615.

DOI

[46]
Zarei A R, Shabani A, Moghimi M M. 2021b. Accuracy assessment of the SPEI, RDI and SPI drought indices in regions of Iran with different climate conditions. Pure and Applied Geophysics, 178(4): 1387-1403.

DOI

[47]
Zareiee A R, Masoudi M, Mahmodi A R. 2014. Analyzing spatial pattern of drought changes in Iran, using Standardized Percipetation Index (SPI). Ecology, Environment and Conservation, 20(2): 427-432.

[48]
Zehtabian G, Ahmadi H, Ekhtesasi M, et al. 2002. Intensity determination of wind in Kashan area by the desertification model. Iranian Journal of Natural Resources, 55(2): 145-157.

[49]
Zeng P, Sun F, Liu Y, et al. 2021. Mapping future droughts under global warming across China: A combined multi-timescale meteorological drought index and SOM-Kmeans approach. Weather and Climate Extremes, 31: 100304. DOI: 10.1016/j.wace.2021.100304.

[50]
Zhang L, Wang Y, Chen Y, et al. 2020. Drought risk assessment in Central Asia using a probabilistic copula function approach. Water, 12(2): 421. DOI: 10.3390/w12020421.

Outlines

/