
Journal of Resources and Ecology >
Assessment of Landslide in Singati Sub-watershed of the Sunkoshi River Basin, Nepal
|
BASNET Bhuwan, E-mail: bhuwanbasnet123@gmail.com |
Received date: 2022-11-17
Accepted date: 2023-04-20
Online published: 2024-03-14
Landslides are the major problems of mountainous areas of Nepal basically due to its fragile geomorphology, intense rainfall, improper land management practices and rapid construction of hilly roads without applying necessary stabilization measures. There are huge loss of life and property, decline in ecosystem productivity and functionality and sedimentation on downstream areas due to frequent landslides. Multiple spatial factors like land use land cover, topography, road, drainage, geological setting and climatic factors like rainfall are found more associated with landslide occurrence and determine landslide susceptibility of the area. Understanding of landslide phenomenon and associated factors are crucial for adopting appropriate prevention, control and rehabilitation measures. This study was carried out in Singati sub-watershed of Sunkoshi River Basin with objectives to understand landslide hazards, associated factors and activities performed to minimize possible hazards with best strategy of minimizing hazards. Landslide assessments were made through identification and digitization of landslides using temporal Google image and field investigation. Where landslide hazard assessment and preparation of factor map was done by using GIS software and field observed data were analyzed and dimension of landslides were calculated. Along with, People perceptions on major effects of landslides on livelihood assets, were explore from associated household's questionnaire survey (n=60) using purposive sampling. And most causative factor of landslide on the perception of local people was calculated using nonparametric test (Friedman). From the field survey, a total of 46 landslides were surveys in different location of the study area. The total area of the landslide was found to be 4.77 km2. From the comparison matrix analysis using Friedman test, the study identified the main responsible factor for the occurrence of landslide are rural road, construction, slope factor rainfall and land use. The road factor up to 200 m area and 200-500 m distance from road covered the highest percentage of landslide hazard. Southeastern aspect with the slope class 30°-45° had the highest susceptibility to landslide. Dense forest was found to be more effected by landslide in comparison to other land use due to the construction of road in sloppy area inside the forest. Comparison the effects of landslide before and after the road construction about 80 percent of the respondent had the positive response on it.
BASNET Bhuwan , JOSHI Rajeev , SHARMA Ram Prasad , SUBEDI Rajan . Assessment of Landslide in Singati Sub-watershed of the Sunkoshi River Basin, Nepal[J]. Journal of Resources and Ecology, 2024 , 15(2) : 431 -438 . DOI: 10.5814/j.issn.1674-764x.2024.02.017
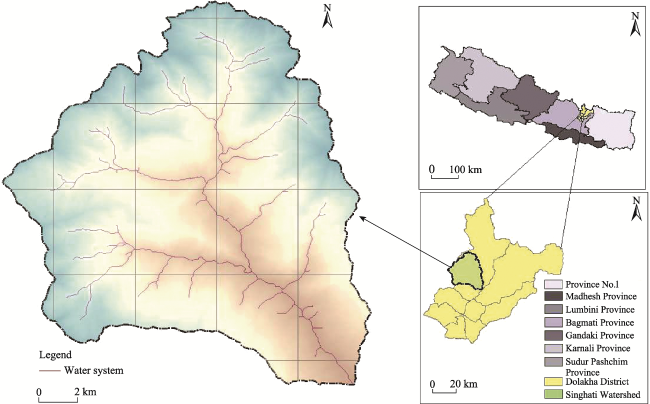
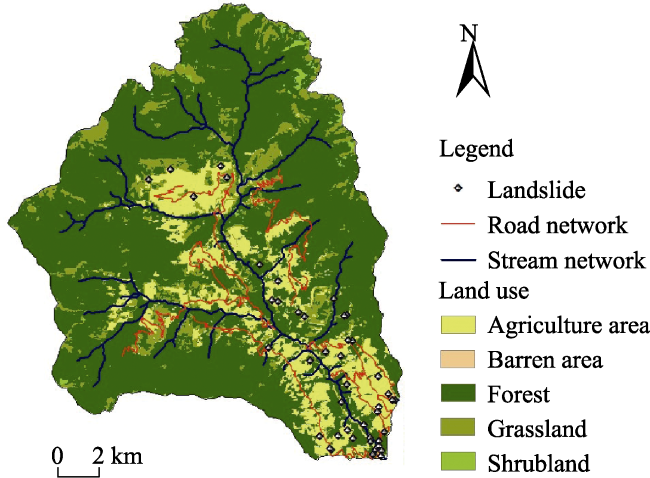
Fig. 1 Map of the study area |
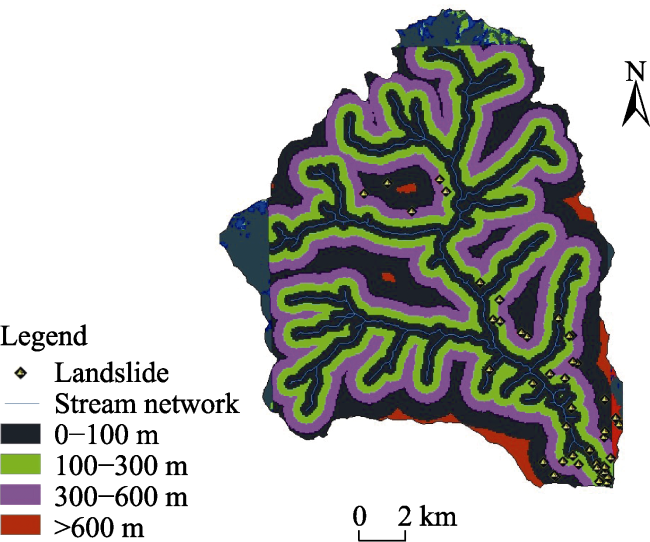
Fig. 2 Distance to stream factor map |
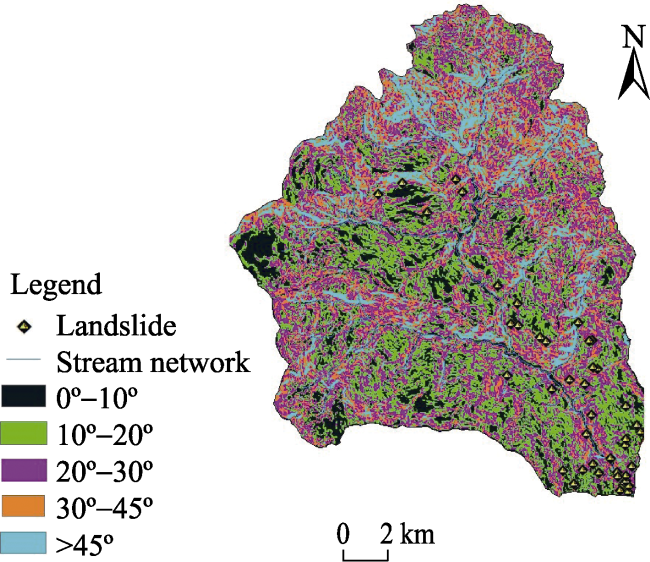
Fig. 3 Slope factor map |
Fig. 4 Road factor map |
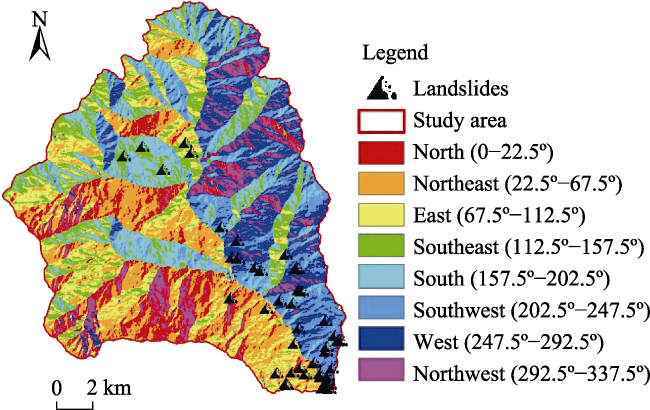
Fig. 5 Aspect factor map |
Fig. 6 LULC factor map |
Table 1 Landslide details based on distance from stream |
| Distance from stream (m) | Land area (km2) | Percentage (%) | Landslide area (km2) | Intensity | Number of landslides |
|---|---|---|---|---|---|
| 0-100 | 89.21 | 42.41 | 2.85 | 0.11 | 24 |
| 100-300 | 50.86 | 24.17 | 1.08 | 0.09 | 12 |
| 300-600 | 41.51 | 19.73 | 0.59 | 0.09 | 6 |
| >600 | 28.77 | 13.67 | 0.25 | 0.06 | 4 |
| Total | 210.35 | 100 | 4.77 | 0.37 | 46 |
Table 2 Landslide details based on slope class |
| Slope class (°) | Land area (km2) | Percentage (%) | Landslide area (km2) | Intensity | Number of landslides |
|---|---|---|---|---|---|
| 0-10 | 19.27 | 9.18 | 0.13 | 0.13 | 1 |
| 10-20 | 60.04 | 28.61 | 0.31 | 0.07 | 4 |
| 20-30 | 60.96 | 29.05 | 0.67 | 0.04 | 14 |
| 30-45 | 42.01 | 20.02 | 2.39 | 0.12 | 19 |
| > 45 | 27.49 | 13.10 | 1.27 | 0.15 | 8 |
| Total | 209.79 | 100 | 4.77 | 0.51 | 46 |
Table 3 Landslide details based on the distance from road |
| Distance to road class (m) | Land area (km2) | Percentage (%) | Landslide area (km2) | Number of landslides |
|---|---|---|---|---|
| 0-200 | 14.56 | 6.92 | 2.2 | 20 |
| 200-500 | 29.64 | 14.09 | 1.22 | 13 |
| 500-1000 | 37.87 | 18.00 | 0.73 | 7 |
| 1000-1500 | 48.76 | 23.18 | 0.51 | 4 |
| 1500-2000 | 79.52 | 37.80 | 0.11 | 2 |
| Total | 210.35 | 100 | 4.77 | 46 |
Table 4 Landslide details based on Aspect |
| Aspect class | Landslide intensity | Landslide area (km2) | Number of landslides |
|---|---|---|---|
| Northeast | 0.06 | 0.52 | 8 |
| Southeast | 0.11 | 1.14 | 10 |
| Southwest | 0.14 | 2.48 | 17 |
| Northwest | 0.67 | 0.63 | 9 |
| Total | 0.98 | 4.77 | 46 |
Table 5 Land use system and landslide details |
| Land use | Class area (km2) | Landslide area (km2) | Intensity | Number of landslide |
|---|---|---|---|---|
| Agriculture | 30.83 | 0.57 | 0.03 | 17 |
| Forest | 156.39 | 1.77 | 0.14 | 12 |
| Shrub land | 2.59 | 0.86 | 0.12 | 7 |
| Grassland and barren land | 20.03 | 1.57 | 0.15 | 10 |
| Total | 209.84 | 4.77 | 0.44 | 46 |
Table 6 People’s perception on landslide triggering factor |
| Factors | Rank (%) | Mean rank | Friedman n value | df | P-value | ||||
|---|---|---|---|---|---|---|---|---|---|
| 1 | 2 | 3 | 4 | 5 | |||||
| Rural road construction | 72.22 | 19.44 | 2.78 | 5.56 | 0 | 4.58 | 98.822 | 4 | <0.05 |
| Slope | 16.66 | 55.56 | 19.44 | 8.38 | 0 | 3.81 | |||
| Heavy rainfall | 5.56 | 22.22 | 47.22 | 25 | 0 | 3.80 | |||
| Distance to stream | 2.77 | 2.77 | 27.78 | 61.12 | 5.56 | 2.36 | |||
| Land use/land cover | 2.78 | 02 | 2.78 | 0 | 94.44 | 1.17 | |||
Table 7 Ranking landslide’s problem on productivity |
| Rank | Causes | Mean rank | Friedman n value | df | P-value |
|---|---|---|---|---|---|
| 1 | Soil deposition in agriculture field | 4.19 | 48.517 | 4 | <0.001 |
| 2 | Topsoil removal | 3.56 | |||
| 3 | Destruction the irrigation cannel | 2.92 | |||
| 4 | Quality seed | 2.33 | |||
| 5 | Insect and pests attack | 2 |
Table 8 Inter correlation between the seven-risk perception items. |
| Items | 1 | 2 | 3 | 4 | 5 | 6 | 7 |
|---|---|---|---|---|---|---|---|
| 1. Likelihood | 0.108 | -0.006 | -0.389* | 0.250** | 0.193 | 0.217 | |
| 2. Know mitigation action | 0.333** | 0.088 | 0.027 | 0.025 | -0.057 | ||
| 3. Able to control huge loss | 0.15 | 0.013 | 0.133 | 0.05 | |||
| 4. Threaten life quality | 0.680** | 0.550** | 0.227 | ||||
| 5. Affect the life quality | 0.729** | 0.155 | |||||
| 6. Financial loss | 0.032 | ||||||
| 7. Dread |
Note: *P<0.05, **P<0.01. The numbers are Spearman’s correlation coefficient and asterisks indicate significance. |
| [1] |
|
| [2] |
|
| [3] |
|
| [4] |
|
| [5] |
|
| [6] |
|
| [7] |
|
| [8] |
|
| [9] |
|
| [10] |
|
| [11] |
|
| [12] |
|
| [13] |
|
| [14] |
|
| [15] |
|
/
| 〈 |
|
〉 |
