Urban-Rural Integration and Green Development

Evolution Characteristics and Influencing Factors of the Human-Earth System in Minority Areas of Yunnan, China

  • TAI Lingjuan , 1, 2, * ,
  • YANG Hongjuan 2
Expand
  • 1. Faculty of Tourism, Kunming University, Kunming 650214, China
  • 2. Faculty of Management and Economics, Kunming University of Science and Technology, Kunming 650093, China
*TAI Lingjuan, E-mail:

Received date: 2022-09-08

  Accepted date: 2023-03-30

  Online published: 2024-03-14

Supported by

The National Natural Science Foundation of China(71463034)

The Joint Special Fund Project of Basic Research in Local Universities of Yunnan Province of China(202101BA070001-097)

Abstract

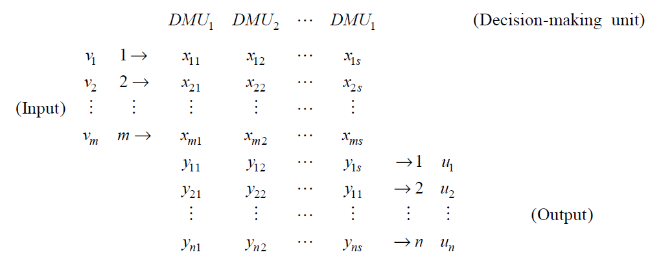
In minority areas of Yunnan, China, the ecological environment is fragile, and social and economic development is not sufficient. The research on the evolution of human-earth systems can provide scientific guidance for solving the contradiction between environmental protection and social and economic development and promoting high-quality regional development. In this study, based on the structural division of the human-earth system, we established a comprehensive evaluation model by the data envelopment analysis (DEA) to analyze the evolution characteristics and influencing factors of the man-earth system in minority areas of Yunnan in terms of the coordinated development degree and the comprehensive efficiency of the system. The results show that: (1) From 1995 to 2020, the coordinated development degree of the human-earth system in minority areas of Yunnan showed an overall upward trend, with the average value rising from 0.31 in 1995 to 0.74 in 2020. (2) The average comprehensive efficiency of inputs and outputs of the human-earth system showed a downward trend; in particular, after 2007, the number of regions with ineffective DEA gradually increased, indicating that the development model of high inputs and consumption has not been effectively changed. (3) By calculating the system indicator weights using the entropy method, we found that the comprehensive utilization rate of industrial solid waste, total foreign trade and urbanization rate greatly impacted the coordinated development efficiency of the human-earth system in minority areas of Yunnan.

Cite this article

TAI Lingjuan , YANG Hongjuan . Evolution Characteristics and Influencing Factors of the Human-Earth System in Minority Areas of Yunnan, China[J]. Journal of Resources and Ecology, 2024 , 15(2) : 372 -384 . DOI: 10.5814/j.issn.1674-764x.2024.02.011

1 Introduction

With the rapid development of the global economy, the contradiction between human demand and resource supply has become increasingly prominent. As early as 1980, the International Union for Conservation of Nature proposed to study the basic relations among nature, society, ecology, economy and natural resource use to ensure the sustainable development of the world in the World Conservation Strategy. To achieve sustainable development, no country or region can avoid the coordination and integration of resources, environment, economy and society.
In recent years, the rapid economic accumulation in minority areas of Yunnan, China, relying on their rich natural resources, has resulted in a dramatic deterioration in local human-earth relationships. Faced with the increasingly prominent contradiction between “human” and “earth”, minority areas of Yunnan should not only seek their own development but also bear the great responsibility of protecting ecological security.
Formation process and structural characteristics are the emphasis of geography on the study of human-earth system (Wu, 1991). The research field of the human-earth system extends from the initial geosciences to environmental science, ecology, economics, etc., with the generation of concepts such as carrying capacity (Zhang et al., 2020; Xiong et al., 2022), ecological footprint (Rees, 2017; Jing and Guo, 2021), coupling degree (Wang, 2021; Weng et al., 2021), and coordinated development degree (Liao, 1999; Wu and Yuan, 2018). Its research methods tend to the application of the multi-disciplinary integrated intersectional theory, such as exploring the interaction, dynamic optimization and regulation demonstration of various elements in human- earth system of different geographical types through integrated methods which include the input-output model (Cumberland, 1966; Robert, 1968; Wassily, 1974), system dynamics model (Fang, 2000), coupling degree model (Yang et al., 2020; Li et al., 2021) and coordination degree model (Ren et al., 2021; Sun, 2021). Scholars have explored the interaction between a single subsystem and two subsystems in the human-earth system. However, the relationships between the natural, economic and social systems have not been sufficiently studied. The studies have focused mainly on measuring the coordinated development of the system and paid less attention to the efficiency of the system development. The study of the human-earth system is a multi-objective decision-making process in which detailed ecological, economic and social objectives should be formulated to maximize the comprehensive benefits of the system. Therefore, it is more objective to measure the coordinated development quality of the regional human-earth system by incorporating the indicators of the social subsystem into the measurement system and studying the coordinated development level from the perspective of the overall efficiency of the system.
Based on this, in this study, the efficiency theory was introduced to consider the degree of development, coordination and comprehensive efficiency. We comprehensively analyzed the characteristics and influencing factors of the development of the human-earth system in minority areas of Yunnan, aiming to provide a reference for formulating regional development strategies.

2 Study area

The minority areas of Yunnan studied include the eight minority autonomous prefectures, namely Chuxiong Yi Autonomous Prefecture, Honghe Hani-Yi Autonomous Prefecture, Wenshan Zhuang-Miao Autonomous Prefecture, Xishuangbanna Dai Autonomous Prefecture, Dali Bai Autonomous Prefecture, Dehong Dai-Jingpo Autonomous Prefecture, Nujiang Lisu Autonomous Prefecture and Diqing Tibetan Autonomous Prefecture (Hereinafter Referred to as Chuxiong, Honghe, Wenshan, Xishuangbanna, Dali, Dehong, Nujiang and Diqing, respectively), designated by the state (Fig. 1).
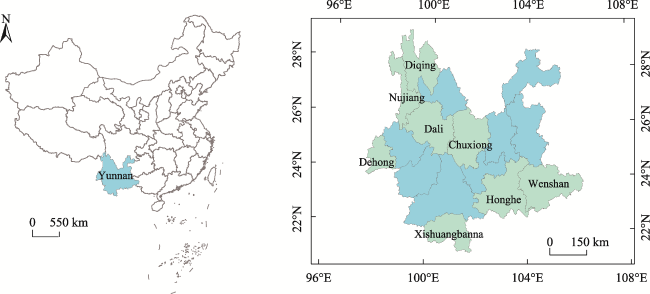
Fig. 1 Distribution diagram of Yunnan minority autonomous prefecture
Yunnan is a plateau and mountainous province. The area of mountains and plateaus accounts for 94% of that of the province. Most ethnic minorities live in mountainous areas. The complex landform and diverse climate environment have nurtured rich natural resources but led to poor stability of ecosystems, low resistance to external interference and poor self-recovery in these areas. In addition, development has been of low quality for a long term, and resources have been extensively exploited. Therefore, most minority areas are prone to natural disasters. Rigid factors, such as marginalized location, harsh natural environment and backward transportation conditions, hinder the axial radiation of cities to minority areas, increase the distribution difficulty and circulation costs of commodities, restrict the dissemination of culture and information, and enhance the difficulty of economic and social development in minority areas. Currently, the average level of economic development in minority areas of Yunnan still falls behind that in China. In terms of gross national product per capita, the difference between minority areas of Yunnan and the nation in 2021 is 51084 yuan, with a gap of 11.4%. The development levels of education and health care in these areas are also lower than the national average levels, showing weak human development index (Ren et al., 2020).

3 Materials and methods

3.1 Establishment of the evaluation indicator system

Based on previous research (Cai, 1997; Song et al., 2000; Huang et al., 2021) combined with the current situation of Yunnan Province, we defined the coordinated development of the human-earth system as a sustainable development state in which natural, economic and social subsystems cooperate properly and promote each other to maximize the overall efficiency of the system.
Referring to the existing literature (Liu and Liu, 2017; Liu et al., 2019; Yin et al., 2021), based on the characteristics of the human-earth system and the selection principles of indicators, as integrity and systematicness, representativeness and independence, and availability and feasibility, we constructed a measurement indicator system of coordinated development regarding the three component model of the sustainable development indicator system (Table 1).
Table 1 Measurement indicator system of coordinated development of the human-earth system in minority areas of Yunnan
Subsystem Basic indicators Unit Indicator attribute
Natural subsystem Industrial wastewater discharge 104 t -
Industrial waste gas emission 108 m3 -
Output of industrial solid waste 104 t -
Comprehensive utilization rate of industrial solid waste % +
Afforestation area 103 ha +
Economic
subsystem
Investment in fixed assets 108 yuan +
Total retail sales of social consumer goods 108 yuan +
Gross domestic product (GDP) per capita yuan +
Total import and export volume of foreign trade 108 USD +
Proportion of tertiary industry in GDP % +
Social subsystem Urbanization rate % +
Gap between the per capita income of urban and rural residents yuan -
Proportion of social security expenditure in GDP % +
Proportion of education and treatment expenditure in GDP % +
Number of beds per thousand patients beds per thousand patients +
Teacher-student ratio in primary and secondary schools % +

Note: The indicators are divided into positive indicators (+) and negative indicators (-) according to their properties. A higher value of a positive indicator indicates a higher development level of the subsystem, while a higher value of a negative indicator indicates a lower development level of the subsystem.

3.2 Data resources

The data used in this part are mainly from the China Statistical Yearbook for Regional Economy (2000-2021), the Yunnan Statistical Yearbook (1996-2021) and Yearbooks of the Eight Minority Regions in Yunnan (2000-2021). In the process of data statistics, the data were corrected and supplemented by the exponential smoothing method and interpolation method, respectively, to address the problems of changes in statistical caliber and data missing.

3.3 Methods

3.3.1 Coordinated development degree model

Coordinated development is not the growth of a single system or element but integrated, comprehensive and endogenous diversified development (Guan and Liu, 2012). In this study, the coordinated development degree model was used to measure the coordinated development level among natural, economic, and social subsystems in minority areas of Yunnan. The specific steps are as follows:
(1) Data standardization. The selected indicators should be treated in the same direction when calculating the regional coordination degree due to their different nature. In this study, we divided the indicators into positive and negative indicators and used the piecewise function method to standardize the data.
If there are l indicators, m regions and n years, then xijk is the value of indicator i in year k of region j, and $x_{i j k}^{\prime}$ is the value of the corresponding indicator after standardization, where i = 1, 2, ···, l; j = 1, 2, ···, m; k = 1, 2, ···, n.
A positive indicator can be standardized as follows:
x i j k = x i j k min x i x ¯ i min x i × 0.49 + 0.01 , min x i x i j k x ¯ i x i j k x ¯ i max x i x ¯ i × 0.5 + 0.5 , x ¯ i x i j k max x i
A negative indicator can be standardized as follows:
x i j k = x ¯ i x i j k x ¯ i min x i × 0.5 + 0.5 , min x i x i j k x ¯ i max x i x i j k max x i x ¯ i × 0.49 + 0.01 , x ¯ i x i j k max x i
where x ¯ i is the average value of all samples of the indicator i, and max x iand min x iare the maximum and minimum values of all samples in the indicator system, respectively. In order to avoid meaningless values when taking logarithms during calculating entropy, the coordinates of the values after extreme value standardization should be translated by 0.01.
(2) Calculation of indicator weights. We used the entropy method to determine the redundancy entropy of each indicator by calculating the variance and information entropy of each indicator. Then, we calculated the weights. The steps are as follows:
The proportion of the score of indicator i in year k of region j to the total sample is represented as$y_{i j k}$, and can be calculated by the following formula:
y i j k = x i j k k = 1 n j = 1 m x i j k
The information entropy of indicator i is represented as $e_{i}$, and can be calculated by the following formula:
e i = 1 ln ( m n ) k = 1 n j = 1 m y i j k ln ( y i j k ) ( 0 e i 1 )
The redundancy entropy of indicator i is represented as $d_{i}$, and can be calculated as follows:
d i = 1 e i
The weight of indicator i in the indicator system is represented as $w_{i}$, and can be calculated as follows:
w i = d i i = 1 l d j
(3) Calculation of the development degree of each subsystem. We assume that x1, x2, ···, xl are the indicators representing the coordination degree of the natural subsystem, y1, y2, ···, ym are the indicators representing the coordination degree of the economic subsystem, and z1, z2, ···, zn are the indicators representing the coordination degree of the social subsystem, where xl, ym, zn > 0. The functions f(x), g(y), and h(z) are the development degrees of the natural, economic and social subsystems, respectively, which can be expressed as:
f ( x ) = i = 1 l a i x i g ( y ) = i = 1 l b i y i h ( z ) = i = 1 l c i z i
where a i, b i ,and c iare the undetermined weights of each indicator in the natural, economic and social subsystems, respectively, and x i, y i, and z iare the values of the system indicator data after standardization.
(4) Calculation of the coordination degree among subsystems. Based on the coordination degree model of minimizing the deviation coefficient, the coordination among the natural, economic and social subsystems in the regional human-earth system can be calculated.
The mathematical model to measure the coordination degree among the three subsystems in the regional human-earth system is as follows:
C = 3 [ f ( x ) g ( y ) + f ( x ) h ( z ) + g ( y ) h ( z ) ] [ f ( x ) + g ( y ) + h ( z ) ] 2 k
where k is the adjustment coefficient, and generally, k ≥ 2. The coordination degree value C can reflect the coordination degree of the human-earth system. In the calculation model, 0 ≤ C ≤ 1. When C = 1, the system is in optimal coordination. A smaller coordination degree C means a lower coordination degree of the system.
(5) Coordinated development degree model
The coordination degree C is an important indicator to describe the coordination degree of each subsystem in a region. However, sometimes it is difficult to effectively reflect the comprehensive quality level of the whole system. Therefore, a coordinated development degree model to measure the overall coordinated development level of the human-earth system was proposed. The calculation formula is as follows:
D = C T T = α f x + β g y + γ h z
where D is the coordinated development degree, C is the coordination degree, T is the development degree of the whole system, f(x), g(y), and h(z) are the development degrees of the natural, economic and social subsystems, respectively, and α, β, and γ are the weights of the three subsystems. In this paper, the three subsystems are regarded as equally important, so the weight of each subsystem is 1/3.

3.3.2 Coordinated development efficiency measurement model

For the whole human-earth system, higher comprehensive efficiency of the coordinated development level means a higher output (regional coordinated development level) obtained by the whole system with a lower input (human, materials, resources, etc.) and environmental cost. Therefore, a comprehensive efficiency evaluation of the regional coordinated development level is required.
In this paper, the human-earth system is regarded as a production system with multiple inputs and outputs. The evolution of the human-earth system is the process of material transformation, value transfer and reproduction among the natural, economic and social subsystems. The system operates to maximize the input-output efficiency among the three subsystems by developing and utilizing resources. Then, the data envelopment analysis (DEA) is used to analyze the coordinated development efficiency of human-earth system.
In the DEA method, the model selection is mainly based on the actual background and measurement purpose of the decision making unit (Gong et al., 2020). In this paper, we aim to study the comprehensive efficiency of the coordinated development of natural, economic and social subsystems in the human-earth system without considering the scale and technical efficiency alone. The C2R model can be used to simultaneously measure the technique and scale effectiveness of the decision-making unit (Li et al., 2017).
Therefore, according to the actual background and measurement purpose of the decision-making unit, we selected the C2R model, and took the coordinated development degree as one of the input indicators to measure the comprehensive efficiency of the development of the human-earth system in a given coordinated development state. The established model is shown in Fig. 2.
Fig. 2 Input and output model of decision-making units
The number of decision-making units is supposed to be s, and decision-making unit r is recorded as D M U r, where 1 r s. Each decision-making unit has m inputs and n outputs. x i r is the input indicator r of decision unit i (i=1, 2, ···, m). y j r is the output indicator r of decision unit j (j = 1, 2, ···, n). v i is the weight of input indicator i, and the u jis the weight of output indicator j. X r = ( x 1 r , x 2 r , , x m r ) T , x i r 0, Y r = ( y 1 r , y 2 r , , y n r ) T y j r 0, v = ( v 1 , v 2 , , v m ), and u = ( u 1 , u 2 , , u n ). Then, the efficiency measurement indicator of D M U r can be defined as:
h r = u Y r v X r , r = 1 ,   2 ,   ,   s
Taking the efficiency measurement indicator of D M U r 0 as the goal and the efficiency indicator of all decision- making units as the constraint, the C 2 R model of D M U r can be established as follows:
max u Y r v X r s . t . u Y r v X r 1 , r = 1 , 2 , , s v i 0 , u j 0
Formula (11) is a fractional programming form, which is transformed into an equivalent linear programming form using C2 transformation.
It is supposed that t = 1 / v T X 0, ω = t v and μ = t u. Thus, the fractional programming form is transformed into:
max μ T Y 0 s . t . ω T X r μ T Y 0 0 , r = 1 , 2 , , s ω T X 0 = 1 ω i 0 , μ j 0
In formula (12), ω= (ω1, ω2, ···, ωm), and μ= (μ1, μ2, ···, μn). Thus, the dual programming form of the above formula is:
θ 0 = min θ s . t . r = 1 n λ r x r + s = θ x 0 r = 1 s λ r x r + s + = y 0 λ r > 0 , r = 1 , 2 , , s s + 0 , s 0
(1) When θ = 1 and s i = s i + = 0, the input elements of the measure unit are considered to cooperate optimally, indicating that among the n measurement objects, output y0 based on input x0 is the best.
(2) When θ = 1 and s i 0, s i + 0, the input elements of the measure unit are considered weakly effective, meaning that input x0 can be reduced while the original output y0 remains unchanged, or the output can be improved s i + while the input x0 remains unchanged.
(3) If θ < 1, s i 0, and s i + 0, the coordination among the input elements of the measure unit is considered invalid, meaning that the input can be reduced to θ x 0 while the original output y 0 remains unchanged.

4 Research results and analysis

4.1 Assessment results of the development degree of the human-earth system

The indicator weights were calculated by the entropy method. The results showed that in the natural subsystem, the indicator with the highest weight was the comprehensive utilization rate of industrial solid waste (0.36); in the economic subsystem, the weight of the total import and export volume of foreign trade was the largest (0.33); in the social subsystem, the urbanization rate, with the largest weight (0.27), could well distinguish the differences in social development between regions.
From 1995 to 2020, the development degree of the natural subsystem fluctuated, with average values ranging from 0.46 to 0.60. The economic subsystem developed rapidly, with the average value rising from 0.12 in 1995 to 0.64 in 2020. For the development degree of the social subsystem, the values were low in 2005 and 2006 and increased gently in other years, with the average value rising from 0.25 in 1995 to 0.71 in 2020.

4.2 Assessment results of the coordinated development degree of the human-earth system

From 1995 to 2020, the coordinated development of the human-earth system in minority areas of Yunnan generally increased, with the average value rising from 0.31 in 1995 to 0.74 in 2020. To better reflect the relative changes in the coordinated development degrees of the human-earth system in different regions in different years, various colors are used to represent their rankings. A color that tends to be darker green indicates a more advanced ranking of the coordinated development degree; conversely, a color that tends to be darker red indicates a more backward ranking of the coordinated development degree, as shown in Table 2.
Table 2 Differences in the coordinated development degree of human-earth system in minority areas of Yunnan (1995-2020)
The analysis results in Table 2 showed that the coordinated development degrees of the human-earth system in all regions increased, but the change rates were different. The coordinated development degree of the human-earth system in Dehong was the best. Although it was slightly lower than that in Xishuangbanna or Honghe in 1997, 1998, 2003 and 2017, it ranked first among the eight regions in other years. The coordinated development degrees of the human-earth system in Honghe, Xishuangbanna, Chuxiong and Dali were at a medium level. From 1995 to 2010 (except 1997, 1998 and 2003), the coordinated development degrees in Honghe and Xishuangbanna were second only to those in Dehong. After 2011, the growth rates of the coordinated development degrees in the two regions decreased. The coordinated development degree in Honghe even showed a downward trend, while that in Chuxiong and Dali accelerated, and their rankings gradually surpassed those in Xishuangbanna and Honghe. The coordinated development degrees of the human-earth system in Wenshan, Nujiang and Diqing were poor. From 1995 to 2005, the coordinated development degree in Wenshan was always at the bottom. After 2006, with the continuous social and economic development, the coordinated development degree in this region gradually accelerated, ranking ahead of that in Nujiang and Diqing, which were backward in terms of social and economic development levels.

4.3 Assessment results of the coordinated development efficiency of the human-earth system

Based on the measurement and analysis of the coordinated development degrees, with the natural year as the decision-making unit, we selected the input and output indicators reflecting the development of the regional human-earth system from 1995 to 2017. The coordinated development status of the regional human-earth system in time series was shown.
(1) Determination of variables
The input variables include natural environment input (In-N), economic input (In-E) and social capital input (In-S). The degree of the In-N is characterized by the environmental pollution indicator, which is the average value of industrial wastewater discharge, industrial waste gas emission and the output of the industrial solid waste. It reflects the loss of the natural subsystem. The degree of the In-E is represented by the investment in fixed assets and reflects the input of the economic subsystem. The degree of the In-S is characterized by the average value of the proportion of social security expenditure in GDP and the proportion of education and treatment expenditure in GDP, reflecting the investment of the social subsystem. The output variables include natural output (Out-N), economic output (Out-E) and social output (Out-S). The degree of the Out-N is characterized by the comprehensive utilization rate of industrial solid waste, reflecting the output of the natural subsystem. The degree of the Out-E is represented by GDP per capita, reflecting the output of the economic subsystem. The degree of the Out-S is represented by the urbanization rate and reflects the output of the social subsystem. In addition, the coordinated development degree is regarded as the output indicator, meaning that the rigid constraint of the coordinated development degree must be met in the development of the human-earth system.
(2) Processing of variable data
The original data of the inputs and outputs of different dimensions X i jneed to be normalized to eliminate the adverse effects of dimensions on the measurement results. The calculation formula is as follows:
X i j = X i j min X i j max X i j min X i j × 9 + 1
where X i j is the value of each variable after normalization, and its range is [1,10].
(3) Evaluation results
We used MATLAB (2017b) to measure the comprehensive efficiency (θ) of the development of the human-earth system in minority areas of Yunnan. The calculation results are shown in Table 3.
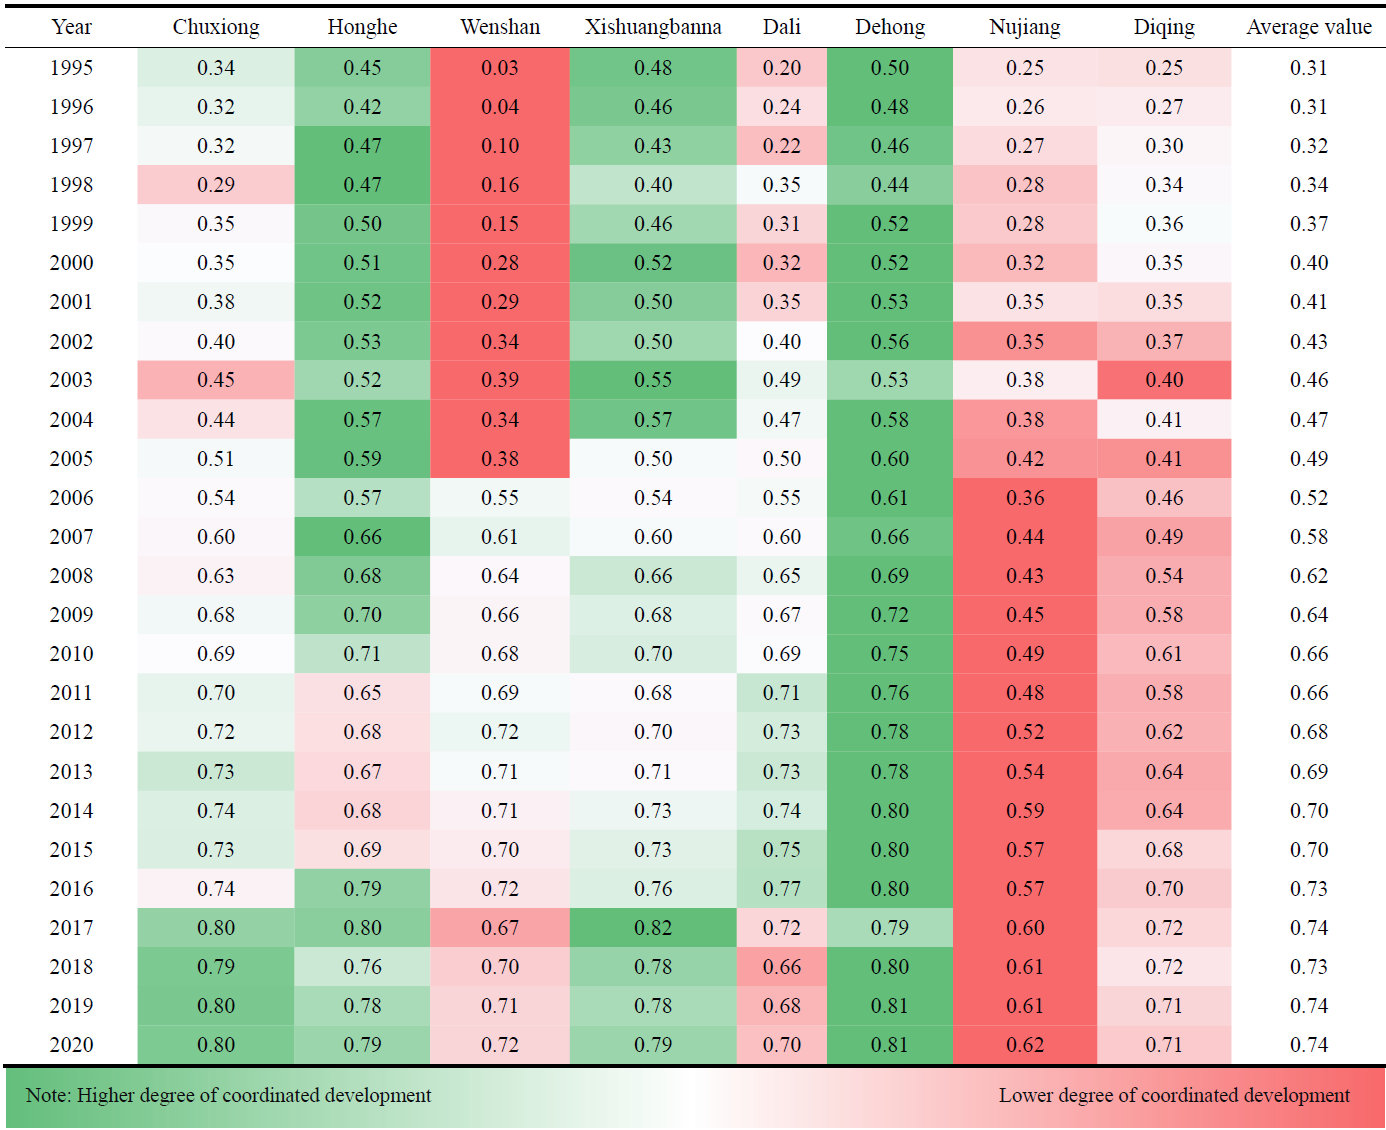
Table 3 Comprehensive efficiency value of coordinated development of the human-earth system in minority areas of Yunnan (1995-2020)
Year Chuxiong Honghe Wenshan Xishuangbanna Dali Dehong Nujiang Diqing Number of DEA effective regions
1995 1.00 1.00 1.00 1.00 0.98 1.00 1.00 0.79 6
1996 1.00 1.00 1.00 1.00 1.00 1.00 1.00 1.00 8
1997 1.00 1.00 1.00 1.00 1.00 1.00 1.00 1.00 8
1998 1.00 1.00 1.00 1.00 1.00 1.00 0.99 1.00 7
1999 1.00 1.00 1.00 1.00 1.00 1.00 1.00 1.00 8
2000 1.00 0.83 1.00 1.00 1.00 0.98 0.93 0.84 4
2001 1.00 0.83 1.00 1.00 1.00 0.98 0.83 0.89 4
2002 0.99 0.89 1.00 1.00 1.00 1.00 0.77 0.88 4
2003 1.00 1.00 1.00 1.00 1.00 1.00 1.00 1.00 8
2004 1.00 1.00 1.00 1.00 1.00 1.00 1.00 1.00 8
2005 1.00 1.00 1.00 1.00 1.00 1.00 1.00 1.00 8
2006 1.00 1.00 1.00 1.00 1.00 1.00 1.00 1.00 8
2007 1.00 1.00 0.92 0.94 1.00 1.00 1.00 1.00 6
2008 1.00 1.00 0.88 1.00 0.97 0.99 0.81 1.00 4
2009 1.00 0.97 0.81 0.95 0.86 1.00 0.72 0.96 2
2010 0.99 0.94 0.80 0.98 0.81 0.99 0.64 1.00 1
2011 0.90 1.00 1.00 0.94 0.91 1.00 0.81 0.98 3
2012 1.00 1.00 1.00 0.96 0.85 1.00 0.88 0.96 4
2013 1.00 0.98 1.00 1.00 0.77 0.99 0.91 1.00 3
2014 1.00 0.96 1.00 0.99 0.93 1.00 1.00 0.93 4
2015 0.92 0.88 0.94 0.96 0.99 1.00 1.00 0.96 2
2016 0.98 0.86 0.91 0.94 1.00 0.98 0.86 1.00 2
2017 0.99 0.84 0.93 0.95 0.99 1.00 0.92 1.00 2
2018 0.90 0.90 0.86 1.00 1.00 0.98 1.00 0.96 3
2019 0.86 0.88 0.78 1.00 0.88 0.97 0.76 0.95 1
2020 0.90 0.85 0.79 1.00 0.84 0.96 0.75 0.88 1
Overall, Chuxiong, Wenshan, Xishuangbanna and Dehong had many DEA effective years. Nujiang had the fewest effective years and the lowest average comprehensive efficiency value of 0.91, and its comprehensive efficiency value in 2010 was only 0.64, which is the lowest in the whole sample period. Under the constraint of a certain degree of coordinated development, the average comprehensive efficiency of the inputs and outputs of the human-earth system in minority areas of Yunnan showed a downward trend. In particular, after 2007, the number of ineffective areas gradually increased. The resource combination among the subsystems in the human-earth system in minority areas of Yunnan is not optimal, with a rising trend of redundant inputs or insufficient outputs.
(4) Analysis of DEA invalidity
MATLAB was used to calculate the relaxation variables of input and output indicators, i.e., the radial movements (RMs) of the input redundancy values and the slack movements (SMs) of the output deficiency values in each region from 1995 to 2020. We further analyzed the causes of the DEA invalidity of the human-earth system in each region. In addition, some typical data were selected to draw an Rm-Sm (radial movements and the slack movements) situation map of non-DEA effective years for the coordinated development of the human-earth system.
As shown in Fig. 3, Chuxiong has 9 non-DEA effective years, with a minimum comprehensive efficiency value of 0.86. The input redundancy of the natural subsystem was shown in all years except 2010. This phenomenon indicates that the comprehensive efficiency of the development of the human-earth system in Chuxiong needs to be improved by changing the structure and mode of energy consumption, improving the utilization rate of resources and reducing the generation of pollutants.
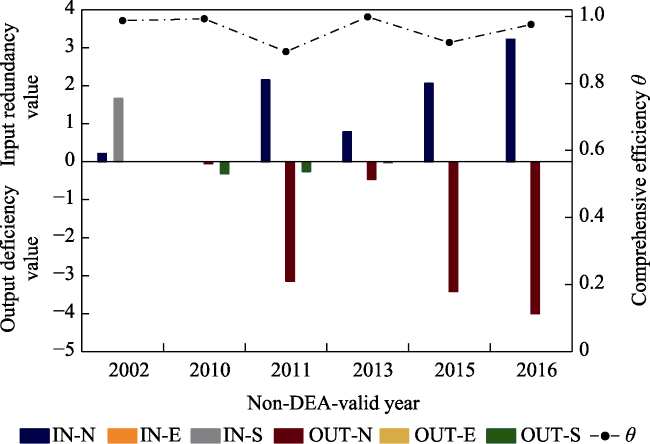
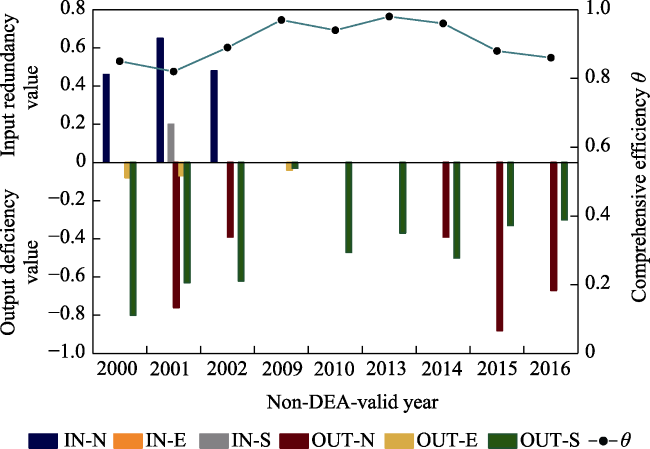
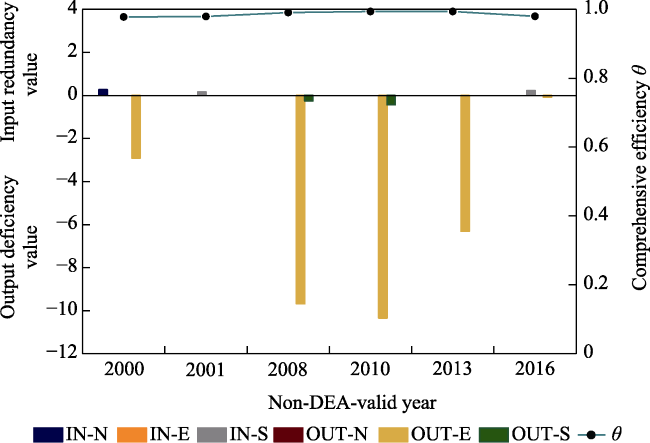
Fig. 3 RMs-SMs in Chuxiong non-DEA effective years
Figure 4 shows 13 non-DEA effective years in Honghe and a minimum comprehensive efficiency value of 0.826. The input redundancy of the natural subsystem was obvious from 2000 to 2002, and subsequently, the input redundancy value was zero. In 2000, 2001, 2002 and 2009, the output of the economic subsystem was insufficient, and then, the output deficiency value was zero. These phenomena demonstrate that the environmental pollution in this area has been restrained, and the economic output level has been improved, which is consistent with the measurement results of the improvement of the development degree of the natural and economic subsystems in Honghe. The non-DEA effectiveness of the human-earth system in Honghe is also manifested in the insufficient outputs of the natural and social subsystems. In this region, it is necessary to strengthen the development of a circular economy, improve the comprehensive utilization rate of resources, and promote the development of the social subsystem.
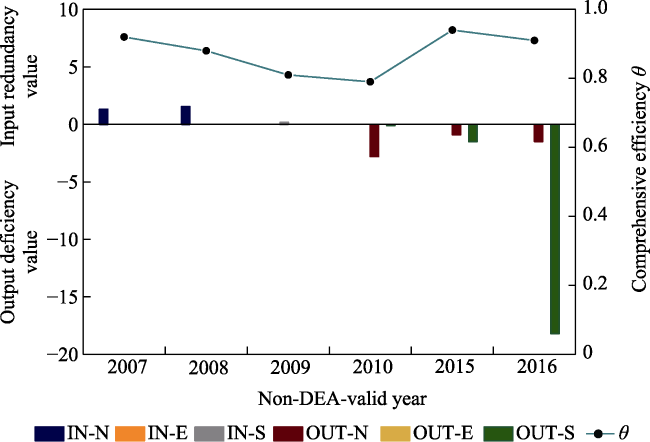
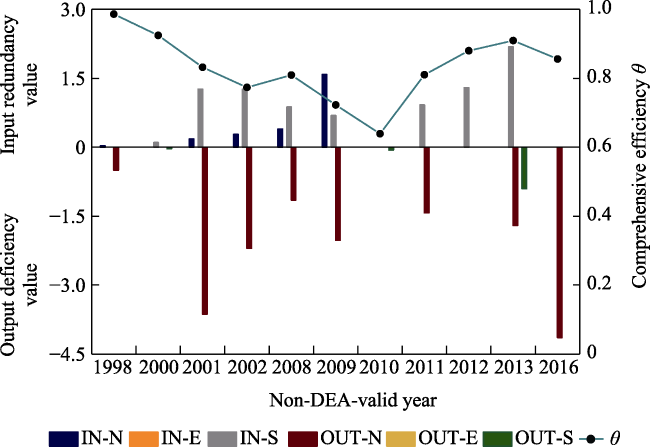
Fig. 4 RMs-SMs in Honghe non-DEA effective years
As shown in Fig. 5, Wenshan has 10 non-DEA effective years, with a minimum comprehensive efficiency value of 0.78. In 2007 and 2008, the input of the natural subsystem was redundant. In 2009, the input of the social subsystem was redundant. The output redundancy of the natural and social subsystems was displayed in 2010, 2015 and 2016, and that of the social subsystem was significant in 2016. These phenomena indicate that environmental protection has been strengthened, and environmental pollution has been alleviated. Furthermore, the development of the human-earth system in Wenshan should be promoted by improving the utilization rate of resources and emphasizing the effective development of the social subsystem.
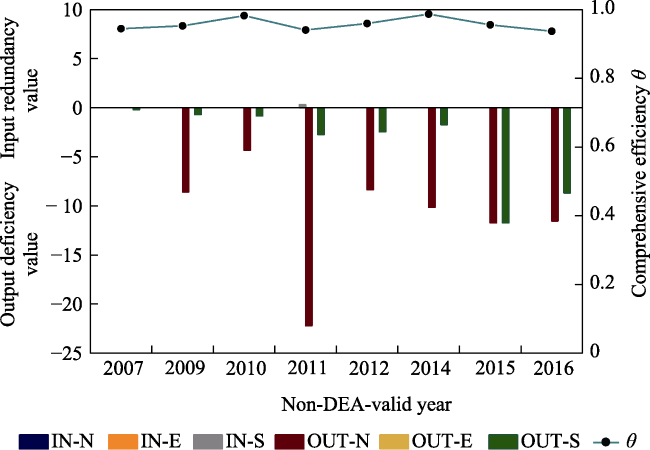
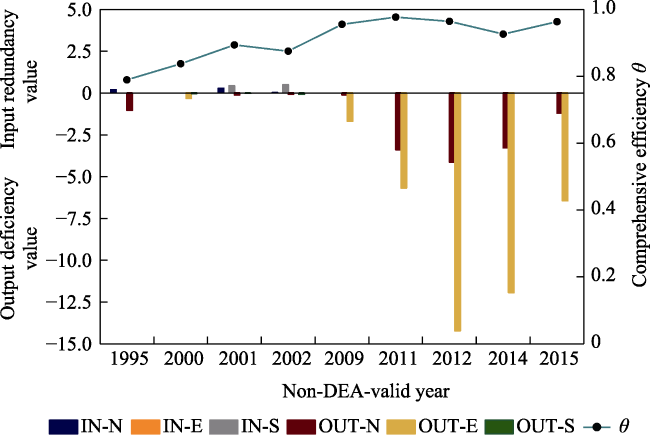
Fig. 5 RMs-SMs in Wenshan non-DEA effective years
As shown in Fig. 6, there are 9 non-DEA effective years in Xishuangbanna, mainly manifested in the insufficient output of the natural and social subsystems, and the minimum comprehensive efficiency value is 0.94. It shows that the resource input and output structures of the natural and social subsystems need optimization.
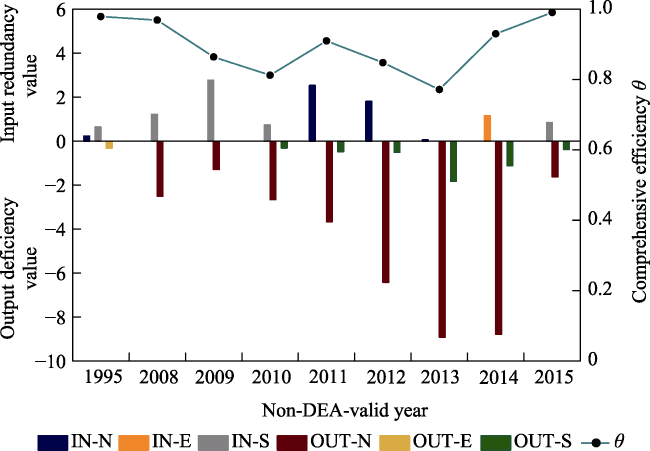
Fig. 6 RMs-SMs in Xishuangbanna non-DEA effective years
The number of non-DEA effective years of the human-earth system in Dali is 12, and the minimum comprehensive efficiency value is 0.77, as shown in Fig. 7. In 2002, the input redundancy of the natural and social subsystems was significant. In 2010, the output of the natural and social subsystems was insufficient. In the other non-DEA effective years, the redundant input of the natural subsystem and the insufficient output of the natural subsystem were obvious. It can be seen that in Dali, environmental pollution should be reduced, and resource utilization efficiency should be improved while developing society and economy.
Fig. 7 RMs-SMs in Dali non-DEA effective years
Figure 8 shows 9 non-DEA effective years of the human-earth system in Dehong and a minimum comprehensive efficiency value of 0.96. The output of the natural subsystem and the output of the economic subsystem were insufficient in 2008 and 2010. From 2001 to 2020, the output deficiency value of the social subsystem increased. These phenomena indicate that the efficiency of the natural, economic and social subsystems in the region needs to be improved, and the development of a circular economy should be guided to promote the utilization of resources.
Fig. 8 RMs-SMs in Dehong non-DEA effective years
As shown in Fig. 9, the human-earth system in Nujiang has 14 non-DEA effective years, with a minimum comprehensive efficiency of 0.64. From 1998 to 2009, the input redundancy of the natural subsystem increased. However, after 2010, the input redundancy was controlled. The output of the natural subsystem was insufficient in the other non-DEA effective years except 2000, 2010 and 2012. Moreover, the input redundancy of the social subsystem in Nujiang was more prominent than that in the other regions, and the output of the social subsystem was insufficient in 2013. It can be seen that in Nujiang and Honghe, it is necessary to protect the natural environment, reduce pollution and improve energy efficiency. In addition, investment should not be increased randomly, but resources should be used rationally in development to promote the coordinated development efficiency of the natural and social subsystems.
Fig. 9 RMs-SMs in Nujiang non-DEA effective years
Figure 10 shows 12 non-DEA effective years of the human-earth system in Diqing and a minimum comprehensive efficiency value of 0.79. The obvious insufficient outputs of the natural and social subsystems indicate that in this region, it is necessary to promote the development of a circular economy, improve the utilization rate of resources in the social subsystem and orderly construct urbanization. In 2000, 2001 and 2002, the outputs of the economic subsystem were insufficient, and the development degree of the economic subsystem in Diqing did almost not grow. These phenomena show that in a certain system input state, the coordinated development efficiency affects the development degree of the subsystem.
Fig. 10 RMs-SMs in Diqing non-DEA effective years

5 Discussion

5.1 The characteristics of the human-earth system in minority areas of Yunnan

According to the previous measurement results and relevant literature, before 1995, in minority areas of Yunnan, the population scale was small, and the scope of human activities and the ability to transform nature were restricted. In minority areas of Yunnan, especially those located in marginal and remote mountainous areas, development degree is low. Traditional agriculture is absolutely dominant in economic development, with backward production methods and an extremely weak industrial foundation, mainly focusing on the primary processing of agricultural products. In this stage, the dominant factor of agricultural development is the distribution of human and natural resources, positively impacting the natural subsystem. After 1995, minority areas of Yunnan entered the period of industrial civilization. The shortage economy gradually disappeared, and the development of the human-earth system accelerated. From 1995 to 2000, i. e., during the Ninth Five-Year Plan, the focus of regional economic development in Yunnan Province shifted to the adjustment of economic structure. The composition of the three industries in GDP was changed from 31.2 : 34.9 : 27.8 in 1990 to 22.3 : 43.1 : 34.6 in 2000. Indicating the growth stage of industrialization. In 2000, the western development strategy promoted industrialization in Yunnan Province. However, in Yunnan, the initial economic and social foundation was weak, and the subjective and objective conditions on which industrialization depended were poor. The exploration of local resources became the foundation of economic development. In the same year, five pillar industries, including tobacco, biological resource development, mineral resource development, tourism and electric power, were established in Yunnan Province. As areas rich in resources, minority areas have become the preferred destination for resource export. The input-output relationship between minority areas and the outside world gradually increases. Driven by the growth of external demand, the local economic structure has been adjusted to a certain extent. The dominant position of traditional agriculture in economic development is further impacted by industrial development, and the impact of human production and living activities on the natural subsystem is enhanced. Due to the rapid transformation of the industrial pattern, a rational mechanism for developing and utilizing resources has not been formed. The low threshold for enterprises to participate in environmental protection and the imperfect market inevitably lead to the inefficient utilization of resources. Due to the massive emission of pollution and overexploitation of resources, the environment and resource stocks of the natural subsystem are reduced. With the economic and social development in minority areas, the natural subsystem gradually declines. Under the influence of pollution, energy consumption and other factors caused by economic and social development, the human-earth system in minority areas transformed from the state of economic and social subsystem lagging to the state of natural, economic subsystem lagging or the natural subsystem lagging.

5.2 The evolution factors of the human-earth system

(1) The natural subsystem is important in supporting the development of the economic subsystem. In the early stage of the low-level development and accelerated development of the human-earth system in minority areas of Yunnan, resources, energy, environment and other elements in the natural subsystem are the basis for economic development and a crucial condition for the human-earth system to escape from low-level development. With the development of industrialization in Yunnan Province, the energy development industry has become the main pillar industry in most areas, producing substantial economic benefits in the short term. In 2007, more than 80% of the new profits of enterprises in Yunnan Province were caused by the expansion of production scale and the rise of product prices. From 2007 to 2020, the investment in fixed assets in minority areas in Yunnan increased by 76.5%. During economic development relying on capacity and scale expansion, the abundance and mining scale of resources determine the scale of economic development.
(2) The development of the natural subsystem is greatly influenced by the development of the economic subsystem. The development degree of the natural subsystem in minority areas of Yunnan in 2020 has no obvious change compared with that in 1995, with average measurement values fluctuating between 0.46 and 0.6. However, the analysis of the indicators of the natural subsystem shows an annually increasing emission of three wastes in minority areas of Yunnan with the development of industrial production. As economic development accelerates, natural resources are further exploited, the carrying capacity of the ecological environment is impacted, and the development degrees of the natural subsystem and economic subsystem show a negative correlation to a certain extent. With the increasing demand for resources by industrialization, the pressure on resources and the environment will remain heavy in the future.
(3) Import and export trade promotes economic development in minority areas of Yunnan. According to the calculation results of the measurement indicator weights of the coordinated development of the human-earth system, the weight of the total import and export volume of foreign trade in the economic subsystem is large (0.33), indicating that foreign trade can promote economic development in minority areas of Yunnan. Currently, the foreign trade in these regions is still dominated by the export of primary products with low added value, showing a low overall level of foreign trade. The contribution rate of primary product exports to economic growth is lower than that of manufactured goods exports. With the gradual transformation of trade to high-value-added manufactured goods exports, the development of foreign trade will contribute more to the economic growth in minority areas of Yunnan.
(4) Urbanization contributes significantly to the development of the social subsystem. Based on the calculation results of the measurement indicator weights of the coordinated development of the human-earth system, the indicator weight of the urbanization rate is large (0.18), which can better distinguish the differences in social development levels among regions. The research shows that a higher urbanization rate can result in a higher development degree of the social subsystem. Urbanization facilitates the coordination of the rational flow and balanced allocation of production factors and public resources between urban and rural areas, promotes the integration of urban and rural infrastructure construction and public services, and improves the living quality and standards of urban and rural residents. Thus, urban and rural residents enjoy equal rights in social welfare, public health, medical care and education, social security, labor and employment, and social equity and common prosperity are promoted.

6 Conclusions and prospect

6.1 Conclusions

In this study, using the DEA method, we established a coordinated development efficiency measurement model to study the evolution characteristics and influencing factors of the human-earth system in minority areas of Yunnan. The following conclusions are drawn.
(1) From 1995 to 2020, the development degrees and coordinated development degrees of the human-earth system in these eight regions showed upward trends, indicating that the development degrees of the natural, economic and social subsystems in the regional human-earth system gradually developed in a balanced, cooperative and harmonious way through policy adjustment. However, the coordinated development level was still low. For the coordinated development of the regional human-earth system, it is necessary to control the fluctuation and impede the declining trend of natural environment quality, promote economic strength and promote social development.
(2) Under the constraint of the coordinated development degree, the average comprehensive efficiency of the inputs and outputs of the regional human-earth system showed a downward trend. In particular, after 2007, the number of regions with ineffective EDA gradually increased. This phenomenon indicates that the development model of high inputs and consumption in minority areas of Yunnan has not been effectively changed, and the resource combination among the subsystems needs further optimization.
(3) The comprehensive utilization rate of industrial solid waste, the total import and export volume of foreign trade and the urbanization rate are the main factors affecting the efficiency of the coordinated development of the human-earth system in minority areas of Yunnan. It is recommended to promote the sustainable development of the regional human-earth system by developing a circular economy, improving the quality of foreign trade and optimizing the urban and rural structure.

6.2 Prospect

The study highlights the research on the evolution process and influencing factors of the human-earth system in minority areas of Yunnan and has certain theoretical and practical significance. Future research is needed in the following two aspects. First, the development trend of the human-earth system should be studied; the future ecological environment problems of the region should be simulated and predicted to improve the sustainability and optimize the regulation of the human-earth system. Second, spatial balance from the perspective of human-earth coordination should be researched; the system responses under different parameters and parameter combinations need to be explored based on mathematical models, and a research paradigm for the sustainable development of the human-earth system requires to be formed by combining the key disciplinary issues of factor and mechanism, function and system, and process and pattern.
[1]
Cai S F. 1997. On the scientific defining and operating of regional economic coordinate development. Journal of Zhongnan University of Economics and Law, (3): 21-25, 109. (in Chinese)

[2]
Cumberland J H. 1966. A regional interindustry model for analysis of development objectives. Papers of the Regional Science Association, 17(1): 65-94.

DOI

[3]
Fang C L. 2000. The dynamical foundation for the system of man and earth in the district development planning. Earth Science Frontiers, 7(S2): 5-10. (in Chinese)

[4]
Gong R Z, Liu Y X, Pan F P. 2020. DEA super efficiency evaluation model with weight constraints and its application. Chinese Journal of Management Science, 28(4): 164-173. (in Chinese)

[5]
Guan W, Liu Y F. 2012. The analysis of spatiotemporal evolution of economic and environmental coordination development degree in Liaoning coastal economic belt. Geographical Research, 31(11): 2044-2054.

DOI

[6]
Huang J K, Zhang X B, Zhang W. 2021. Analysis of research hotspots in management of coordinated development of economy and society. Journal of Management Sciences in China, 24(8): 163-170. (in Chinese)

[7]
Jing P R, Guo L D. 2021. Coordinated development between water resources utilization and economy in Zhejiang Province based on ecological footprint theory. Water Resources and Hydropower Engineering, 52(6): 42-51. (in Chinese)

[8]
Li H Q, Li W Q, Zheng F. 2021. Optimal land use structure for sustainable agricultural development——A case study in Changsha County, south central China. Journal of Resources and Ecology, 12(2): 203-213. (in Chinese)

[9]
Li J S, Wang X R, Miao C H. 2017. Comparison of development efficiency evaluation in resource-based cities based on DEA model. Economic Geography, 37(4): 99-106. (in Chinese)

[10]
Liao C B. 1999. Quantitative judgment and classification system for coordinated development of environment and economy—A case study of the city group in the Pearl River Delta. Tropical Geography, 19(2): 171-177. (in Chinese)

[11]
Liu K, Ren J L, Zhang B L. 2019. Evolution characteristics and influence factors of human-land system vulnerability in Yellow River Delta. Economic Geography, 39(6): 198-204. (in Chinese)

[12]
Liu M F, Liu Y F. 2017. Study on resources, environment and social economy coordinated development in Poyang Lake ecological economic zone based on multi-objective programming. Ecological Economy, 33(5): 100-105, 159. (in Chinese)

[13]
Rees W E. 2017. Ecological footprints and appropriated carrying capacity: What urban economics leaves out. Urbanisation, 2(1): 66-77.

DOI

[14]
Ren D, Cao G G, Long S R. 2021. Analysis of the coordination degree of social development in China based on the framework of HDI. The Journal of Quantitative & Technical Economics, 38(6): 88-106. (in Chinese)

[15]
Ren D, Wu X, Cao G G. 2020. Measurement of human development level in China and its influencing factors. Chinese Journal of Population Science, (1): 41-52. (in Chinese)

[16]
Robert C. 1968. Economics as a life science. Journal of Political Economy, 76(3): 392-406.

DOI

[17]
Song Y Q, Cao S Y, Zhang L X. 2000. An attempt to analyze the characters of man-land system and establish their corresponding index for the north agro-pasture transitional zone, China—Take Horqin Sandland as an example. Journal of Desert Research, 20(S1): 54-58. (in Chinese)

[18]
Sun J H. 2021. Research on synergetic development of port cluster-urban agglomeration complex system in Yangtze River Delta. Shanghai Maritime University. (in Chinese)

[19]
Wang F. 2021. Study on coordinated development of ecosystem and economic system based on coupling coordination degree model, taking Beijing-Tianjin-Hebei region as an example. Hubei Social Science, (6): 64-72. (in Chinese)

[20]
Wassily L. 1974. Environmental repercussions and the economic structure: An input-output approach: A reply. The Review of Economics and Statistics, 56(1): 109-110.

DOI

[21]
Weng G M, Tang Y B, Pan Y, et al. 2021. Spatiotemporal evolution and spatial difference of tourism-ecology-urbanization coupling coordination in Beijing-Tianjin-Hebei urban agglomeration. Economic Geography, 41(12): 196-204. (in Chinese)

[22]
Wu C J. 1991. On the research core of geography—Regional system of human-earth relationship. Economic Geography, 11(3): 1-6. (in Chinese)

DOI

[23]
Wu Y Y, Yuan J D. 2018. Urbanization coordination development degree spatio evolution analysis in Shaanxi Province from 2000 to 2015. Economic Geography, 38(7):75-83. (in Chinese)

[24]
Xiong X Z, Sun Y M, Yang C. 2022. Spatial-temporal coupling coordination relationship between animal husbandry and resource environmental carrying capacity in China. Economic Geography, 42(2): 153-162.

[25]
Yang L J, Yang H N, Yang Y C, et al. 2020. Spatia-temporal evolution of ecological environment quality in Hexi Corridor based on coupled coordination model. China Population, Resources and Environment, 30(1): 102-112. (in Chinese)

[26]
Yin S, Yang X J, Chen J. 2021. Progress of research on adaptation of human-environment systems: Concepts, theoretical frameworks, and methods. Progress in Geography, 40(2): 330-342. (in Chinese)

DOI

[27]
Zhang W P, Shi P J, Zhao W S, et al. 2020. The spatial-temporal characteristics of coordinated development between urbanization and resources and environmental carrying capacity in Northwest China: A case study of Lanzhou-Xining urban agglomeration. Chinese Journal of Ecology, 39(7): 2337-2347. (in Chinese)

Outlines

/