
Journal of Resources and Ecology >
Optimization Method for Green Infrastructure in Hanwang Town in the Context of the Integration of Agriculture and Tourism
|
CHU Yun, E-mail: TS20190002A31@cumt.edu.cn |
Received date: 2022-10-20
Accepted date: 2023-03-30
Online published: 2024-03-14
Supported by
The National Key Research and Development Program of China(2018YFD1100203)
The Doctoral Research Fund of Jiangsu Collaborative Innovation Center for Building Energy Saving and Construction Technology(SJXTBZ1709)
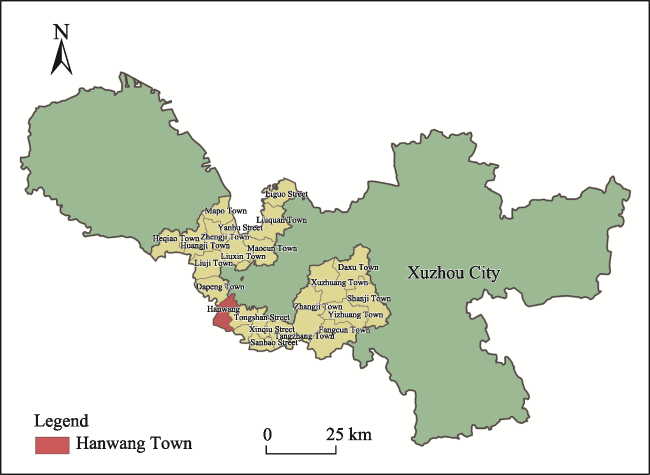
As an important measure for maintaining the ecological environment, green infrastructure also plays a significant role in industrial development and economic growth. The current traditional green infrastructure construction method is based on a combination of vertical and horizontal ecological processes, but it does not take into account the complexity of the ecosystem or the motivating effect of green infrastructure on industry. This study investigated how green infrastructure can play the leading role in industry while considering the complexity of the ecosystem. Hanwang Town is the most representative village and town in China with the leading agricultural tourism industry, and it is located in the northern part of Jiangsu Province. However, the ecological security patterns of villages and towns have been severely damaged in recent years, and the green infrastructure has not played a leading role in industry. Therefore, taking Hanwang Town as the research area, the data of the third national survey were combined with relevant statistical data. Then, from the perspective of the agriculture and tourism industries, ecosystem services were used as a bridge to improve the recent green infrastructure construction methods, and finally better strategies are proposed according to the optimization results. The research results revealed three important aspects of this system. (1) The optimization method can comprehensively consider the impact of environmental factors, objectively reflect the value of ecological services in the form of currency, reflect the importance of ecological environmental protection with intuitive values,and enhance people's awareness of ecological protection. (2) The selection of ecological factors takes into account the local characteristic industries of Hanwang villages and towns, and adding the appropriate industry-related ecological factors makes the identification of ecological sources based on ecosystem services more scientific, and can also bring benefits to the local residents. (3) The newly constructed green infrastructure fully takes into account the landscape, ecology, tourism and other roles played by tourist attractions on the ecological corridor. There are six tourist attractions in the selected ecological nodes, forming an ecological network space with an agglomeration economic function, and this allows the ecological service function to be better integrated. The findings of this research can effectively solve the shortcomings of the traditional green infrastructure construction methods, and reveal optimization strategies for the problems existing in the current green infrastructure construction in Hanwang Town. At the same time, they can also provide a reference for the green infrastructure construction of agricultural and eco-tourism villages and towns in other regions.
CHU Yun , GONG Yaxi , FANG Huanhuan , HE Yukun , TONG Shuai , TANG Sumin , JI Xiang . Optimization Method for Green Infrastructure in Hanwang Town in the Context of the Integration of Agriculture and Tourism[J]. Journal of Resources and Ecology, 2024 , 15(2) : 351 -371 . DOI: 10.5814/j.issn.1674-764x.2024.02.010
Fig. 1 Location of Hanwang Town |
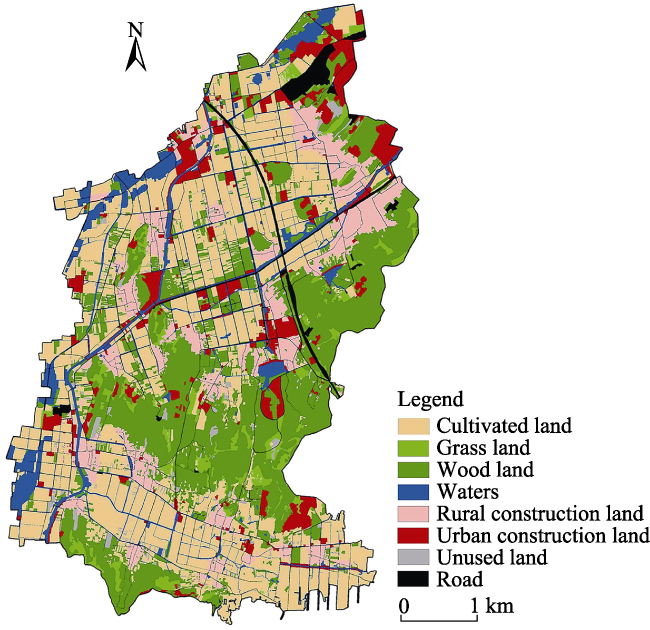
Fig. 2 Types of land use in Hanwang Town in 2021 |
Table 1 Ecosystem service value accounting system |
| Criterion layer | Indicator layer | Accounting item | Material quality index | Value indicator |
|---|---|---|---|---|
| Direct function | High value-added agricultural products | High additional crops: high-quality rice, strong wheat | High additional agricultural products, high-quality rice, strong wheat yields | High value-added agricultural products, high-quality rice, strong wheat value |
| Indirect function | Carbon fixation and oxygen release | Fix carbon dioxide, release oxygen | Carbon fixation and oxygen release | Carbon sequestration and oxygen release value |
| Soil conservation | Reduce non-point source pollution nitrogen and phosphorus | Reduce nitrogen and phosphorus production from non-point source pollution | Reduce the value of nitrogen and phosphorus in non-point source pollution | |
| Climate regulation | Temperature change | Annual actual evaporation | Temperature change value | |
| Water conservation | Maintain water sources and reduce sludge pollution | Water conservation, reducing silt area | Maintain water value and reduce sludge value | |
| Cultural service function | Eco-tourism | Number of tourists | Relevant value for tourists | |
Table 2 Material quantity accounting table of high additional agricultural products |
| Product category | Accounting content | Related indicators | Accounting method |
|---|---|---|---|
| High value-added agricultural products | Cereals | High-quality rice, strong wheat | Statistical yearbook related data (The specific data required is the sum of rice and wheat production in agricultural products) |
| Potatoes | Sweet potato, potato, yam, taro, etc. | ||
| Beans | Soybeans, mung beans, red beans, peas, etc. | ||
| Medicinal herbs | Angelica, licorice, etc. | ||
| Vegetables | Spinach, rapeseed, cabbage, amaranth, etc. | ||
| Fruits | Peaches, dragon fruit, pears, grapes, etc. |
Table 3 The mass accounting table of carbon fixation and oxygen release |
| Accounting category | Accounting content | Influencing factors | Accounting method |
|---|---|---|---|
| Carbon fixation and oxygen release | Fixed amount of carbon dioxide | Ecotype for ecotype area | Alternative engineering |
| Amount of oxygen released | Ecotype for ecotype area |
Table 4 Accounting table for the quality of soil retention |
| Accounting category | Accounting content | Influencing factors | Accounting method |
|---|---|---|---|
| Soil retention | The amount of soil retention | Slope length | Alternative engineering method; rainfall erosivity calculation model |
| Slope | |||
| Rain erosion | |||
| Vegetation area |
Table 5 Water source conservation quality accounting table |
| Accounting category | Accounting content | Influencing factors | Accounting method |
|---|---|---|---|
| Water conservation | Quality of water resources | Precipitation | Fitting Budyko curve with water balance equation |
| Water evaporation | |||
| Surface water velocity | |||
| Vegetation area |
Table 6 Accounting table for the quality of climate regulators |
| Accounting category | Accounting content | Influencing factors | Accounting method |
|---|---|---|---|
| Climate regulation | Lower air temperature | Temperature | Alternative engineering |
| Environmental humidity | |||
| Increase air humidity | Types of ecotypes | ||
| The area of each ecological type |
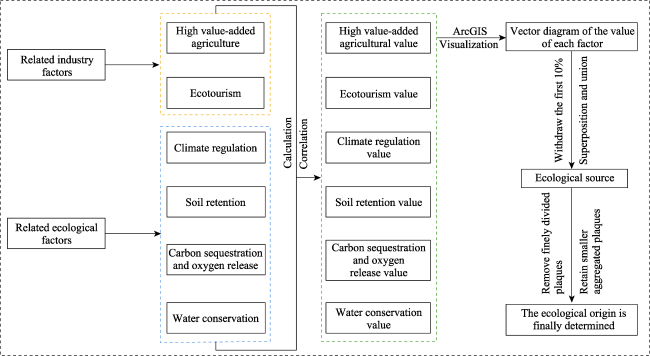
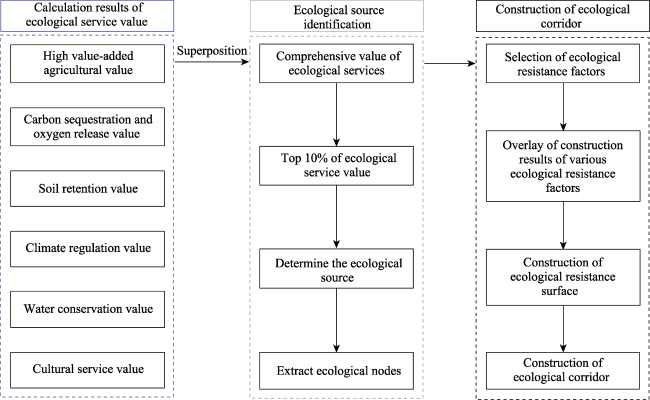
Fig. 3 Flow chart of ecological source identification |
Fig. 4 Flow chart of the analysis results |
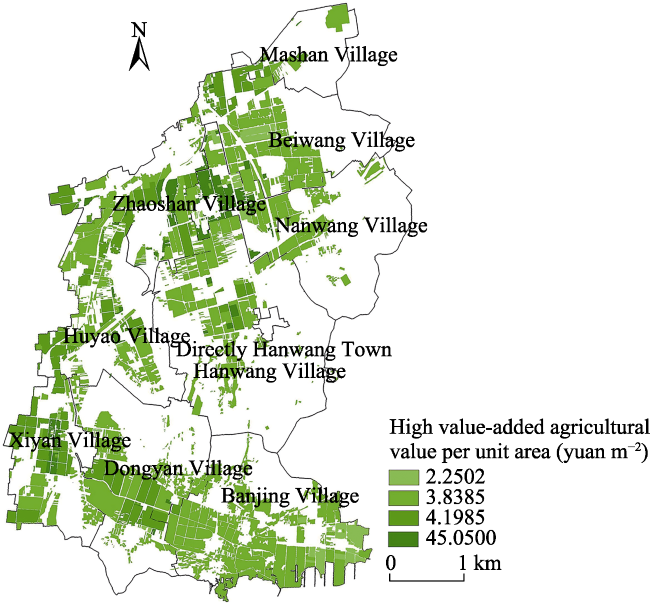
Fig. 5 Spatial distribution characteristics of high value- added agricultural value per unit areaNote: The values in the legend are accurate values obtained through calculation, not the numerical range. The same below. |
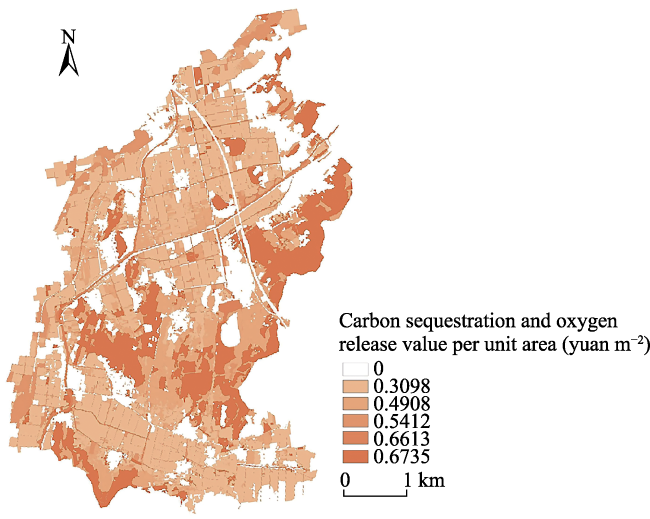
Fig. 6 Spatial distribution characteristics of carbon sequestration and oxygen release value per unit area |
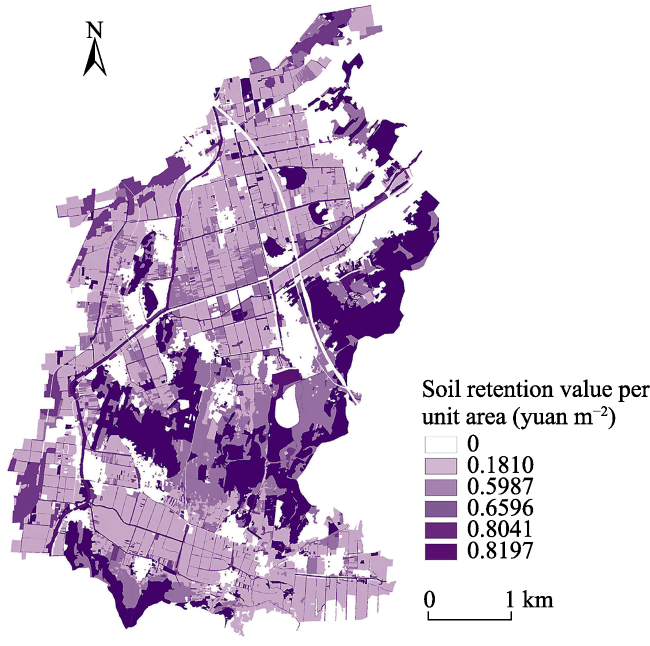
Fig. 7 Spatial distribution characteristics of soil retention value per unit area |
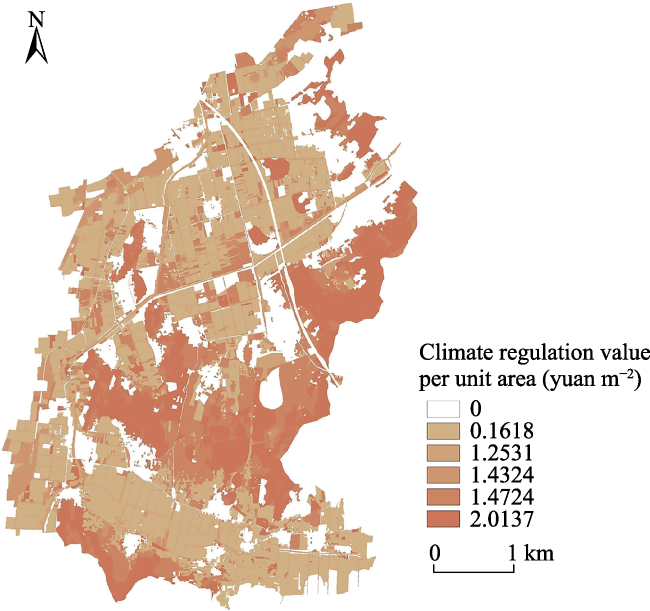
Fig. 8 Spatial distribution characteristics of climate regulation value per unit area |
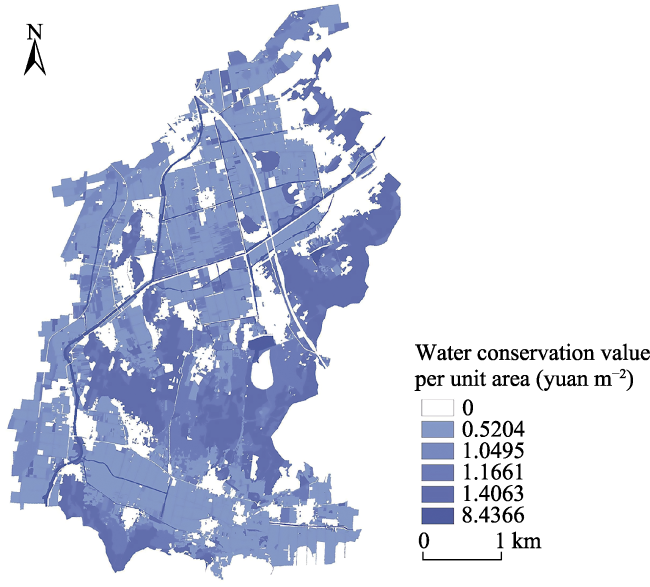
Fig. 9 Spatial distribution characteristics of water conservation value per unit area |
Table 7 Classification of scenic spots and weighting table of buffer distances |
| Attraction name | Attraction level | Buffer distance and weight | Importance index | |||
|---|---|---|---|---|---|---|
| 300 m | 500 m | 800 m | 1000 m | |||
| Xuzhou Paradise | 1 | 0.4 | 0.3 | 0.2 | 0.1 | 8 |
| Hanwang Tourist Scenic Spot | 2 | 0.4 | 0.3 | 0.2 | 0.1 | 4 |
| Xuzhou Napa Valley International Ski Resort | 2 | 0.4 | 0.3 | 0.2 | 0.1 | 4 |
| Xuzhou Henlin Bonsai Park | 3 | 0.4 | 0.3 | 0.2 | 0.1 | 2 |
| Horticultural Master Succulent Planting Base | 4 | 0.4 | 0.3 | 0.2 | 0.1 | 1 |
| Hanwang Dragon Fruit Plantation | 4 | 0.4 | 0.3 | 0.2 | 0.1 | 1 |
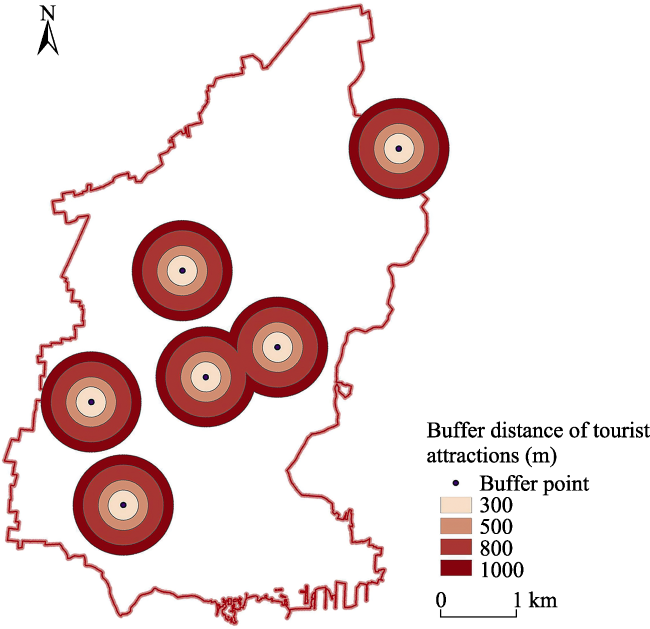
Fig. 10 Buffer analysis process diagram |
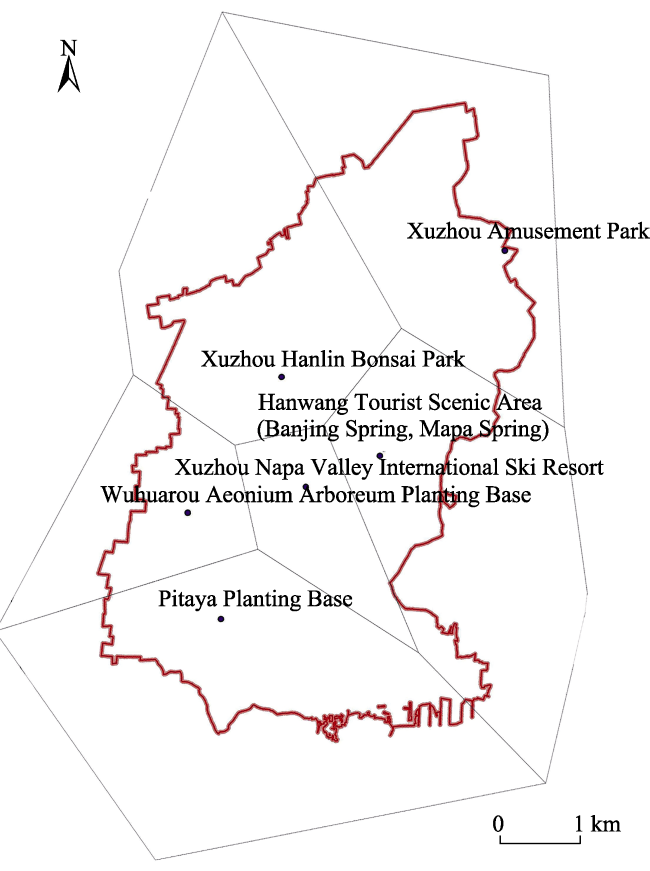
Fig. 11 Thiessen polygon analysis process diagram |
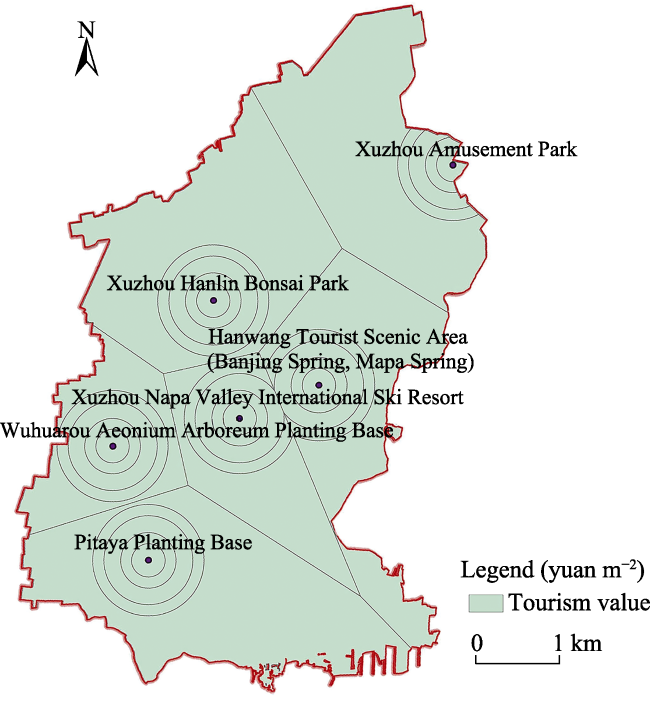
Fig. 12 Drawing after superposition and removal of excessNote: This figure is a schematic diagram of the process of calculating tourism value, without specific numerical classification. |
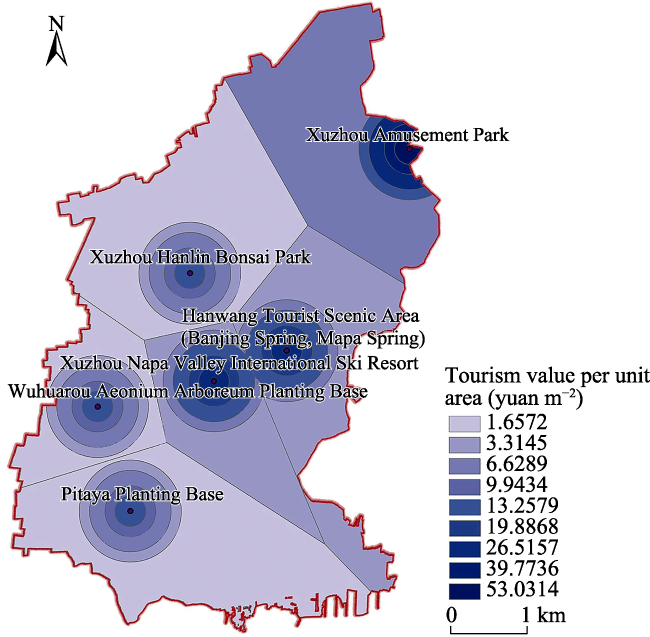
Fig. 13 Characteristic map of the spatial distribution of cultural service value in Hanwang Town |
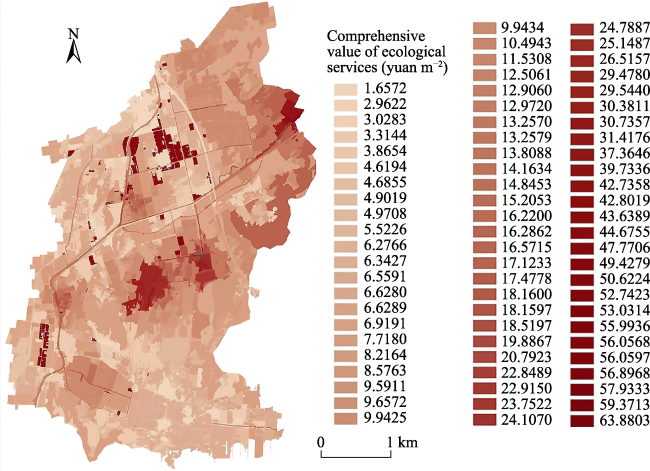
Fig. 14 Spatial distribution characteristics of the comprehensive value of ecological services |
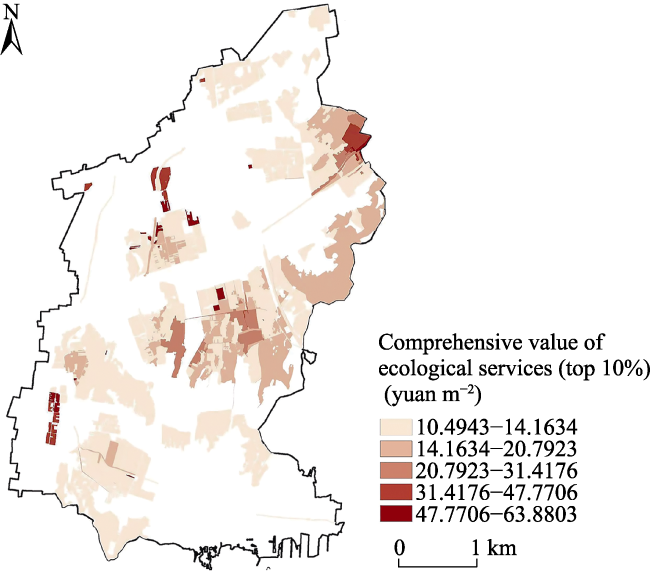
Fig. 15 Distribution characteristics of the top 10% patches of ecological service comprehensive value |
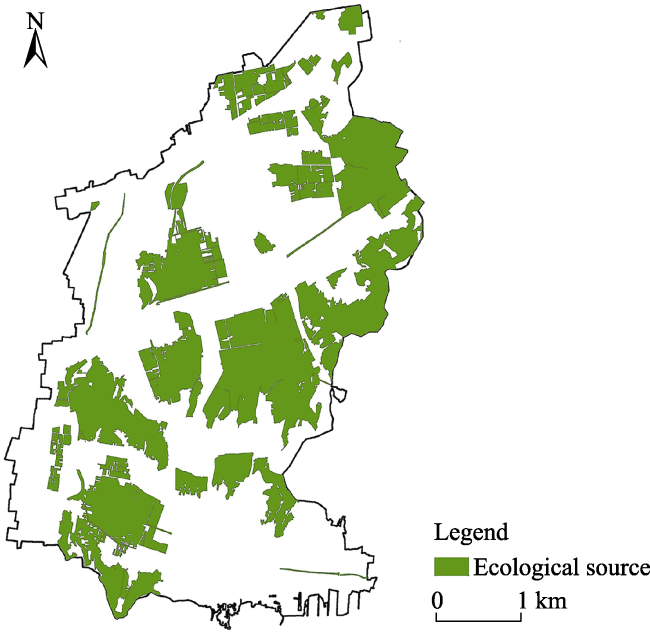
Fig. 16 Spatial distribution characteristics of ecological sources |
Table 8 Assignment system of regional landscape safety resistance factors |
| Influencing factor | Weight | Type | Weight | Impact factor | Weight | Range | Resistance value | Index source reference |
|---|---|---|---|---|---|---|---|---|
| Natural factors | 0.7222 | Topography | 0.3554 | Elevation (m) | 0.2448 | 0-10 | 5 | Huang et al., 2019 |
| 10-20 | 4 | |||||||
| 20-30 | 3 | |||||||
| 30-40 | 2 | |||||||
| 40-50 | 1 | |||||||
| >50 | 0 | |||||||
| Slope (°) | 0.3213 | 0-5 | 0 | Wang et al., 2022 | ||||
| 5-10 | 1 | |||||||
| 10-15 | 2 | |||||||
| 15-20 | 3 | |||||||
| 20-25 | 4 | |||||||
| >25 | 5 | |||||||
| Distance from water system (m) | 0.4339 | 0-200 | 5 | Luo, 2022 | ||||
| 200-400 | 4 | |||||||
| 400-600 | 3 | |||||||
| 600-800 | 2 | |||||||
| 800-1000 | 1 | |||||||
| >1000 | 0 | |||||||
| Land use | 0.1563 | Type of land cover | 1.0000 | Wood land | 0 | Zhang and Luo, 2021 | ||
| Arable land | 5 | |||||||
| Grass land | 1 | |||||||
| Construction land | 4 | |||||||
| Waters | 2 | |||||||
| Unused land | 3 | |||||||
| Precipitation | 0.0650 | Precipitation (mm) | 1.0000 | 0-690.34 | 0 | Liang et al., 2018 | ||
| 690.34-733.30 | 1 | |||||||
| 733.30-768.92 | 2 | |||||||
| 768.92-812.56 | 3 | |||||||
| 812.56-864.56 | 4 | |||||||
| >864.56 | 5 | |||||||
| Vegetation cover | 0.1455 | Vegetation coverage (NDVI) (%) | 1.0000 | 0 | 5 | Yao et al., 2022 | ||
| 0-8.00 | 4 | |||||||
| 8.00-18.00 | 3 | |||||||
| 18.00-28.00 | 2 | |||||||
| 28.00-38.00 | 1 | |||||||
| >38.00 | 0 | |||||||
| Human factors | 0.2778 | The traffic | 0.2778 | Distance from settlement (m) | 0.5518 | 0-200 | 5 | Li et al., 2020 |
| 200-400 | 4 | |||||||
| 400-600 | 3 | |||||||
| 600-800 | 2 | |||||||
| 800-1000 | 1 | |||||||
| >1000 | 0 | |||||||
| Distance from road (m) | 0.4482 | 0-200 | 5 | Ma et al., 2022 | ||||
| 200-400 | 4 | |||||||
| 400-600 | 3 | |||||||
| 600-800 | 2 | |||||||
| 800-1000 | 1 | |||||||
| >1000 | 0 |
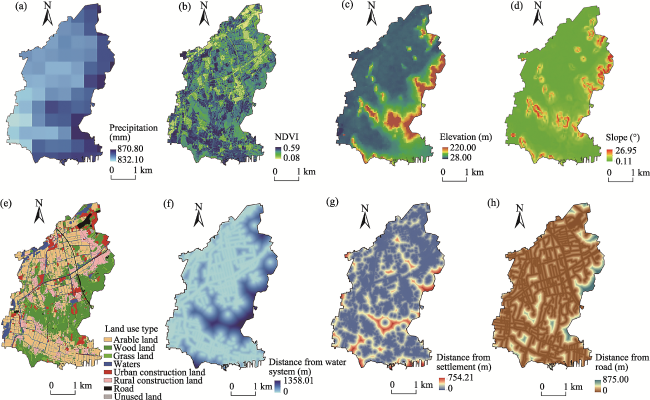
Fig. 17 Diagram of landscape safety resistance factor analysis |
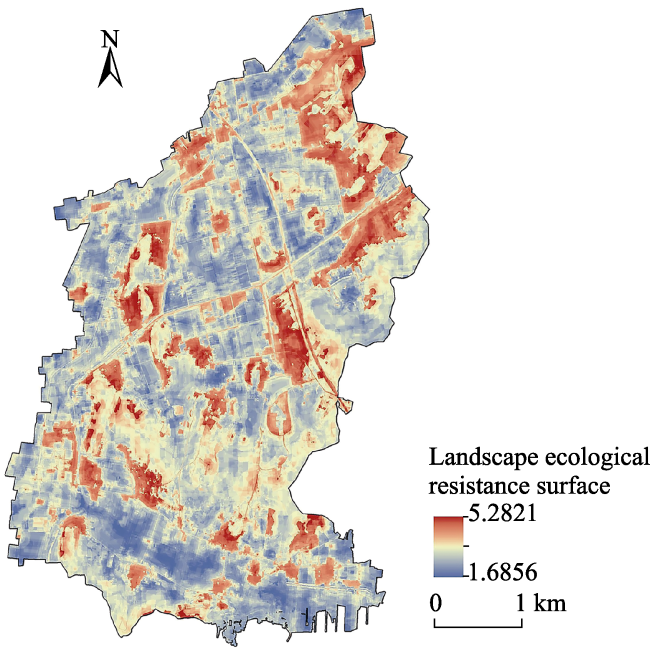
Fig. 18 Diagram of landscape ecological resistance analysis |
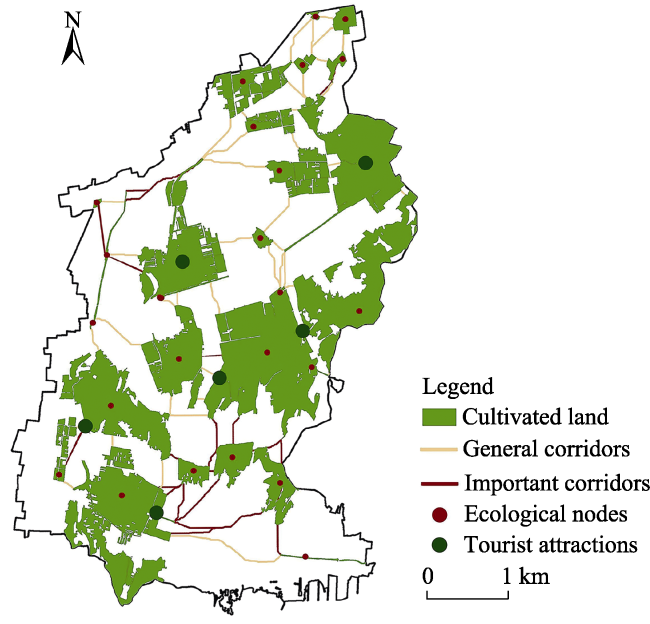
Fig. 19 Ecological corridor construction |
| [1] |
|
| [2] |
|
| [3] |
|
| [4] |
|
| [5] |
|
| [6] |
|
| [7] |
|
| [8] |
|
| [9] |
|
| [10] |
|
| [11] |
|
| [12] |
|
| [13] |
|
| [14] |
|
| [15] |
|
| [16] |
|
| [17] |
|
| [18] |
|
| [19] |
|
| [20] |
|
| [21] |
|
| [22] |
|
| [23] |
|
| [24] |
|
| [25] |
|
| [26] |
|
| [27] |
|
| [28] |
|
| [29] |
|
| [30] |
|
| [31] |
|
| [32] |
|
| [33] |
|
| [34] |
|
| [35] |
|
| [36] |
|
| [37] |
|
| [38] |
|
| [39] |
|
| [40] |
|
| [41] |
|
| [42] |
|
| [43] |
|
| [44] |
|
| [45] |
|
| [46] |
|
| [47] |
|
| [48] |
|
| [49] |
|
| [50] |
|
| [51] |
|
| [52] |
|
| [53] |
|
| [54] |
|
| [55] |
|
| [56] |
|
| [57] |
|
| [58] |
|
| [59] |
|
| [60] |
|
/
| 〈 |
|
〉 |