Urban-Rural Integration and Green Development

Evaluation of Urban Space Livability in the Urban Area of Hefei based on Production-Living-Ecological Space

  • ZHANG Quan , 1, 2, * ,
  • NIE Huijuan 1 ,
  • LI Xiaoying 1
Expand
  • 1. School of Architecture and Art, Hefei University of Technology, Hefei 230601, China
  • 2. Anhui Engineering Research Center of Renewal Technology of Cityscape and Spatial Environment, Hefei 230601, China
*ZHANG Quan, E-mail:

Received date: 2022-09-19

  Accepted date: 2023-04-30

  Online published: 2024-03-14

Supported by

The National Social Science Foundation of China(22BSH085)

Abstract

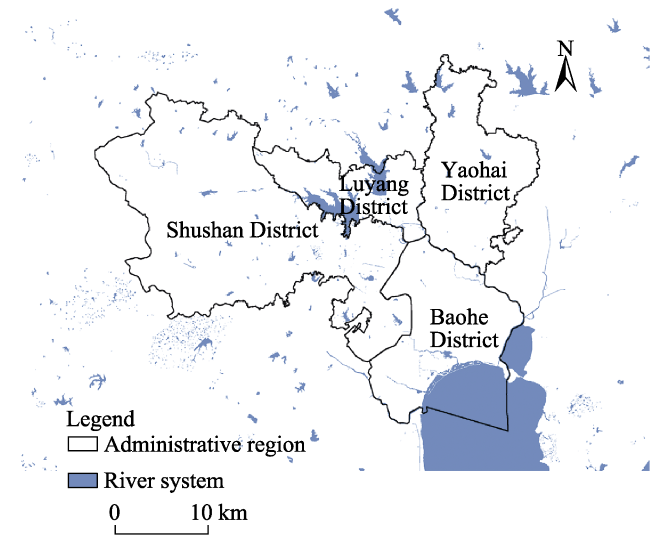
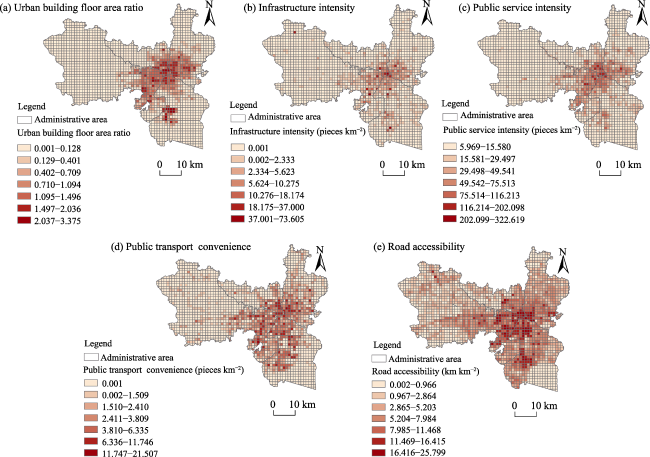
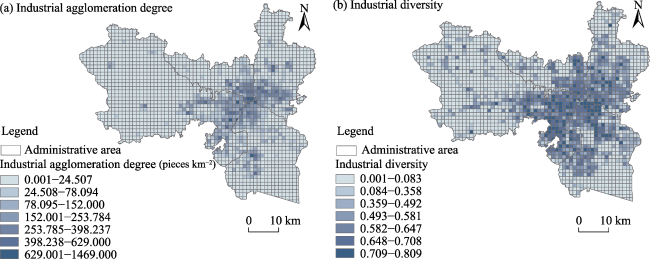
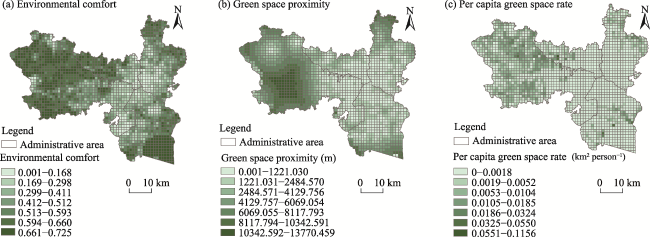
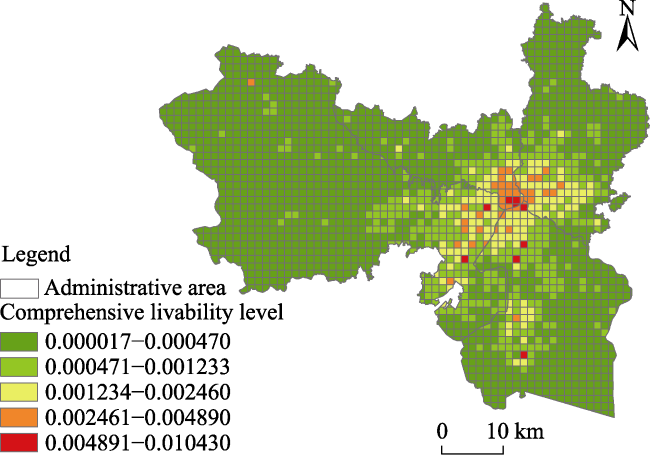
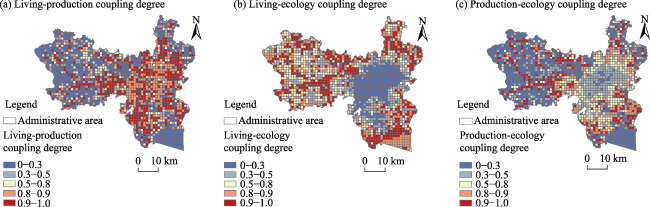
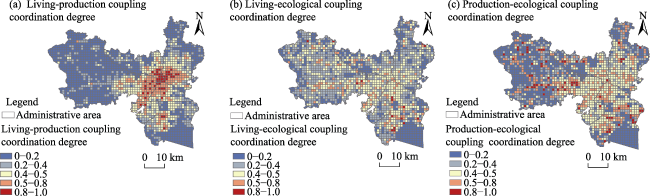
Building livable urban space is an important component of urban construction. The evaluation of urban space livability is of great significance for urban sustainable development. The study measured the level of urban spatial livability in the urban area of Hefei from the spatial perspective of production-living-ecological space (PLES), using spatial analysis methods, to provide new ideas for the construction of livable urban spatial and to promote the coordination of urban spatial elements and spatial optimization. Firstly, this study constructed the evaluation model for urban spatial livability from three perspectives: Comfortable living, convenient production and ecological health. Secondly, using the evaluation model for urban spatial livability, the global spatial autocorrelation analysis method and the coupling coordination degree model, the single factor differentiation of urban space livable potential, comprehensive livable degree and the coupling degree of PLES in the urban area of Hefei were analyzed, respectively. Finally, this study discusses the coordination of PLES elements of the urban space in Hefei urban area, and puts forward spatial optimization strategies. The results show three important aspects of this system. (1) In terms of the single-factor livability of living, production and ecology, there are significant differences in the spatial distribution characteristics of the livability of the Hefei urban area. There is a spatial clustering of living comfort areas in the center, a spreading of production convenience areas from the center to the periphery, and a scattering of ecological health areas around the perimeter. (2) The overall livability of the urban space in Hefei is high. In terms of space, it shows the characteristics of high in the middle and low around the periphery, and the high-value area of livability is mainly concentrated in the urban center. (3) The coupling coordination degree of PLES in the urban area of Hefei is high in the city center and low around the city. The coupling coordination degree of life-production is the highest, which indicates that the spatial layout of these two elements has certain rationality and achieves benign coordination.

Cite this article

ZHANG Quan , NIE Huijuan , LI Xiaoying . Evaluation of Urban Space Livability in the Urban Area of Hefei based on Production-Living-Ecological Space[J]. Journal of Resources and Ecology, 2024 , 15(2) : 338 -350 . DOI: 10.5814/j.issn.1674-764x.2024.02.009

1 Introduction

Urbanization is an inevitable trend in the process of urban development. The rapid urbanization process can bring good socio-economic benefits, but at the same time it can also cause problems such as unreasonable spatial function distribution, unbalanced resource allocation and high population density. Therefore, creating a livable city has become a hot topic in the fields of urban geography, urban planning and urban economy (Mohammadian and Rezaie, 2019; Shan and Chao, 2022). Livable urban space is conducive to providing a good living and ecological environment for urban residents, thereby improving the quality of life of residents (Wang and Zhou, 2022). On the other hand, good spatial livability can also strengthen the connectivity and influence of the city, and promote the sustainable development of the city.
The study of urban livability originated from studies on the urban living environment in the 19th century. Foreign scholars put forward the idea of a livable city in the face of a series of social problems caused by the deterioration of the living environment. Foreign scholars have evaluated the urban livability of large cities or urban agglomerations mainly from the perspectives of ecological environment, economic development, social convenience, education and culture, with the help of Internet surveys, fuzzy structure models, geographic information system (GIS) and other methods (Mahmoudi et al., 2015; Harvey and Aultman-Hall, 2016; Namini et al., 2019; Paul, 2020; Benita et al., 2021; Saeed et al., 2022). Domestic scholars began to study the theory and practice of the human settlement environment in 1990 (Zhang, 2007), and have discussed the connotation of the livable city, the evaluation method of the livable city and the construction of evaluation index systems. Based on the research at home and abroad, this study believes that urban livability refers to a good living space environment, human and social environment, ecological and natural environment and a clean and efficient production environment in the city. Previous studies on urban livability evaluation were summarized and assessed. The existing literature is mainly carried out at the macro and micro levels. One focuses on the macro significance of livability at the national and city levels (Li and Yi, 2020), while the other analyzes the quality of the living environment at micro scales such as the street level and community level. However, there are relatively few meso studies on the municipal scale, and most of them use a questionnaire for the basic data, which lacks a quantitative research basis. Therefore, further discussion of the urban space livable performance, scientifically and quantitatively from the meso-level, can enrich our understanding of the research, and also has important guiding significance for improving the quality of urban life and optimizing the urban spatial pattern.
The concept of production-living-ecological space (hereafter referred to as PLES) refers to three types of functional space: production, living and ecological, and is a comprehensive approach to zoning (Liu, 2016; Cui et al., 2018; Jiang and Liu, 2020). Previously, domestic and foreign scholars mainly focused on the spatial theory of PLES (Zhao and Song, 2020), the spatio-temporal pattern evolution and influencing factors (Zhao and Liu, 2021; Fan et al., 2022; Wen and Chen, 2022), classification and functional evaluation (Zhang et al., 2017; Cheng et al., 2018; Li et al., 2018; Geng et al., 2019; Feng et al., 2021), PLES subspace research, and similar topics, but have focused less on evaluating the livability of PLES. In China, there are a few studies on the evaluation of urban livability in PLES, which can be divided into two categories: single evaluation and comprehensive evaluation, according to the evaluation objects. The single evaluation mainly refers to the evaluation of living space and ecological space. For example, Li et al. (2020) used GIS spatial analysis and combing statistics to quantitatively measure the quality of life and the pattern of PLES at the village scale in Yangzhong City, Jiangsu Province. Liu et al. (Liu and Huang, 2020) quantitatively evaluated the landscape ecological security in Wanzhou District of Chongqing, and revealed the rules of changes and spatio-temporal distribution characteristics of its ecological security. Comprehensive evaluation is necessary to integrate the three aspects into the evaluation system for comprehensive consideration, which has been conducted by some scholars, but only a few. For example, Zhang et al. (2021b) used spatial autocorrelation and a triangular coordinate diagram analysis to explore the spatial functions of PLES of Hainan Island and to develop an effective spatial zoning scheme. Zhang et al. (2021a) identified and analyzed the spatial pattern of PLES in the central city of Wuhan by constructing an urban spatial livability evaluation system.
In general, the current research on PLES has a certain research foundation and is carried out at different scales. However, most of the studies focus on the single function of PLES, and a theoretical research system for the livability of PLES at the urban level has not yet been formed. In response to the above limitations, this study established a comprehensive livability evaluation index system based on the functional types of PLES, evaluated the livability of urban space in Hefei, and explored the coupling relationships in the livability of urban PLES. This study not only considers the attribute characteristics of the internal factors of a single space, but also considers the correlation degrees of different index factors in the same space.

2 Study area and methods

2.1 Study area

This study uses the Hefei urban area as an example for evaluating urban space livability. Hefei City is located in the middle of Anhui Province. It is the urban area of Hefei metropolitan circle and the sub-central city of the Yangtze River Delta urban agglomeration. This study specifically selected the urban area of Hefei as the study area, including Baohe District, Shushan District, Yaohai District and Luyang District (Fig. 1). A 1 km×1 km grid was used as the research unit to adjust for the limitations of low accuracy at the large scale of an administrative region. The study area was divided into a total of 2146 grid cells. In recent years, Hefei has adhered to the guidance of the General Secretary’s ecological civilization ideology, focused on solving prominent ecological and environmental problems, and made every effort to build a high-quality ecological highland suitable for living and business.
Fig. 1 Scope of the study area

2.2 Data sources

(1) Basic data included Hefei administrative division data, land use data and road network data. The data of administrative divisions were obtained from the standard map service platform of the Ministry of Natural Resources. Land use data came from Landsat-8 satellite data of the remote sensing data sharing platform of the Institute of Digital Earth, Chinese Academy of Sciences. Its pixel spatial resolution is 30 m. The remote sensing image was obtained by geometric correction, image mosaic and artificial visual interpretation using ArcGIS platform. Road network data were obtained from Open Street Map.
(2) Statistical data mainly included the POI data of the study area in 2022, from the network data of Hefei City in 2022 that was obtained from Gaode map. A total of 86 major categories and 110604 POI data points were extracted through data preprocessing steps such as screening and duplicate removal. This dataset included infrastructure data, public service data, industrial data, public transportation and scenic spot data. The building area and building floors were derived from National Platform for Common Geospatial Information Services, and the base map was vectorized to extract effective information. The population density was derived from the 2020 population distribution data of the Landscan platform, with a spatial resolution of 1 km (30× 30), and the measurement unit was person km-2.

2.3 Research method

2.3.1 Construction of the evaluation model for urban spatial livability

(1) Single-factor evaluation model of urban spatial livability
With the advancement of urban planning and construction, spatial livability is an important element in urban planning and construction that reflects the needs of urban residents for a better life. Production-living-ecological spatial theory divides urban space into three types of space: living, production and ecology, which are both independent and interrelated, with symbiotic integration and constraining effects (Wei et al., 2021; Gao et al., 2022). A livable urban space requires a livable and appropriate living space that provides a variety of living services to meet people’s needs, an intensive and efficient production space to provide employment and economic support, and an ecological space to provide space for people to live and develop.
Therefore, based on the purpose of this study and the basic connotation of urban livability (Blomquist et al., 1988; Li et al., 2008; Paul and Sen, 2018), combined with the actual situation of Hefei urban area and related research results (Zhan et al., 2018; Zhang et al., 2019; Paul, 2020), this study follows the principles of rigor, comprehensiveness, representativeness and operability. Following these four principles, a total of 10 secondary evaluation indexes were selected for each dimension from the three dimensions of comfortable living, convenient production and ecological health. These indexes constitute the evaluation criteria system of urban spatial livability in Hefei urban area (Table 1).
Table 1 Livability index of urban space
Destination layer Primary index Secondary indicator Index calculation method Index meaning
Evaluation of urban space livability Comfortable living Urban building floor area ratio F A R = B A / U A Ratio of total building area to unit area in space unit
Infrastructure intensity I I = I / U A Ratio of the number of infrastructure components in the space unit to the area of the unit (pieces km-2)
Public service intensity P S I = P S / U A Ratio of the number of public services in the space unit to the unit area (pieces km-2)
Public transport
convenience
P T C = P T / U A Ratio of the number of public transport facilities in the space unit to the unit area (pieces km-2)
Road accessibility R A = R L / U A Ratio of road length to unit area in spatial unit (km km-2)
Convenient production Industrial agglomeration degree I A = N / U A Ratio of the number of all industries in the space unit to the unit area (pieces km-2)
Industrial diversity I D = j = 1 7 S j / S ln S j / S Shannon’s Diversity Index of industries in spatial unit
Ecological health Environmental comfort E C = M / U A Ratio of the total area of green space and water area to unit area in a space unit
Green space proximity G P The nearest distance between the research unit center and the nearby green space (m)
Per capita green space rate P G R = G A / U P Ratio of green space area to population in a space unit (km2 person-1)

Note:   F A Ris urban building floor area ratio; B Ais ratio of total building area; U Ais unit area in space unit; I Iis infrastructure intensity; Iis the number of infrastructure components; P S Iis public service intensity; P Sis the number of public services; P T Cis public transport convenience; P Tis the number of public transport facilities; R Ais road accessibility; R Lis ratio of road length; I Ais industrial agglomeration; Nis the number of all industries; I Dis industrial diversity, which is calculated as the Shannon’s Diversity Index; E Cis environmental comfort; G Pis green space proximity; P G Ris per capita green space rate; G Ais green space area; U Pis the number of the population of the study unit.

Comfortable living is mainly reflected in a safe and harmonious living environment as well as a comfortable and convenient living environment. Among the relevant features, building floor area ratio, infrastructure, public service facilities, road traffic and other aspects are closely related to people’s lives. Therefore, a total of five secondary indicators were selected to evaluate the comfort of living in Hefei urban area at this stage, namely, urban building plot ratio, infrastructure intensity, public service intensity, public transportation convenience and road accessibility.
Convenient production is the display of the level of urban productivity. The evaluation indexes of production convenience include industrial agglomeration, industrial diversity, and others. Combining the existing research and data availability, the number and types of POI of industries were used to calculate the industrial agglomeration and industrial diversity, respectively, as shown in Table 1. Industrial POI categories include various industries such as the hotel and catering industry, education and culture industry, entertainment and leisure industry, medical and health industry, transportation industry, commerce, and manufacturing and processing industry.
Ecological health is a comprehensive characteristic of the ecosystem, and a good urban environment is essential for maintaining the ecological health of the city. Combining the existing studies on ecological health, the ecological health of the Hefei urban area was measured from three aspects: environmental comfort, green space proximity and per capita green space rate. The more green space and water system capacity in the ecological space, the stronger the ecological regulatory ability and the higher the ecological environment quality; while the proximity of green space reflects the accessibility of the urban green space to the research unit.
Based on the evaluation system of urban space livability, the single factor livability evaluation results of comfortable living, convenient production and ecological health in Hefei urban area were obtained. With the help of the ArcGIS Spatial Join tool, the data results were loaded into the vector file of the Hefei Urban Administrative Region for visual analysis in order to observe and analyze the spatial distribution and spatial differentiation of livability in life, production and ecology.
(2) Comprehensive evaluation model of urban spatial livability
The comprehensive livability level of an urban space reflects its comfortable living and convenient production, and the ecological health of the overall livability. Based on the calculation results of the urban spatial livability evaluation model, each secondary index was standardized by the extreme difference. The weight of each secondary index was determined by the entropy value method and substituted into the formula of the comprehensive urban spatial livability model (Equation 1) in order to calculate the comprehensive urban spatial livability level of Hefei urban area within the unit space.
The comprehensive model of urban spatial livability is:
U C L = α F A R + β I I + γ P S I + δ P T C + ε R A + θ I A + μ I D + ρ E C + φ G P + ω P G R
where, U C L is the urban comprehensive livability, and α , β , γ , δ , ε , θ , μ , ρ , φ , and ωare the weights of each index.

2.3.2 Global spatial autocorrelation analysis

Spatial autocorrelation refers to the interdependence of unit attributes at different spatial locations and can measure the degree of aggregation or dispersion between spatial unit attributes. In this study, the Global Moran’s I was used to measure the spatial comprehensive livability degree of Hefei urban area, and to analyze the regional convergence in spatial proximity, as measured by Equation 2.
I = i = 1 n j = 1 n W i j R e s i R e s ¯ R e s j R e s ¯ S 2 i = 1 n j = 1 n W i j
where R e s i is s the calculated value of urban comprehensive livability in region i, R e s ¯is the mean value of the urban comprehensive livability level,   S 2 is the variance of the urban comprehensive livability level, and   W i jis the spatial weight value between the i-th and j-th elements of the matrix. The Global Moran’s I of the urban spatial comprehensive livable degree in urban area of Hefei is in the range of [-1, 1]. Values greater than 0 indicate that the comprehensive habitability is positively correlated; values less than 0 indicate that the comprehensive habitability is negatively correlated; and a value equal to 0 indicates that the space is random and each spatial object unit is independent from all the others.

2.3.3 Coupling coordination degree model

(1) Coupling model
The spatial overlap and functional complexity of PLES lead to coupled interactions between the three systems that promote and coerce each other, and the coupling degree model is a scientific method for analyzing the interactions between multiple systems (Kong et al., 2020). Therefore, this study constructed the livability coupling degree model of PLES in the Hefei urban area to analyze the degree of interaction between comfortable living, convenient production and ecological health. The specific calculation formula is:

C 1 = 2 U 1 U 2 U 1 + U 2, C 2 = 2 U 1 U 3 U 1 + U 3, C 3 = 2 U 2 U 3 U 2 + U 3

where C 1 , C 2 , and C 3refer to life-production coupling degree, life-ecology coupling degree and production-ecology coupling degree, respectively. The value range is [0,1], and the larger the value, the higher the degree of interaction between the two. See Table 2 for details. U1, U2 and U3 represent the comprehensive evaluation values of comfortable living, convenient production and ecological health, respectively.
Table 2 Coupling degree standards for the PLES in urban space
Coupling degree interval Coupling type
[0, 0.3] Low coupling stage
(0.3, 0.5] Antagonistic stage
(0.5, 0.8] Running-in stage
(0.8, 0.9] Benign coupling stage
(0.9, 1] High-level coupling stage
(2) Coupling coordination degree model
Although the coupling degree model (equation 4) can express the degree of interaction among individual factors in the livability of PLES in Hefei urban area, it cannot represent whether the factors promote each other at a higher level or restrict each other at a lower level in the overall livability system of the Hefei urban area. Therefore, to further explore the collaborative development process between the livable systems of PLES, based on the coupling degree, this study constructed a coupling coordination degree model, which was calculated as:

T 1 = α U 1 + β U 2,   T 2 = α U 1 + γ U 3,   T 3 = β U 2 + γ U 3

D 1 = C 1 T 1, D 2 = C 2 T 2, D 3 = C 3 T 3

where T 1 , T 2 , and T 3are the overall evaluation indexes, which reflect the comprehensive development levels of life and production, life and ecology, and production and ecology, respectively. Variables α , β , and γ are the weights of the importance of living comfort, production convenience and ecological health. In this study, we believe that the three have the same effect, and take values of α = β = γ = 1 2. D 1 is the degree of coupling and coordination between life and production, D 2 is the degree of coupling and coordination between life and ecology, and D 3is the degree of coupling and coordination between production and ecology. The higher the value, the higher the degree of coupling and coordination. According to the relevant research results (Wang and Tang, 2018; Gao et al., 2021; Liu et al., 2021) and the actual situation of the study area, the coupling coordination degree of PLES in the Hefei urban area was divided into five types (Table 3).
Table 3 Standards of the PLES coupling coordination degree in urban space
Coupling coordination degree interval Coupling coordination type
[0, 0.2] Severe disorder stage
(0.2, 0.4] Moderate maladjustment stage
(0.4, 0.5] Basic coordination stage
(0.5, 0.8] Moderate coordination stage
(0.8, 1] High coordination stage

3 Characteristics of urban space livability in the Hefei urban area

3.1 Single factor analysis of the livability of urban space

3.1.1 Comfortable living

From the perspective of comfortable living (Fig. 2), the high value area of comfortable living is mainly concentrated in the old city center of Hefei, and has a trend of spreading from the center to the southwest. The five specific indicators show some variations in their spatial distributions. 1) Urban building floor area ratio: The high value of urban building floor area ratio in Hefei urban area appears in the intersection zone of Shushan District, Luyang District, Yaohai District and Baohe District, with a secondary peak in the middle of Baohe District (Fig. 2a). The connecting area belongs to the old city of Hefei, with a large number of buildings and dense distribution. The central part of Baohe District is the Binhu New District, which is the administrative office and business cultural center of Hefei, and mainly populated by high-rise residential and office buildings. Except for the central part of the main city, the floor area ratio of buildings in other areas is generally low. 2) Infrastructure intensity: The urban infrastructure in Hefei is relatively scattered. However, there are also obvious agglomeration points, and the junction of the four regions shows the peak concentration. A circular infrastructure distribution concentration exists in the southwest of Baohe District (Fig. 2b). 3) Intensity of public services: There are also obvious agglomeration areas in the distribution of public service facilities in Hefei urban area (Fig. 2c). These areas are the key development circles of Hefei, namely Swan Lake Center, old city center and Lakeside Center, and others, where medium and high-end public service facilities will be gathered. 4) Public transport convenience: The high value of public transport convenience in Hefei urban area is widely distributed. It mainly shows a trend of spreading from the junction of the four areas as the core area to the surrounding areas, and presents a linear distribution along subway Lines 2 and 4 (Fig. 2d). Among them, the Hefei South Railway Station and Hefei Railway Station are located in the center of the city, and all types of transportation facilities around them are convenient, which is one of the reasons for the high degree of public transportation convenience. The government affairs center in the west of Baohe District is at the intersection of subway Lines 1 and 5 under construction, forming a large range of agglomeration. 5) Road accessibility: The overall road accessibility in Hefei is relatively high, and presents an obvious linear distribution along the major urban trunk roads and airport expressways (Fig. 2e). The road accessibility of the second ring road in the urban area is relatively high, which is distributed in a ring and diffuses outward, consistent with the “ring-checker-radiation” road network layout in the Hefei urban area.
Fig. 2 Comfortable living levels of Hefei urban area
Overall, the Hefei City center living space habitability is higher than in the marginal region. The reason lies in the diverse types and close layout of infrastructure services in urban centers. Moreover, the dense road network and more public transportation lines make the experience of residents more comfortable. However, in the process of urban construction and development, the intensity of central urban development should be reasonably controlled, the functional layout of the city should be reasonably optimized, and comfortable living space should be created.

3.1.2 Convenient production

From the perspective of production convenience (Fig. 3), the overall differentiation of production convenience in the Hefei urban area is obvious. High-value areas are mainly concentrated in the urban center, which is closely related to the layout of Hefei’s economic center. There are several specific manifestations of this. 1) Industrial agglomeration in the Hefei urban area is mainly concentrated in the intersection zone of Shushan District, Luyang District and Yaohai District, and high values also appear in the north and east of Baohe District (Fig. 3a). High-value areas are mainly in the old city center and the new district center, which have a high economic level, a large scale, and many industrial clusters with good strength. 2) The industrial diversity layout of the Hefei urban area is relatively scattered. High-value areas mainly appear in the east of Shushan District and the north of Baohe District, with an index value of 0.000135 (Fig. 3b). These areas are the key construction zones of Hefei’s industrial development. The Silicon Valley the of University of Science and Technology of China and Binhu Science City are the innovative industrial clusters that Hefei has focused on building, so the types of industries are relatively diverse. Production convenience is the expression of urban production efficiency and production advantage. Evaluating the production layout of the Hefei urban area through the two indicators of industrial agglomeration and industrial diversity can better grasp the functions and roles played by the city in the process of economic development.
Fig. 3 Convenient production levels of Hefei urban area

3.1.3 Ecological health

Healthy ecological development is an important guarantee for building a livable environment. From the perspective of ecological health (Fig. 4), the overall ecological health of the Hefei urban area is good, with the degree of livability in the remote areas of the city being better than in the urban center. This is demonstrated by three observations. 1) The distribution of environmental comfort in the Hefei urban area is relatively scattered, and the western part of Shushan District, the northern part of Luyang District and Yaohai District, and the southern part of Baohe District are at relatively high levels (Fig. 4a). This is related to the layout of the urban water system greening in Hefei. Most of the western part of Shushan District is a suburb of the city, which is less developed and has good vegetation coverage. There are large reservoirs and urban parks in the northern part of Luyang District and Yaohai District, and the ecological conditions are good. The southern part of Baohe District is near Chaohu Lake, surrounded by wetland parks and ecological agriculture areas, and has a good ecological environment. 2) Green space proximity refers to the nearest distance from the unit space to the nearby park attractions. The higher the green space proximity, the farther the unit space is from the nearby green space, and the lower the green accessibility. The areas with high values of green space proximity in the Hefei urban area appear in the east and north of Shushan District, the north of Yaohai District, and the south of Baohe District (Fig. 4b). These areas have a low development degree and low road accessibility, and some of these areas are large water areas with few traffic lines. The low-value area of green space proximity is located at the junction of the four districts, with a relatively concentrated spatial distribution and a large area. The center of this area is the ring Park, which connects urban green spaces such as Xinghua Park, Xiaoyaojin Park, Bao Park, Yinhe Park, Xishan Scenic Spot, and others. There are many scenic spots around the ring, and the road traffic is convenient, so the greening accessibility is high. 3) The per capita green space rate is significantly lower than the green space proximity, but it still shows the characteristics of “low in the middle and high around the periphery”. The central region has a high degree of development, a dense population, and less per capita green space area (Fig. 4c). According to the evaluation index of ecological health, urban development and ecological environment have certain conflicts and complementarity. Protecting the green ecological bottom line is still the primary prerequisite for building a livable environment (Peng et al., 2022).
Fig. 4 Ecological health levels of Hefei urban area

Note: In the indicator of “per capita green space rate”, the data on green space area comes from the satellite data of the “Remote Sensing Data Sharing Platform”, and the green space area identified by the remote sensing satellite data includes parks, green belts, farmland, protective green spaces and other green spaces with natural environments. The population data comes from “Landscan Platform 2020 Population Distribution Data”. All the indicators in the paper are calculated using 1 km×1 km grid unit as the smallest study unit for statistical calculation.

3.2 Analysis of the comprehensive livability level of the urban space

In this study, the results of urban spatial comprehensive livability evaluation in the Hefei urban area were divided into five grades using the natural break point method. The comprehensive livability level of the urban space in the study area was obtained (Fig. 5). According to Fig. 5, the high values for the comprehensive livability level of the Hefei urban area are concentrated in the center of the city, and the low values are scattered in the peripheral areas of the city. Global spatial autocorrelation was used to analyze the spatial clustering characteristics, and the P-value was less than 0.001, indicating that the data had 99% confidence. The Moran’s I index was 0.641 and the Z-score was 54.553 (Fig. 6), indicating that the comprehensive spatial livability level of the Hefei urban area has obvious spatial clustering characteristics and spreads outward from the center. In addition, a small-scale agglomeration area is also formed in the south of Baohe District. As the central city is the core area of Hefei's urban development, it has a large population, dense buildings and many convenient services, so the overall spatial livability is high.
Fig. 5 Comprehensive livability level of Hefei urban area
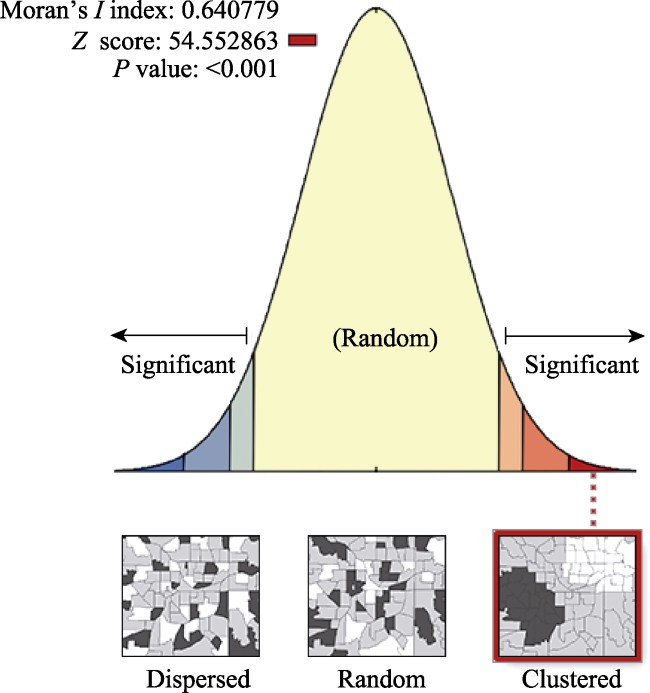
Fig. 6 Results of spatial autocorrelation analysis
Table 4 shows the urban spatial livability indicators and weights of the Hefei urban area. Among the three first-level indicators, comfortable living has the highest weight (0.6), followed by convenient production (0.24) and then ecological health (0.16). This result directly reflects that when evaluating the livability of urban space in Hefei, comfortable living has the most obvious influence on the livability results, while ecological health is most easily neglected, thus indicating the importance of promoting a green living environment. In the secondary index layer, infrastructure intensity, industrial agglomeration degree and urban building floor area ratio have more weight and are important factors affecting the livability of the urban space. In turn, combined with the layout of the Hefei urban area, the two areas with high values of comprehensive livability are found in the old city center and Binhu New Area, which are the key construction zones of the Hefei urban area. The old city center was the first formed and developed area of Hefei City, with a long period of infrastructure accumulation and population concentration, as well as a dense distribution of urban buildings. On the other hand, Binhu New Area is a new area built by Hefei to become a modern lakeside metropolis. It is the administrative office, business, cultural and leisure tourism center of Hefei, which has developed rapidly and has a strong radiation drive in recent years. Both zones have the advantages of perfect infrastructure, dense public service facilities, a large number of jobs and a good living environment, and a high overall livability.
Table 4 Weights of the urban spatial livability index in Hefei urban area
Primary index Secondary indicator Weight
Comfortable living Urban building floor area ratio 0.15
Infrastructure intensity 0.22
Public service intensity 0.06
Public transport convenience 0.12
Road accessibility 0.05
Convenient production Industrial agglomeration degree 0.16
Industrial diversity 0.08
Ecological health Environmental comfort 0.01
Green space proximity 0.04
Per capita green space rate 0.11

3.3 Analysis of the coupling characteristics of urban PLES

The coupling and coordination degree of the urban spatial livability level can indirectly reflect the developmental state of the spatial system. Therefore, it is of great theoretical and practical significance to explore the coupling characteristics between comfortable living, convenient production and ecological health, as well as the coupling coordination characteristics for the construction of urban livability. Firstly, this study used the coupling degree model to calculate the spatial coupling degree of PLES in the Hefei urban area, and the results are shown in Fig. 7. Secondly, in order to further analyze the coupling coordination degree of livability in the study area, the coupling coordination index was calculated by the quantitative analysis method with the help of the coupling coordination model, and finally, the spatial coupling degree of Hefei urban area was obtained. The results of the coupling analysis of PLES in the Hefei urban area are shown in Fig. 8.
Fig. 7 Coupling degree of PLES in Hefei urban area
Fig. 8 Coupling coordination degree of PLES in Hefei urban area
From the perspective of spatial distribution, the distribution of livability coupling degree levels of living space, production space and ecological space in the Hefei urban area has characteristics of obvious regularity and heterogeneity. The living-production coupling in the eastern part of the study area is higher than that in the western part, and the study area is mostly in the benign coupling or high-level coupling stage. This shows that the living space and ecological space are strongly dependent on the Hefei urban area. However, the spatial distribution characteristics of the living-ecological coupling degree and the production-ecological coupling degree are similar. This shows that the living and production layout of the central urban area is less affected by the ecological base, and the coupling degree is low. The data in Fig. 8 show that the coordination degree of living-production coupling in the urban area of Hefei is the highest, indicating that the spatial layout of these two has a certain rationality and achieves benign coordination. The level of living-ecological coupling coordination is relatively balanced spatially, indicating that the urban living space has ecological patches such as parks, green belts, and water systems.
In terms of the range of values, the spatial livability coupling levels between living comfort, production convenience and ecological health in Hefei City are relatively significant, with the highest being the living-ecological coupling level with a mean value of 0.63. The coupling degree of living-production is next, with an average of 0.50. The coupling degree of production and ecology is the lowest, with an average value of 0.33, which indicated that the spatial dislocation of production and ecology was significant, so the comprehensive function between production and ecosystem should be strengthened, and the balanced distribution and structure should be improved. The level of coupling coordination is generally higher in the central urban area than in the suburban area, indicating that there are problems of unreasonable spatial quantitative ratios and unbalanced resource allocation in the core of the central area and the fringe of the urban area, resulting in certain regional differences. Therefore, solving the contradiction between production development and ecological protection, and coordinating the regional production, living and ecological space layout are important issues in the current economic development of the Hefei urban area.
In conclusion, there is a large gap in the spatial coupling degree between the different systems in the Hefei urban area, which to a certain extent indicates that the quantitative ratio and spatial allocation of living, production and ecological space in the study area need to be further optimized. There are obvious spatial differences in the coordination degree between the urban center and the urban fringe. The level of spatial coordination of PLES between the central area of Hefei and the urban fringe shows a more obvious difference, with the urban center having a better state of spatial coupling and coordination than the other areas, which is related to the more complete infrastructure and rich urban functions in the urban center. The results of the spatial coupling and coordination of the PLES systems in Hefei urban area are consistent, i.e., there is a certain correspondence between the high values of coupling and coordination in geographic space. This indicates that the elements of the three spatial systems in the Hefei urban area are roughly in harmony with each other during the development of the spatial systems.

4 Discussion and enlightenment

4.1 Discussion

This study constructed the livability evaluation index system from three levels: “comfortable living, convenient production and ecological health”. The single factor livability levels of living space, production space and ecological space in the Hefei urban area and the overall livability level of the Hefei urban area were measured by 10 types of indicators. The quantitative analysis of the spatial coupling and coordination of PLES in the Hefei urban area was carried out with the help of the coupling coordination model, and the spatial distribution pattern and reasons for the coupling degree in Hefei urban area were investigated. The main conclusions of the article are threefold.
(1) From the results of each individual factor of livability, there are different characteristics of the different types of spatial distribution. Among them, living space is the spatial existence form of people’s daily life interactions, which plays a key role in improving the overall livability of the city. In order to play the role of building living space, it is necessary to change the way of living and improve the living environment. With the continuous development of the social economy, the demand for urban construction land in Hefei urban area is increasing, and the contradiction between ecological space and living and production space in the urban area is becoming more and more prominent, and the demand for adjustment and optimization of PLES is increasing.
(2) In terms of the comprehensive livability results, the development of comprehensive livability of the Hefei urban center and the suburban area is unbalanced, and there is a big gap in the overall level. That is, the livability of the suburbs is low, while the livability of the central city is high. As influenced by the imbalance of economic development levels between regions and the deviations of regional financial subsidies, there are obvious spatial differences in resource allocation and spatial governance between the urban center and urban suburbs, which leads to the unbalanced development of comprehensive livability.
(3) From the results of the coupling and coordination characteristics, the coupling degree and coordination degree of urban space in the Hefei urban area generally show spatial consistency, which indicates that the overall development of PLES is relatively harmonious. The significant positive correlation between the coupling degree and coordination degree of the production and living space indicates that the layout ratio of urban production and living space is more harmonious and they promote each other's development. However, the living-ecology and production-ecology coupling in the urban center is low and coordinated, so there is a certain spatial misalignment.

4.2 Enlightenment

In conclusion, the single factor livability level in the urban area of Hefei shows significant spatial differentiation, so it is necessary to optimize the spatial layout of PLES. There is a large gap in the overall livability levels between the urban center and the marginal areas. The development of urban areas should narrow the gap. The overall development of PLES is relatively coordinated, but there is still a situation of spatial dislocation, which needs to be resolved in order to coordinate overall development. Given the above conclusions, several optimization strategies can be put forward based on the perspective of PLES.
(1) Promote the governance of functional space and improve the comprehensive benefits of production-living- ecological space.
In view of the large single factor gap in the livability of urban space in the Hefei urban area and the imbalance of living, production and ecological space, we should emphasize the comprehensive maximization of production, life and ecological benefits and guide the comprehensive development of urban functions. In terms of living comfort, we should strengthen the construction of urban infrastructure and the public service system, adhere to a people-oriented focus, promote the equalization of infrastructure services, improve the urban living environment, and improve the quality of the living space. In terms of production convenience, the site selection of production space should be scientifically planned, the compactness of each production space should be enhanced, industrial agglomeration, enterprise clustering and intensive use of resources should be promoted, and the goals of efficiently using the production space and continuously improving the economic benefits should be achieved (Li and Sun, 2020; Xi et al., 2022). At the same time, regional comparative advantages should be relied on, and differentiated strategies should be implemented according to local conditions in order to create an efficient production space. In addition, as the city continues to develop, the level of production, living and ecological space functions is still affected by the contradiction between economic development and ecological environmental protection. Based on this, ecological protection and restoration policies should be improved, and the living and production spaces should be organically integrated into the ecological spaces to optimize the ecological spatial functions (Jiang et al., 2022).
(2) Reduce differences between urban areas and improve overall livability.
The comprehensive livability gap between the urban center of Hefei and the suburbs is large, which is not conducive to the balanced development between urban areas, and the regional gap should be narrowed in order to jointly improve the comprehensive livability level. The regional gap should be narrowed and the overall livability level should be improved together. The urban center is the gathering sink and radiation source of the city and even the region, which can give play to the advantages of highly intensive resources, talents and funds to drive the development of surrounding areas in order to narrow the regional gap (Cai et al., 2021). Therefore, it is necessary not only to enhance the innovation capacity of the city center's science and technology and management system, but also to improve the capacity of the city center to serve the urban fringe, thus further cultivating and growing the source of urban radiation. In addition, urban suburbs should fully tap into their development potential, comprehensively regulate and optimize the underdeveloped suburban land, form a reasonable structure of urban and suburban space coordination, and achieve common progress based on the integration of urban center resources and suburban characteristic resources. Urban centers and suburbs each contribute their regional advantages to build a reasonable urban spatial network and form a reasonable urban division of labor, thus improving the overall livability of the city.
(3) Use scientific planning and overall layout to enhance the potential of urban development.
The spatial coupling and coordination of PLES can not only explore their spatial distribution characteristics, but also analyze the interconnections between urban spatial subsystems. The coordination of urban spatial coupling in the Hefei urban area is relatively good, but there are still some problems in spatial pattern and resource allocation. Therefore, scientific planning of the urban spatial network, construction of a reasonable urban spatial division of labor, and the coordination and optimization of urban spatial development mechanisms can promote the healthy and sustainable development of the economy, society and the ecological environment (Zhu and Chen, 2021). The comprehensive development of PLES spatial coupling in the Hefei urban area is relatively synergistic, but the problem of unbalanced development among regions and system elements still exists. Therefore, in the future development process, we should pay attention to the coordination and optimization of the production, living and ecological space, and fully release the optimization potential of the urban space. In terms of overall policy orientation, government coordination should be strengthened and a regional balance-oriented spatial resource input guarantee mechanism should be established. The functional levels of production space, living space and ecological space should be improved comprehensively by strengthening the exchange and cooperation among urban areas. In terms of development concept, the improvement of the PLES function level is still affected by the contradiction of a low coupling degree between ecological space and living and production space. Based on this, the development concept should be changed, and green sustainable development should be used as the measurement standard for promoting the formation of an intensive and efficient production space, a safe and convenient living space, and a green and harmonious ecological space pattern.

5 Conclusions

With the gradual advancement of urbanization, building a livable urban spatial environment is a hot topic in urban research. In the process of building a livable city, the scientific arrangement of PLES functional space and reasonable allocation of spatial resources are the keys for improving the livability of the city. This study explored the development of the livability level of the Hefei urban area from the perspective of PLES with the help of the ArcGIS spatial analysis method and related mathematical models. Firstly, a system of urban spatial livability indexes was constructed from three aspects: “comfortable living, convenient production, and ecological health”, and evaluation criteria were established for the subsequent spatial livability study. Secondly, this study attempted and realized the quantitative analysis and visualization of the spatial livability of PLES in the Hefei urban area. The urban spatial livability evaluation model, global spatial autocorrelation analysis method and coupling coordination degree model were used to quantify the single-factor spatial differentiation status, comprehensive livability degree and coupling characteristics of urban spatial livability, respectively. The regularity and heterogeneity of the distributions of the production, living and ecological spatial livability levels in Hefei urban area were revealed. Finally, based on the results of this urban spatial livability analysis, corresponding optimization strategies were proposed from three aspects: strengthening spatial function governance, reducing urban area differences, and coordinating planning layout. This study explores spatial livability measurement and spatial optimization strategies, which can help city managers to better understand the distribution of urban functions, optimize the urban spatial structure, and provide references and suggestions for urban spatial development.
[1]
Benita F, Kalashnikov V, Tunçer B. 2021. A Spatial Livability Index for dense urban centers. Environment and Planning B: Urban Analytics and City Science, 48(7): 2006-2022.

[2]
Blomquist G, Berger M, Hoehn J. 1988. New estimates of quality of life in urban areas. American Economic Review, 78(1): 89-107.

[3]
Cai T S, Wu W, Xiao P F. 2021. Thoughts on the development dilemma and construction path of inter-provincial regional central cities: A case study of Puyang in Henan Province. Shanghai Urban Planning Review, (6): 70-77. (in Chinese)

[4]
Cheng T, Zhao R, Liang Y. 2018. Production-living-ecological space classification and its functional evaluation. Remote Sensing Information, 33(2): 114-121. (in Chinese)

[5]
Cui J X, Gu J, Sun J W, et al. 2018. The spatial pattern and evolution characteristics of the production, living and ecological space in Hubei Provence. China Land Science, 32(8): 67-73. (in Chinese)

[6]
Fan J H, Liang Z H, Luo S Y. 2022. Research on spatial-temporal evolution and influencing mechanism of rural landscape from the perspective of production-living-ecological function: Taking the north seven rural area of Xingtan in Shunde. Industrial Construction, 52(5): 24-33. (in Chinese)

[7]
Feng X J, Luo Z J, Xu J, et al. 2021. Suitability evaluation of urban-rural construction land development and evaluation of spatial pattern matching based on “production-living-ecological” space: Case study of Leping City in Jiangxi Province. Southwest China Journal of Agricultural Sciences, 34(9): 2014-2024. (in Chinese)

[8]
Gao H H, Wang Z Q, Wang T, et al. 2021. Optimizing the layout of rural settlements in Zhongquan Town under the coordination of three living spaces. Science of Surveying and Mapping, 46(3): 176-182. (in Chinese)

[9]
Gao S Q, Yang L, Jiao H Z. 2022. Changes in and patterns of the tradeoffs and synergies of production-living-ecological space: A case study of Longli County, Guizhou Province, China. Sustainability, 14(14): 8910. DOI: 10.3390/su14148910.

[10]
Geng S B, Zhu W R, Shi P L. 2019. A functional land use classification for ecological, production and living spaces in the Taihang Mountains. Journal of Resources and Ecology, 10(3): 246-255.

DOI

[11]
Harvey C, Aultman-Hall L. 2016. Measuring urban streetscapes for livability: A review of approaches. The Professional Geographer, 68(1): 149-158.

DOI

[12]
Jiang F M, Xu Z H, Wang J F, et al. 2022. Identification and zoning of complex ecological functions in territorial space: A case study of Huzhou City of Zhejiang Province. Journal of Zhejiang University (Agriculture & Life Sciences), 48(2): 227-239. (in Chinese)

[13]
Jiang M Q, Liu Y. 2020. Discussion on the concept definition and spatial boundary classification of “production-living-ecological” space. Urban Development Studies, 27(4): 43-48, 61. (in Chinese)

[14]
Kong X S, Jiang X J, Liu Y, et al. 2020. Spatiotemporal coupling between territorial space development intensity and resource environmental carrying capacity and its planning implications: A case study of Jiangsu Province. China Land Science, 34(6): 10-17. (in Chinese)

[15]
Li J T, Sun Z F. 2020. Urban function orientation based on spatiotemporal differences and driving factors of urban construction land. Journal of Urban Planning and Development, 146(3): 0000587. DOI: 10.1061/(ASCE)UP.1943-5444.0000587.

[16]
Li M W, Xun Y H, Chen W Q, et al. 2018. Ciassification and spatial-temporal analysis of “production-living-ecological” spaces in Henan Province. Chinese Journal of Agricultural Resources and Regional Planning, 39(9): 13-20. (in Chinese)

[17]
Li W W, Yi P T. 2020. Assessment of city sustainability—Coupling coordinated development among economy, society and environment. Journal of Cleaner Production, 256: 120453. DOI: 10.1016/j.jclepro.2020.120453.

[18]
Li X, Fang B, Yin R M, et al. 2020. Spatial pattern and association of production-living-ecological function and life quality on the village scale: A case of Yangzhong City, Jiangsu Province. Scientia Geographica Sinica, 40(4): 599-607. (in Chinese)

DOI

[19]
Li Y J, Zhang W Z, Tian S C, et al. 2008. Review of the theories and methods of livable city. Progress in Geography, 27(3): 101-109. (in Chinese)

[20]
Liu S X, Huang Y. 2020. Evaluation and coupling coordination analysis of landscape ecological security of Wanzhou District from the perspective of production-life-ecological space. Research of Soil and Water Conservation, 27(6): 308-316. (in Chinese)

[21]
Liu Y. 2016. On the logical structure, the mechanism of checks and balances, and development principles of the “production-life-ecological space”. Hubei Social Sciences, (3): 5-9. (in Chinese)

[22]
Liu Y, Dong W, Wang N D, et al. 2021. Analysis on the coupling coordination relationship between characteristic culture city and new urbanization: A case study of five cities in China. Urban Development Studies, 28(12): 27-36. (in Chinese)

[23]
Mahmoudi M, Ahmad F, Abbasi B. 2015. Livable streets: The effects of physical problems on the quality and livability of Kuala Lumpur streets. Cities, 43: 104-114.

DOI

[24]
Mohammadian H D, Rezaie F. 2019. Sustainable innovative project management: Response to improve livability and quality of life: Case studies: Iran and Germany. Inventions, 4(4): 59. DOI: 10.3390/inventions4040059.

[25]
Namini R S, Loda M, Meshkini A, et al. 2019. Comparative evaluation of livability indicators of the metropolitan Tehran’s districts. International Journal of Urban Sustainable Development, 11(1): 48-67.

DOI

[26]
Paul A. 2020. Developing a methodology for assessing livability potential: An evidence from a metropolitan urban agglomeration (MUA) in Kolkata, India. Habitat International, 105: 102263. DOI: 10.1016/j.habitatint.2020.102263.

[27]
Paul A, Sen J. 2018. Livability assessment within a metropolis based on the impact of integrated urban geographic factors (IUGFs) on clustering urban centers of Kolkata. Cities, 74: 142-150.

DOI

[28]
Peng N L, Wang K L, Zhang Y L, et al. 2022. A new proposition of urban development in the context of ecological civilization: Exploring the path of park city construction in new age. Urban Development Studies, 29(5): 21-25. (in Chinese)

[29]
Saeed U, Ahmad S R, Mohey-ud-din G, et al. 2022. An integrated approach for developing an urban livability composite index—A cities’ ranking road map to achieve urban sustainability. Sustainability, 14(14): 8755. DOI: 10.3390/su14148755.

[30]
Shan J K, Chao P L. 2022. Research status and trend of livable cities in China based on CiteSpace. On Economic Problems, (4): 43-48. (in Chinese)

[31]
Wang C, Tang N. 2018. Spatio-temporal characteristics and evolution of rural production-living-ecological space function coupling coordination in Chongqing Municipality. Geographical Research, 37(6): 1100-1114. (in Chinese)

DOI

[32]
Wang C H, Zhou X. 2022. Overall shaping of livable block under the context of livable city: A case study of the project of Kunshan Chinese garden provincial livable model block. Modern Urban Research, (5): 76-82. (in Chinese)

[33]
Wei L Y, Zhang Y J, Wang L Z, et al. 2021. Spatiotemporal evolution patterns of “production-living-ecological” spaces and the coordination level and optimization of the functions in Jilin Province. Sustainability, 13(23): 13192. DOI: 10.3390/su132313192.

[34]
Wen X, Chen C. 2022. Study on the spatio-temporal evolution of ecosystem service value in Chongqing section of Yangtze River basin based on ecological-production-living spaces. Journal of Chongqing Normal University (Natural Science), 39(3): 128-140. (in Chinese)

[35]
Xi G L, Zhen F, Qian X T. 2022. Territory spatial security and planning strategies from the perspective of mobility. Journal of Natural Resources, 37(8): 1935-1945. (in Chinese)

DOI

[36]
Zhan D S, Kwan M P, Zhang W Z, et al. 2018. Assessment and determinants of satisfaction with urban livability in China. Cities, 79: 92-101.

DOI

[37]
Zhang C W, Zhan K Q, Guo Y W, et al. 2021a. Evaluating livability of urban space with consideration of the interactive characteristics of ecological-living-productive spaces: A case of Wuhan City. Bulletin of Surveying and Mapping, (1): 124-129. (in Chinese)

[38]
Zhang H Q, Xu E Q, Zhu H Y. 2017. Ecological-living-productive land classification system in China. Journal of Resources and Ecology, 8(2): 121-128.

DOI

[39]
Zhang W Z. 2007. Study on intrinsic meanings of the livable city and the evaluation system of livable city. Urban Planning Forum, 169(3): 30-34. (in Chinese)

[40]
Zhang Y, Li Q Z, Wang H Y, et al. 2019. Community scale livability evaluation integrating remote sensing, surface observation and geospatial big data. International Journal of Applied Earth Observation and Geoinformation, 80: 173-186.

DOI

[41]
Zhang Y L, Luan Q L, Xiong C S, et al. 2021b. Spatial heterogeneity evaluation and zoning of production-living-ecological space based on multi-source spatial data. Transactions of the Chinese Society of Agricultural Engineering, 37(10): 214-223, 317. (in Chinese)

[42]
Zhao G Y, Song J S. 2020. The analysis of planning logic in the demarcation of “three zones and three lines”. Urban Development Studies, 27(8): 13-19, 58. (in Chinese)

[43]
Zhao R, Liu X M. 2021. Analysis on spatial-temporal changes and driving forces of “production-livingecological” spaces in Beijing-Tianjin-Hebei metropolitan area. Ecological Economy, 37(4): 201-208. (in Chinese)

[44]
Zhu R M, Chen S L. 2021. Characteristics and optimization of territorial space in Fujian Province based on production-living-ecological functions. Bulletin of Soil and Water Conservation, 41(4): 323-330, 2. (in Chinese)

Outlines

/