
Journal of Resources and Ecology >
How Does Livelihood Public Service Affect Urban Green Development Efficiency? Evidence from 281 Cities in China
|
MENG Xia, E-mail: mengxia@cug.edu.cn |
Received date: 2023-08-06
Accepted date: 2023-10-30
Online published: 2024-03-14
Supported by
The National Social Science Foundation of China(19BJY010)
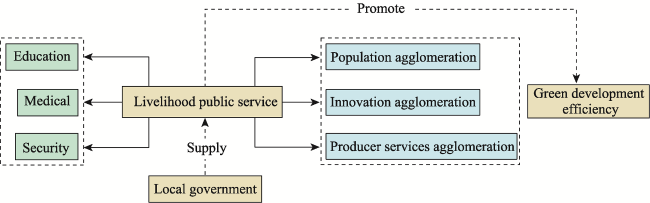
In the new stage of China’s economic development, significant transformations have occurred in the mode, emphasis and speed of urban development. Enhancing the level of livelihood public service and promoting the green development of cities have emerged as the prevailing themes of contemporary urban development. Based on a theoretical model analysis, using the panel data of 281 cities in China from 2007 to 2020, this paper adopts the fixed-effect model for empirical analysis. The study revealed the following four main points. (1) The provision of livelihood public services can effectively enhance the efficiency of urban green development. After conducting a series of robustness tests, this conclusion is still valid. (2) The provision of livelihood public services only fosters the green transformation of non-resource-based cities, while its impact on resource-based cities remains non-significant. (3) The mechanism test demonstrated that livelihood public services promote green development efficiency mainly through population, innovation and producer services agglomeration. (4) The threshold effect test showed that there are differences in the nonlinear relationship between the livelihood public service level and urban green development efficiency under different threshold variables.
MENG Xia , DING Tao . How Does Livelihood Public Service Affect Urban Green Development Efficiency? Evidence from 281 Cities in China[J]. Journal of Resources and Ecology, 2024 , 15(2) : 304 -316 . DOI: 10.5814/j.issn.1674-764x.2024.02.006
Fig. 1 Theoretical framework |
Table 1 Descriptive statistics |
| Variable | Definition | Obs. | Mean | Std.D. | Min | Max |
|---|---|---|---|---|---|---|
| GDE | Green development efficiency | 3934 | 0.9982 | 0.0171 | 0.8910 | 1.2870 |
| poplife | Livelihood public service level | 3934 | 0.2970 | 0.2122 | 0.0285 | 2.3378 |
| education | Education level | 3934 | 0.1326 | 0.1047 | 0.0141 | 1.3150 |
| medical | Medical level | 3934 | 0.0647 | 0.0491 | 0.0001 | 0.6818 |
| security | Social security level | 3934 | 0.0997 | 0.0786 | 0.0017 | 0.7446 |
| popagg | Population agglomeration | 3934 | 0.8400 | 0.3455 | 0.0308 | 2.4294 |
| invagg | Innovation agglomeration | 3934 | 0.2932 | 0.5217 | 0.0001 | 4.7218 |
| seragg | Producer services agglomeration | 3934 | 0.7938 | 0.3154 | 0.0845 | 4.2904 |
| lnpgdp | The logarithm of per capita GDP | 3934 | 10.3506 | 0.6641 | 8.0171 | 12.3429 |
| gov | Local government competition | 3934 | -1.8845 | 1.8661 | -17.3985 | 0.3512 |
| is | Industrial structure | 3934 | 0.4016 | 0.0996 | 0.0858 | 0.8387 |
| rd | R&D input | 3934 | 0.0158 | 0.0156 | 0.0006 | 0.2068 |
| fdi | Foreign direct investment | 3934 | 0.0181 | 0.0188 | 0.0000 | 0.1984 |
| lnproad | The logarithm of per capita road area | 3934 | 1.1040 | 0.9121 | -1.9059 | 4.3816 |
| finance | Financial development level | 3934 | 0.9351 | 0.5993 | 0.0753 | 9.6221 |
Table 2 Benchmark regression results |
| Variable | (1) GDE | (2) GDE | (3) GDE | (4) GDE | (5) GDE (2007-2012) | (6) GDE (2013-2020) |
|---|---|---|---|---|---|---|
| poplife | 0.0505*** | -0.0074 | 0.0812*** | |||
| (0.0032) | (0.0059) | (0.0061) | ||||
| education | 0.0506*** | |||||
| (0.0062) | ||||||
| medical | 0.1334*** | |||||
| (0.0121) | ||||||
| security | 0.1225*** | |||||
| (0.0069) | ||||||
| lnpgdp | -0.0021 | -0.0058** | -0.0060** | -0.0033 | 0.0037 | -0.0008 |
| (0.0024) | (0.0024) | (0.0024) | (0.0024) | (0.0035) | (0.0043) | |
| gov | 0.0002 | 0.0000 | 0.0001 | 0.0006** | 0.0005 | 0.0012** |
| (0.0003) | (0.0003) | (0.0003) | (0.0003) | (0.0003) | (0.0005) | |
| is | 0.0100 | 0.0024 | 0.0097 | 0.0078 | 0.0047 | -0.0059 |
| (0.0068) | (0.0069) | (0.0069) | (0.0067) | (0.0090) | (0.0102) | |
| rd | -0.0948*** | -0.0748*** | -0.0913*** | -0.0360 | -0.0997** | -0.0290 |
| (0.0262) | (0.0270) | (0.0268) | (0.0257) | (0.0397) | (0.0358) | |
| fdi | -0.0411** | -0.0625*** | -0.0617*** | -0.0358* | -0.0284 | -0.1390*** |
| (0.0191) | (0.0195) | (0.0193) | (0.0190) | (0.0226) | (0.0310) | |
| lnproad | -0.0011 | -0.0014* | -0.0014* | -0.0011 | 0.0001 | -0.0017 |
| (0.0008) | (0.0008) | (0.0008) | (0.0008) | (0.0009) | (0.0013) | |
| finance | -0.0016** | -0.0013* | -0.0012 | -0.0022*** | 0.0010 | -0.0002 |
| (0.0007) | (0.0008) | (0.0008) | (0.0007) | (0.0009) | (0.0010) | |
| _cons | 1.0064*** | 1.0557*** | 1.0534*** | 1.0230*** | 0.9614*** | 0.9861*** |
| (0.0258) | (0.0262) | (0.0258) | (0.0252) | (0.0362) | (0.0463) | |
| Control variables | Yes | Yes | Yes | Yes | Yes | Yes |
| City fixed effect | Yes | Yes | Yes | Yes | Yes | Yes |
| Year fixed effect | Yes | Yes | Yes | Yes | Yes | Yes |
| N | 3934 | 3934 | 3934 | 3934 | 1686 | 2248 |
| Adjusted R2 | 0.4437 | 0.4169 | 0.4256 | 0.4535 | 0.3419 | 0.6220 |
Note: The values above the parentheses are the estimated coefficients for each variable. The standard errors are in parentheses. *, ** and *** indicate statistical significance at the 10%, 5% and 1% levels, respectivley. The same below. |
Table 3 Heterogeneity analysis |
| Variable | (1) Non-resource-based cities | (2) Resource-based cities |
|---|---|---|
| poplife | 0.0640*** (0.0043) | -0.0059 (0.0052) |
| Control variables | Yes | Yes |
| City fixed effect | Yes | Yes |
| Year fixed effect | Yes | Yes |
| N | 2352 | 1582 |
| Adjusted R2 | 0.4493 | 0.4918 |
Table 4 Endogeneity test |
| Variable | First-stage poplife | Second-stage GDE |
|---|---|---|
| poplife | 0.0940*** (0.0195) | |
| iv | -0.0977*** (0.0094) | |
| Control variables | Yes | Yes |
| City fixed effect | Yes | Yes |
| Year fixed effect | Yes | Yes |
| Unidentifiable test (Anderson LM statistics) | 112.804 [0.000] | |
| Weak identification test (Cragg-Donald Wald F statistics) | 107.219 {16.38} | |
| N | 3934 | 3934 |
Note: iv represents instrumental variable. Values in brackets [ ] are P-values. Values in braces { } are critical values for the Stock-Yogo weak identification test at the 10% level. |
Table 5 Robustness test |
| Variable | (1) Replacing the core explanatory variable | (2) Lagging one period | (3) Replacing the explained variable | (4) Excluding the municipalities |
|---|---|---|---|---|
| popliferate | 0.0184*** (0.0058) | |||
| poplife | 0.0582*** (0.0036) | 0.8107*** (0.0763) | 0.0137*** (0.0029) | |
| Control variables | Yes | Yes | Yes | Yes |
| City fixed effect | Yes | Yes | Yes | Yes |
| Year fixed effect | Yes | Yes | Yes | Yes |
| N | 3934 | 3653 | 3934 | 3878 |
| Adjusted R2 | 0.4079 | 0.4753 | 0.4962 | 0.4749 |
Table 6 Mechanism test: Population agglomeration |
| Variable | (1) popagg | (2) GDE | (3) GDE |
|---|---|---|---|
| poplife | 0.0901*** (0.0310) | 0.0502*** (0.0032) | |
| popagg | 0.0049*** (0.0018) | 0.0036** (0.0017) | |
| Control variables | Yes | Yes | Yes |
| City fixed effect | Yes | Yes | Yes |
| Year fixed effect | Yes | Yes | Yes |
| N | 3934 | 3934 | 3934 |
| Adjusted R2 | 0.8741 | 0.4075 | 0.4442 |
Table 7 Mechanism test: Innovation agglomeration |
| Variable | (1) invagg | (2) GDE | (3) GDE |
|---|---|---|---|
| poplife | 1.0814*** (0.0355) | 0.0450*** (0.0036) | |
| invagg | 0.0136*** (0.0014) | 0.0450*** (0.0036) | |
| Control variables | Yes | Yes | Yes |
| City fixed effect | Yes | Yes | Yes |
| Year fixed effect | Yes | Yes | Yes |
| N | 3934 | 3934 | 3934 |
| Adjusted R2 | 0.9275 | 0.4218 | 0.4453 |
Table 8 Mechanism test: Production services agglomeration |
| Variable | (1) seragg | (2) GDE | (3) GDE |
|---|---|---|---|
| poplife | 0.1300*** (0.0376) | 0.0495*** (0.0032) | |
| seragg | 0.0091*** (0.0015) | 0.0078*** (0.0014) | |
| Control variables | Yes | Yes | Yes |
| City fixed effect | Yes | Yes | Yes |
| Year fixed effect | Yes | Yes | Yes |
| N | 3934 | 3934 | 3934 |
| Adjusted R2 | 0.7770 | 0.4125 | 0.4482 |
Table 9 Threshold effect regression results |
| Variable | Threshold variables and values | |
|---|---|---|
| (1) GDE (1.0256) | (2) poplife (0.6330) | |
| -0.0018 (0.0024) | 0.0151*** (0.0050) | |
| 0.1000*** (0.0024) | 0.0376*** (0.0035) | |
| Control variables | Yes | Yes |
| City fixed effect | Yes | Yes |
| Year fixed effect | Yes | Yes |
| N | 3934 | 3934 |
| Adjusted R2 | 0.5635 | 0.1108 |
| [1] |
|
| [2] |
|
| [3] |
|
| [4] |
|
| [5] |
|
| [6] |
|
| [7] |
|
| [8] |
|
| [9] |
|
| [10] |
|
| [11] |
|
| [12] |
|
| [13] |
|
| [14] |
|
| [15] |
|
| [16] |
|
| [17] |
|
| [18] |
|
| [19] |
|
| [20] |
|
| [21] |
|
| [22] |
|
| [23] |
|
| [24] |
|
| [25] |
|
| [26] |
|
| [27] |
|
| [28] |
|
| [29] |
|
| [30] |
|
| [31] |
|
| [32] |
|
| [33] |
|
| [34] |
|
| [35] |
|
| [36] |
|
| [37] |
|
| [38] |
|
| [39] |
|
| [40] |
|
| [41] |
|
/
| 〈 |
|
〉 |