
Journal of Resources and Ecology >
Assessing the Potential of Agroforestry for Climate Change Adaptation: A Case Study from Lamjung, Nepal
Received date: 2022-11-20
Accepted date: 2023-05-20
Online published: 2024-03-14
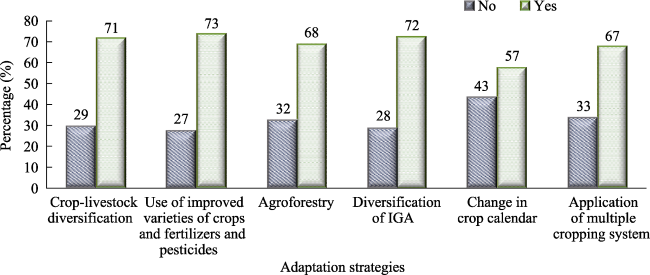
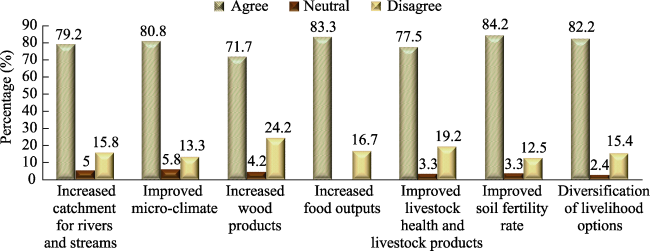
Agroforestry systems present multiple benefits which include enrichment of soil quality via the use of fertilizer trees, provision of a micro climate due to tree canopies and generation of forest products such as firewood and other medicinal outputs. Agroforestry helps in better land management, livelihood diversification and to increase the land productivity. However, the debate on the role of agroforestry to help as a climate change adaption strategy has been increasing among the policy makers and other stakeholders. The purpose of this study was to assess the potential of agroforestry as a climate change adaptation strategy. The data were primarily collected from 120 respondents in Taksar of Lamjung District through questionnaire survey. A Chi-square test and binary logistic model were used to analyze the factors influencing household choice of adaptation strategies to climate change. Similarly, regular triangulation and verification of the obtained data were made through interviews, discussions and observations followed by the analysis of documents. The study reveals that the farmers adopt many strategies in response to climate change. These strategies include crop-livestock diversification (71%), use of improved varieties of crops, fertilizers and pesticides (73%), agroforestry (68%), diversification of income generating activities (72%), change in crop calendar (57%) and multiple cropping strategies (67%). From the Chi-square test and binary logistic model, it was found that “farming experience” and “educational level” along with “farm size” and “gender” have a significant role on climate change adaptation strategies. Agroforestry possesses different benefits like increased catchment for rivers (79.2%), improved micro-climate (80.8%), increased wood products (71.7%), increased food outputs (83.3%), improved livestock health and livestock products (77.5%), improved soil fertility rate (84.2%) and diversification of livelihood options (82.2%). Given the findings, the study concludes that agroforestry is an approach to agricultural production that can reduce the impacts of climate change on local environment. The major recommendation from this study is that promotion and adoption of agroforestry can help local communities as an adaptation option to climate change impacts.
Key words: climate change; adaptation strategies; local community; multiple cropping
JOSHI Rajeev , TAMANG Gyanu Maya , BHANDARI Prativa , SHARMA Bharat , JOSHI Dikshya , BHUSAL Shushma . Assessing the Potential of Agroforestry for Climate Change Adaptation: A Case Study from Lamjung, Nepal[J]. Journal of Resources and Ecology, 2024 , 15(2) : 280 -292 . DOI: 10.5814/j.issn.1674-764x.2024.02.004
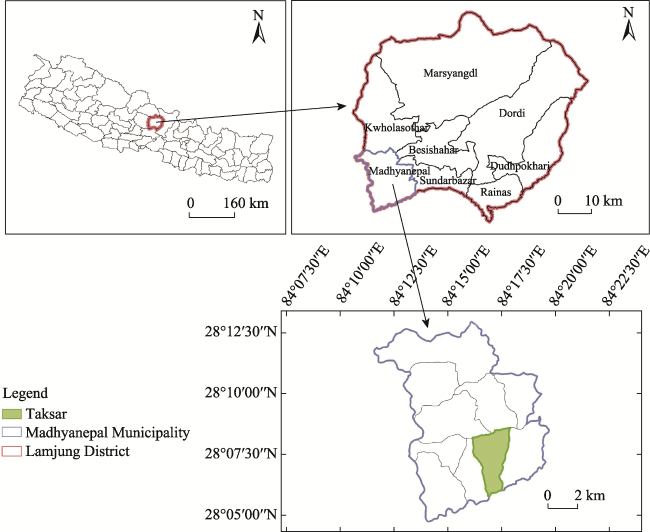
Fig. 1 Map of the study area |
Y=Dependent variables (farmers’ choice of adaptation strategies)
X1 to X7=Explanatory variables
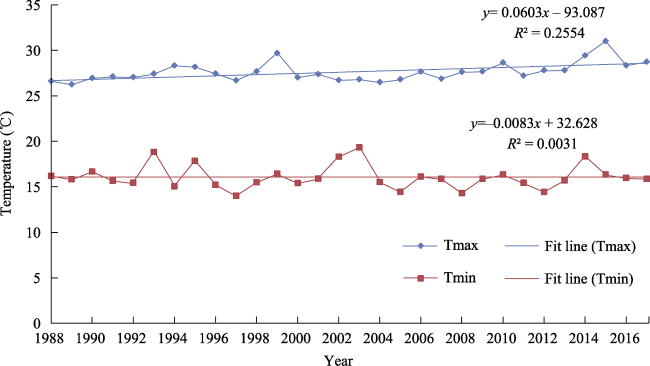
Fig. 2 Average annual temperature trend of Lamjung District |
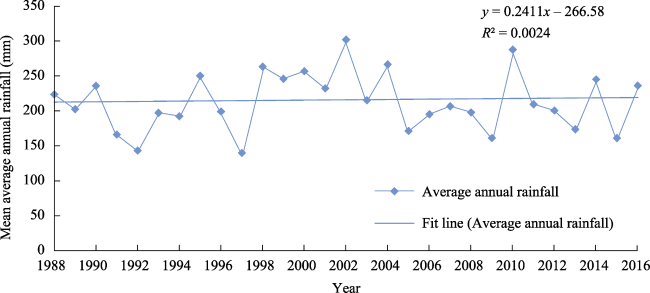
Fig. 3 Average annual rainfall trend of Lamjung District |
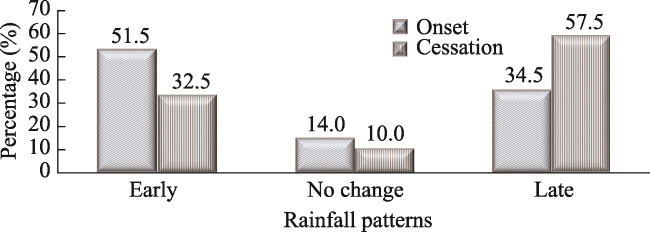
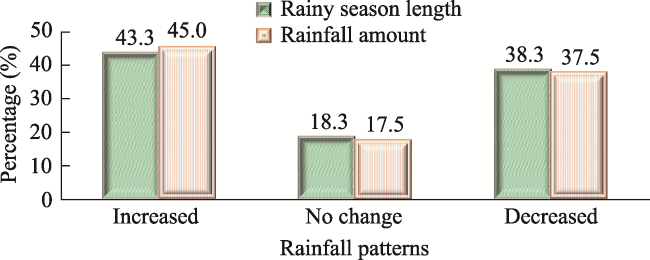
Fig. 4 Perception of respondents on change in rainfall pattern |
Fig. 5 Perception of respondents on change of rainfall pattern |
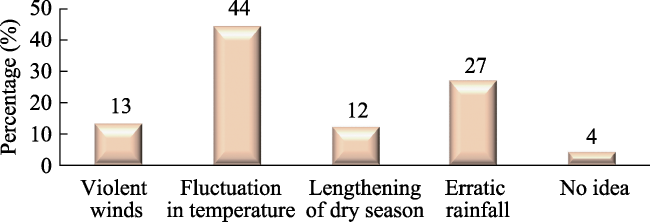
Fig. 6 Perception of respondents on climate change |
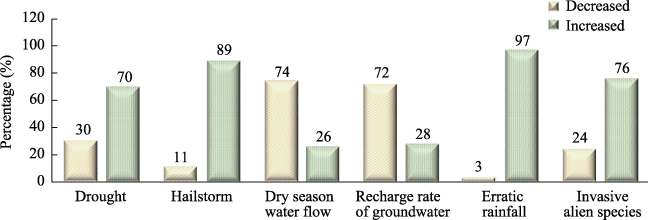
Fig. 7 Perception of respondents on climate change events occurrence in the study area |
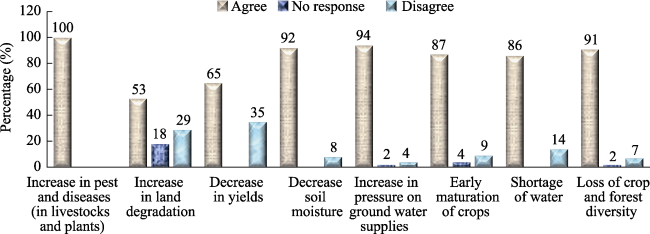
Fig. 8 Perception of respondents on effects of climate change |
Fig. 9 Adaptation strategies of respondents to cope with climate change |
Table 1 Definitions and descriptions of independent variables |
| Variables | Variable description | Variable type |
|---|---|---|
| R_gender | Gender of the respondent (1=Male) | B |
| R_age | Age of the respondent (Years) | C |
| R_hh_sz | Household size of the respondent | C |
| R_education | Level of education of the respondent (0=Illiterate) | B |
| R_farm_exp | Farming experience of the respondent (0=No) | B |
| R_farm_sz | Farm size of the respondent | C |
| R_wealth_class | Well-being ranking of the respondent (0=Poor) | B |
Note: C = Continuous; B = Binary. |
Table 2 Chi-square test of different adaptation strategies applied by respondents of Taksar |
| Independent Variables | Crop-livestock diversification | Use of improved variety crops and chemical fertilizers | Agroforestry | Diversification of IGA | Change in crop calendar | Multiple cropping | ||||||
|---|---|---|---|---|---|---|---|---|---|---|---|---|
| χ2 | P-value | χ2 | P-value | χ2 | P-value | χ2 | P-value | χ2 | P-value | χ2 | P-value | |
| R_gender | 0.176 | 0.675 | 2.865 | 0.091 | 1.035 | 0.309 | 5.153 | 0.023* | 0.642 | 0.423 | 0.691 | 0.406 |
| R_age | 46.127 | 0.550 | 42.197 | 0.709 | 37.559 | 0.861 | 40.653 | 0.765 | 38.935 | 0.822 | 42.860 | 0.683 |
| R_hh_sz | 12.151 | 0.434 | 13.612 | 0.326 | 13.266 | 0.350 | 12.913 | 0.375 | 11.437 | 0.492 | 13.679 | 0.322 |
| R_education | 0.701 | 0.402 | <0.001 | 0.984 | 0.411 | 0.521 | 12.061 | 0.001* | 1.117 | 0.291 | 0.703 | 0.402 |
| R_farm_exp | 53.786 | <0.001 | 58.582 | <0.001 | 47.539 | <0.001 | 0.257 | 0.613 | 8.182 | 0.004* | 45.671 | <0.001 |
| R_farm_sz | 80.113 | 0.002** | 62.135 | 0.083 | 103.00 | <0.001 | 53.498 | 0.271 | 98.617 | <0.001 | 90.975 | <0.001 |
| R_wealth_class | 21.859 | <0.001 | 5.398 | 0.020** | 26.300 | <0.001 | 0.218 | 0.641 | 29.407 | <0.001 | 16.874 | <0.001 |
Note: * and ** denote 1% and 5% level of significance, respectively. |
Table 3 Binary logistic analysis of different adaptation strategies applied by respondents of Taksar (N=120) |
| Independent variables | Crop-livestock diversification | Use of improved variety crops and chemical fertilizers | Agroforestry | Diversification of IGA | Change in crop calendar | Multiple cropping | ||||||
|---|---|---|---|---|---|---|---|---|---|---|---|---|
| Coefficients | S.E. | Coefficients | S.E. | Coefficients | S.E. | Coefficients | S.E. | Coefficients | S.E. | Coefficients | S.E. | |
| R_gender | 0.440 | 0.927 | 0.131 | 0.721 | 0.579 | 1.375 | 0.032** | 0.544 | 0.072 | 0.765 | 0.209 | 0.798 |
| R_age | 0.031 | 0.047 | 0.676 | 0.027 | 0.367 | 0.065 | 0.846 | 0.021 | 0.840 | 0.025 | 0.107 | 0.034 |
| R_hh_size | 0.142 | 0.182 | 0.484 | 0.132 | 0.586 | 0.305 | 0.002* | 0.120 | 0.679 | 0.129 | 0.545 | 0.155 |
| R_education | 0.130 | 0.934 | 0.604 | 0.713 | 0.851 | 1.704 | 0.002* | 0.542 | 0.448 | 0.704 | 0.120 | 0.838 |
| R_farm_exp | 0.093 | 1.478 | 0.001* | 1.204 | 0.022** | 4.436 | 0.092 | 0.911 | 0.012** | 1.182 | 0.015** | 1.427 |
| R_farm_sz | 0.001* | 1.327 | 0.034** | 0.648 | 0.014** | 7.458 | 0.382 | 0.537 | <0.001 | 1.295 | <0.001 | 1.084 |
| R_wealth_class | 0.220 | 0.892 | 0.169 | 0.731 | 0.321 | 1.464 | 0.773 | 0.647 | 0.661 | 0.787 | 0.663 | 0.814 |
Note: * and ** denote 1% and 5% level of significance, respectively. |
Fig. 10 Role of agroforestry to cope with climate change |
| [1] |
|
| [2] |
|
| [3] |
|
| [4] |
|
| [5] |
|
| [6] |
CBS. 2014. Population monograph of Nepal. Kathmandu, Nepal: Central Bureau of Statistics.
|
| [7] |
|
| [8] |
|
| [9] |
|
| [10] |
|
| [11] |
|
| [12] |
|
| [13] |
|
| [14] |
IPCC. 2012. Managing the risks of extreme events and disasters to advance climate change adaptation. In: A special report of working groups I and II of the intergovernmental panel on climate change. New York, USA: Cambridge University Press.
|
| [15] |
IPCC. 2014. Summary for policymakers. In: Climate change 2014: Mitigation of climate change. IPCC working group III contribution to AR5. Cambridge, UK: Cambridge University Press.
|
| [16] |
|
| [17] |
|
| [18] |
|
| [19] |
|
| [20] |
|
| [21] |
|
| [22] |
|
| [23] |
|
| [24] |
|
| [25] |
MoPE. 2010. National adaptation programme of action to climate change. Kathmandu, Nepal: Ministry of Environment.
|
| [26] |
MoPE. 2012. Mountain environment and climate change in Neepal:National report prepared for the international conference of mountain countries on climate change. Kathmandu, Nepal: Ministry of Environment.
|
| [27] |
|
| [28] |
|
| [29] |
|
| [30] |
|
| [31] |
|
| [32] |
|
| [33] |
|
/
| 〈 |
|
〉 |