
Journal of Resources and Ecology >
The Impact of Agricultural Technology Services on the Efficiency of Green Grain Production: An Analysis based on the Generalized Stochastic Forest Model
|
ZHANG Yuedong, E-mail: 891665109@qq.com |
Received date: 2023-09-05
Accepted date: 2023-11-15
Online published: 2024-03-14
Supported by
The Major Project Funding for Social Science Research Base in Fujian Province Social Science Planning(FJ2022MJDZ022)
The green production of food currently faces the challenge of technological shortage. As agricultural technology services are an important source of technical knowledge for farmers, it is of great significance to explore how agricultural technology services influence the efficiency of green food production in order to improve its productivity. This study utilized data from the China Land and Economy Survey (CLES). Firstly, the three-stage DEA model was used to calculate the efficiency of green food production. Secondly, the generalized random forest model was used to empirically test the impact, heterogeneity, and pathways of agricultural technology services on the efficiency of green food production. This study found that: (1) Agricultural technology services have a significant positive impact on the efficiency of green food production. Among the stages, pre-production and mid-production agricultural technology services significantly improve the efficiency of green food production. However, post-production agricultural technology services do not show a significant impact. Additionally, the combination of agricultural technology services has a significant improvement effect on the efficiency of green food production. (2) The marginal effects of resource allocation by farmers have heterogeneity in terms of the impact on the efficiency of agricultural technology services in improving green food production. An increase in the proportion of the family agricultural labor force and the expansion of family-operated arable land scale significantly reduce the returns of agricultural technology services. (3) An analysis of mechanism variables showed that agricultural technology services mainly affect the efficiency of green food production through pesticide and fertilizer usage behavior, and significantly contribute to its improvement. The government should expand the scope of agricultural technology services and fully utilize their potential to improve the efficiency of green food production. Tailored strategies and policies should be implemented to guide the concept of green production during the provision of agricultural technology services, thereby promoting sustainable agricultural practices among farmers.
ZHANG Yuedong , ZHENG Yifang , XU Jiaxian . The Impact of Agricultural Technology Services on the Efficiency of Green Grain Production: An Analysis based on the Generalized Stochastic Forest Model[J]. Journal of Resources and Ecology, 2024 , 15(2) : 243 -257 . DOI: 10.5814/j.issn.1674-764x.2024.02.001
Table 1 Inputs and outputs of green production efficiency in food production |
| Variable | Variable name | Description of variable | Average value | Standard deviation | Minimum value | Maximum value |
|---|---|---|---|---|---|---|
| Input indicators | Land input | Area of the plot (ha) | 0.62 | 3.47 | 0.00 | 93.33 |
| Labor input | Number of labor invested in the plot (working hours) | 40.82 | 73.45 | 0.00 | 720.00 | |
| Capital investment | Number of land investment funds (yuan) | 31137.50 | 338131.20 | 0.00 | 10403319.50 | |
| Environmental variables | Situation of disasters | Number of disasters (times) | 0.60 | 1.09 | 0 | 4 |
| Soil type | 1=sandy; 2=loam; 3=clay | 2.44 | 0.89 | 1 | 3 | |
| Fertility (of soil) | 1=poor; 2=moderate; 3=good | 2.43 | 0.62 | 0 | 3 | |
| Output indicators | Rice output | Rice production (kg) | 5285.61 | 30539.86 | 0.50 | 840000.00 |
| Carbon footprint | Carbon emissions (t) | 562.58 | 5630.13 | 0.16 | 200968.95 |
Table 2 Descriptive statistics of the variables |
| Variable | Description of the variable | All | Control group | Treatment group | Difference (Control-treatment) | |
|---|---|---|---|---|---|---|
| Sample size (statistics) | 2264 | 1320 | 944 | |||
| Explanatory variable | Efficiency of green food production | Measured by three-stage DEA | 0.78 | 0.77 | 0.81 | -0.04*** |
| Control variable | Stability of land rights | Unspecified duration of land operation = 1 Land operation for a definite period of less than 5 years = 2 Land operation for a definite period of 5 to 10 years = 3 Land operation with a definite duration > 10 years = 4 Contracted land = 5 | 4.47 | 4.56 | 4.33 | 0.23*** |
| Planting subsidies | Number of subsidies received for planting (yuan) | 5474.06 | 1981.95 | 10000 | -8400*** | |
| Distinguishing between the sexes | 0 = female; 1 = male | 0.86 | 0.84 | 0.89 | -0.05*** | |
| (a person’s) age | Actual age (years) | 60.92 | 62.12 | 59.26 | 2.86*** | |
| Cultures | Educational attainment | 2.72 | 2.57 | 2.92 | -0.35*** | |
| Health status | Health status from low to high 1 to 5 | 4.04 | 3.92 | 4.20 | -0.28*** | |
| Geographical position | Distance to county, hospital, bank; entropy value gained, value range: 0-1 | 0.77 | 0.77 | 0.76 | 0.01 | |
| Economics | Whether it is an economically weak village, 0=No; 1=Yes | 0.14 | 0.16 | 0.11 | 0.04*** | |
| Transportation | Distance to high speed rail, highways, paved roads; Entropy value obtained | 0.32 | 0.33 | 0.32 | 0.01* | |
| Proportion of agricultural labor force | Household participation in agricultural labor/Family labor force | 0.55 | 0.54 | 0.58 | -0.04*** | |
| Scale of household farmland operations | 1 = Operating area of 5 acres or less 2 = Operating area of 5 acres to 50 acres 3 = Operating area of 50 acres or more | 1.54 | 1.40 | 1.73 | -0.34*** | |
| Mechanism variable | Agricultural film recycling | Whether they recycle agricultural films, 0=No; 1=Yes | 0.04 | 0.03 | 0.04 | -0.01 |
| Pesticide use | Use of low-toxicity pesticides, 0=No; 1=Yes | 0.67 | 0.65 | 0.75 | -0.10*** | |
| Fertilizer use | Whether they use organic fertilizers, formulated fertilizers, 0=No; 1=Yes | 0.05 | 0.03 | 0.07 | -0.04*** | |
| Type of technical service | Prenatal technical services | Access to network information services, agricultural policy information services, capital credit and other services are assigned a value of 1, while the rest are assigned a value of 0 | 0.44 | - | - | - |
| Mid-production technical services | Access to good seeds, soil testing and fertilizer application services, crop cultivation management services, pest control technology, water-saving irrigation technology, etc., are assigned a value of 1, while the rest are assigned a value of 0 | 0.30 | - | - | - | |
| Pre-production technical services | Access to crop straw utilization technology, agricultural market information services, agricultural product processing insurance technology and other services are assigned a value of 1, while the rest are assigned a value of 0 | 0.03 | - | - | - | |
Note: *, **, *** denote coefficients significant at the 10%, 5%, and 1% levels, respectively. The same below. |
Table 3 Basic regression results |
| Variable name | OLS | TRM | OLS+FE | TRM+FE | FE+PSM |
|---|---|---|---|---|---|
| (1) | (2) | (3) | (4) | (5) | |
| Agricultural technical services | 0.041*** | 0.041*** | 0.043*** | 0.043*** | 0.042*** |
| (0.013) | (0.013) | (0.012) | (0.012) | (0.012) | |
| Stability of land rights | 0.052*** | 0.052*** | 0.052*** | 0.052*** | 0.052*** |
| (0.005) | (0.006) | (0.004) | (0.005) | (0.004) | |
| Planting subsidies | 0.000** | 0.000** | 0.000*** | 0.000*** | 0.000*** |
| (0.000) | (0.000) | (0.000) | (0.000) | (0.000) | |
| Distinguishing between the sexes | 0.011 | 0.011 | 0.015 | 0.015 | 0.012 |
| (0.018) | (0.018) | (0.018) | (0.018) | (0.018) | |
| Age | -0.004*** | -0.004*** | -0.003*** | -0.003*** | -0.003*** |
| (0.001) | (0.001) | (0.001) | (0.001) | (0.001) | |
| Cultures | -0.018** | -0.018** | -0.017** | -0.017** | -0.018** |
| (0.007) | (0.007) | (0.008) | (0.007) | (0.008) | |
| Health status | -0.014** | -0.014** | -0.011* | -0.011* | -0.012** |
| (0.006) | (0.006) | (0.006) | (0.006) | (0.006) | |
| Geographical position | -0.091*** | -0.091*** | -0.111*** | -0.111*** | -0.113*** |
| (0.031) | (0.031) | (0.029) | (0.031) | (0.029) | |
| Economics | -0.159*** | -0.159*** | -0.078*** | -0.078*** | -0.077*** |
| (0.017) | (0.017) | (0.026) | (0.020) | (0.026) | |
| Transportation | -0.082** | -0.082** | 0.062 | 0.062 | 0.059 |
| (0.040) | (0.040) | (0.072) | (0.051) | (0.072) | |
| Year fixed effects | No | No | Yes | Yes | Yes |
| Individual fixed effect | No | No | Yes | Yes | Yes |
| Constant | 0.962*** | 0.962*** | 0.916*** | 0.881*** | 0.919*** |
| (0.067) | (0.067) | (0.071) | (0.067) | (0.071) | |
| N | 2264 | 2264 | 2264 | 2264 | 2255 |
Note: The standard errors given in parentheses. |
Table 4 Generalized random forest estimation results |
| Variable name | Efficiency of green food production | |||
|---|---|---|---|---|
| (1) | (2) | (3) | (4) | |
| Agricultural technical services | 0.030*** (0.013) | 0.030** (0.013) | 0.030** (0.013) | 0.030** (0.013) |
| Number of trees | 500 | 1000 | 1500 | 2000 |
| Mould | Causal forest | Causal forest | Causal forest | Causal forest |
| Clustering | Yes | Yes | Yes | Yes |
| Observed value | 2264 | 2264 | 2264 | 2264 |
Note: The standard errors given in parentheses. |
Table 5 Split-sample estimation results |
| Variable | Efficiency of green food production | ||||||
|---|---|---|---|---|---|---|---|
| Pre-production | Mid-production | Post-production | Pre-production× Mid-production | Pre-production× Post-production | Mid-production× Post-production | Pre-production× Mid-production× Post-production | |
| Agricultural technical services | 0.027** (0.016) | 0.027* (0.014) | 0.043 (0.031) | 0.030* (0.016) | 0.069* (0.036) | 0.092* (0.050) | 0.125** (0.056) |
| Number of trees | 2000 | 2000 | 2000 | 2000 | 2000 | 2000 | 2000 |
| Clustering | Yes | Yes | Yes | Yes | Yes | Yes | Yes |
| Observed value | 2264 | 2264 | 2264 | 2264 | 2264 | 2264 | 2264 |
Note: The standard errors given in parentheses. |
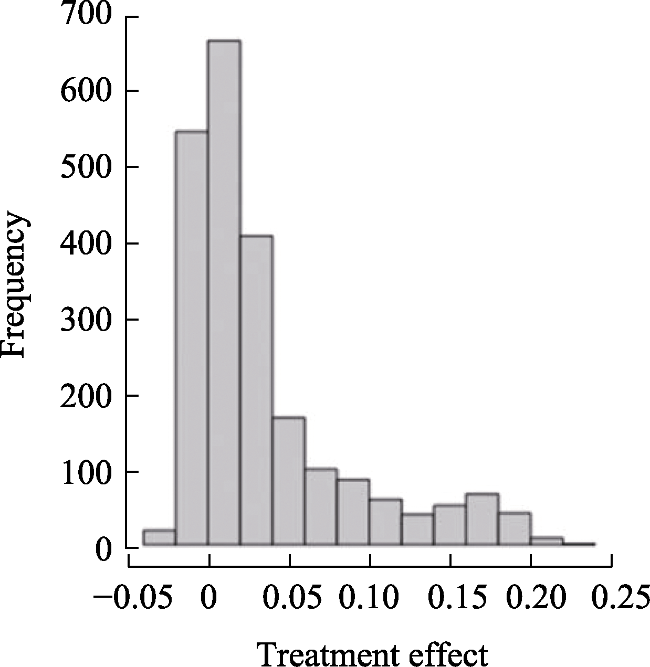
Fig. 1 Distribution of the treatment effects of agricultural technology services on green food production efficiency |
Table 6 Heterogeneity test |
| Variable | Ratio | Standard error |
|---|---|---|
| Average value | 1.060*** | 0.563 |
| Difference between groups | 0.700*** | 0.425 |
| Model | GRF | |
| Observed value | 2264 | |
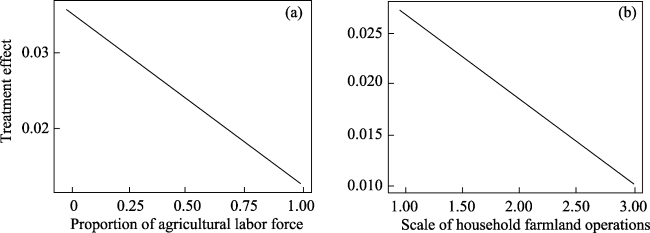
Fig. 2 Treatment effects of the proportion of working population in agriculture and the size of household farmland operations |
Table 7 Mechanism analysis |
| Impact of Panel A mechanism variables on green food production efficiency | |||
|---|---|---|---|
| Variable name | Efficiency of green food production | ||
| Agricultural film recycling | 0.108*** (0.032) | ||
| Pesticide use | 0.271*** (0.012) | ||
| Fertilizer use | 0.079*** (0.028) | ||
| Control variable | Controlled | Controlled | Controlled |
| Observed value | 2264 | 2264 | 2264 |
| Impact of Panel B mechanism variables on the efficiency of green food production | |||
| Variable name | Agricultural film recycling | Pesticide use | Fertilizer use |
| Agricultural technical services | -0.001 (0.007) | 0.053** (0.020) | 0.027** (0.011) |
| Tree volume | 2000 | 2000 | 2000 |
| Clustering | Yes | Yes | Yes |
| Observed value | 2264 | 2264 | 2264 |
Note: The standard errors given in parentheses. |
| [1] |
|
| [2] |
|
| [3] |
|
| [4] |
|
| [5] |
|
| [6] |
|
| [7] |
|
| [8] |
|
| [9] |
|
| [10] |
|
| [11] |
|
| [12] |
|
| [13] |
|
| [14] |
|
| [15] |
|
| [16] |
|
| [17] |
|
| [18] |
|
| [19] |
|
| [20] |
|
| [21] |
|
| [22] |
|
| [23] |
|
| [24] |
|
| [25] |
|
| [26] |
|
| [27] |
|
| [28] |
|
| [29] |
|
| [30] |
|
| [31] |
|
| [32] |
|
| [33] |
|
| [34] |
|
| [35] |
|
| [36] |
|
| [37] |
|
/
| 〈 |
|
〉 |