
Journal of Resources and Ecology >
Evaluation and Enhancement Model of the Development Potential of Green Tourism in Beijing’s Ecological Conservation Area
|
ZHENG Qianqian, E-mail: zqq19941226@163.com |
Received date: 2023-06-27
Accepted date: 2023-11-30
Online published: 2024-03-04
Supported by
The National Natural Science Foundation of China(42071199)
The Project to Improve the Basic Research Ability of Young and Middle-aged Teachers in Guangxi Universities(2021KY0808)
The National Social Science Fund of China(19BGJ017)
The Beijing Social Science Foundation of China(22GLB036)
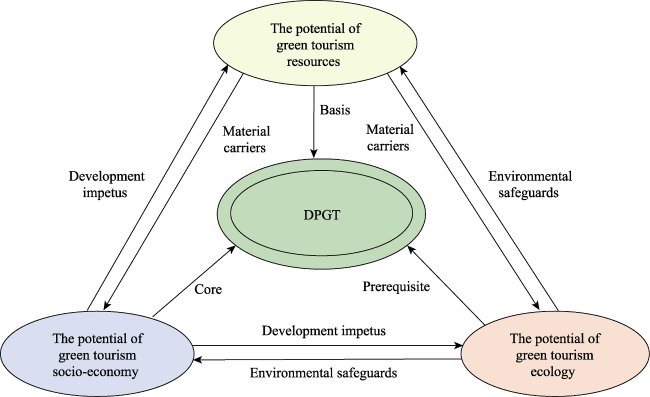
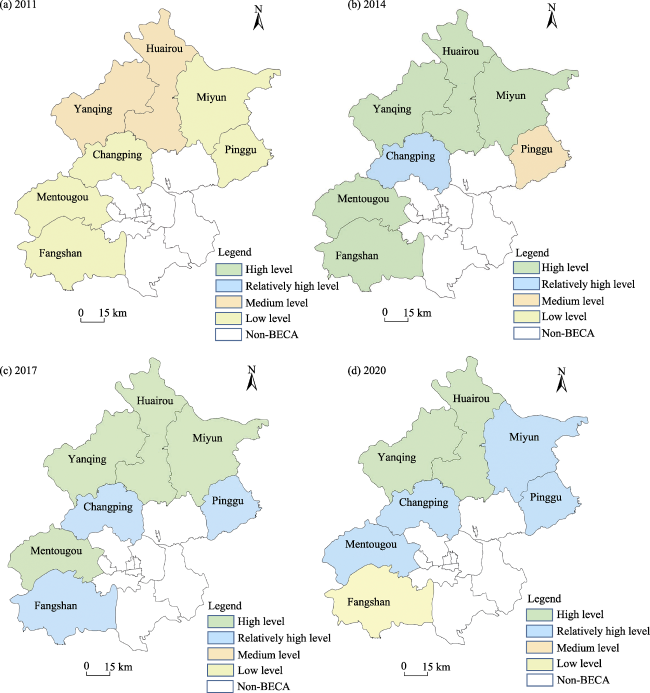
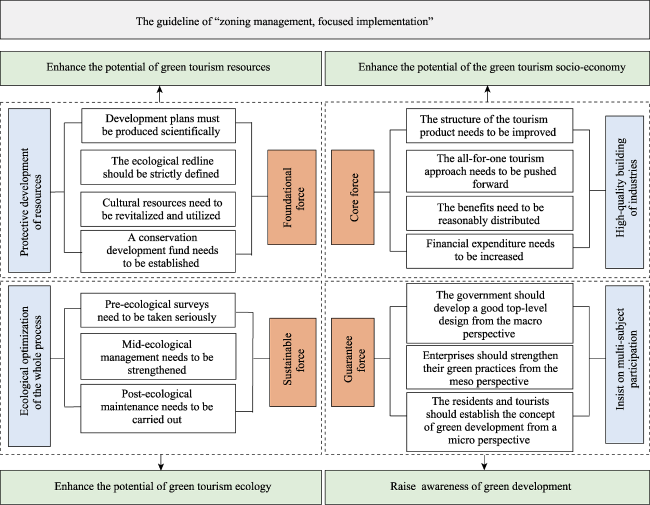
The large-scale and rapid development of tourism has led to many challenges in the sustainable development of Ecological Conservation Areas (ECAs). In this study, we constructed the model of the development potential of green tourism (DPGT) in ECAs. We then used this model to measure and analyze the spatial-temporal evolution of DPGT in Beijing’s Ecological Conservation Area (BECA), and built the enhancement model of DPGT in BECA. Our results demonstrate that the DPGT in BECA continued to rise from 2011 to 2020, showing the spatial characteristics of high in the north and low in the south. Each district has a different development focus, so differentiated management measures need to be implemented in the different areas. Finally, we built the enhancement model of DPGT in BECA, with “zoning management, focused implementation” as the guideline, protective development of resources as the basic force, ecological optimization of the whole process as the sustainable force, high-quality building of industries as the core force, and the insistence on multi-subject participation as the guarantee force. This study developed a new method to measure DPGT in ECAs, and provided a systematic management framework for green tourism and regional green development in ECAs.
ZHENG Qianqian , TANG Chengcai , ZHANG Ying . Evaluation and Enhancement Model of the Development Potential of Green Tourism in Beijing’s Ecological Conservation Area[J]. Journal of Resources and Ecology, 2024 , 15(2) : 484 -495 . DOI: 10.5814/j.issn.1674-764x.2024.02.023
Fig. 1 The framework for the analysis of DPGT |
Table 1 Indicator system for evaluating DPGT in ECAs |
| Object level | First-level indicator | Second-level indicator | Unit | Attribute | Weight | References |
|---|---|---|---|---|---|---|
| DPGT in ECAs (A) | Potential of green tourism resources (B1) | Proportion of A-level and above tourist attractions in the total local area (C1) | % | + | 0.0299 | - |
| Number of agricultural sightseeing parks (C2) | + | 0.0248 | Zhang et al. (2018) | |||
| Number of cultural heritages (C3) | + | 0.0582 | Zhang et al. (2016) | |||
| Number of national parks of China (C4) | + | 0.0206 | ||||
| Number of forest parks (C5) | + | 0.0195 | ||||
| Number of nature reserves (C6) | + | 0.0529 | ||||
| Number of historical and cultural towns (villages) (C7) | + | 0.0782 | ||||
| Number of cultural protection units (C8) | + | 0.0492 | ||||
| Number of geoparks (C9) | + | 0.0582 | ||||
| Number of traditional villages (C10) | + | 0.0511 | ||||
| Potential of green tourism ecology (B2) | Total energy consumption (C11) | 104 t | - | 0.0565 | Wo and Huang (2017) | |
| SO2 concentration (C12) | μg m-3 | - | 0.0219 | Ko (2005); Yuan and Xiang (2018) | ||
| NO2 concentration (C13) | μg m-3 | - | 0.0092 | |||
| PM10 concentration (C14) | μg m-3 | - | 0.0061 | |||
| Per capita waste discharge (C15) | t person-1 | - | 0.0092 | Tang et al. (2018) | ||
| Per capita sewage discharge (C16) | m3 person-1 | - | 0.0124 | |||
| Park area per capita (C17) | m2 | + | 0.0161 | Zhou et al. (2015) | ||
| Forest greening rate (C18) | % | + | 0.0043 | Angelstam et al. (2017) | ||
| Sewage treatment rate (C19) | % | + | 0.0061 | |||
| Harmless treatment rate of domestic garbage (C20) | % | + | 0.0007 | |||
| Rate of decrease of energy consumption per 104 yuan GDP (C21) | % | + | 0.0288 | |||
| Potential of the green tourism socio-economy (B3) | Total tourism revenue (C22) | 108 yuan | N | 0.0257 | Budeanu et al. (2016) | |
| Proportion of total tourism revenue to GDP (C23) | % | N | 0.0392 | Zhen (2014) | ||
| Tourism consumption expenditure per capita (C24) | yuan | N | 0.0378 | Carrillo and Jorge (2017) | ||
| Number of tourism companies (C25) | N | 0.0244 | Tang et al. (2018) | |||
| Proportion of tourist attraction revenue in total tourism revenue (C26) | % | N | 0.0277 | Aratuo and Etienne (2019) | ||
| Proportion of travel agency revenue in total tourism revenue (C27) | % | N | 0.0806 | |||
| Proportion of tourism accommodation income in total tourism income (C28) | % | N | 0.0211 | |||
| Proportion of tourism catering revenue in total tourism revenue (C29) | % | N | 0.0120 | |||
| Proportion of tourism business revenue in total tourism revenue (C30) | % | N | 0.0124 | |||
| Proportion of tourism transportation revenue in total tourism revenue (C31) | % | N | 0.0149 | |||
| Number of visitors (C32) | 104 | N | 0.0248 | Tian (2007) | ||
| Per capita environmental protection expenditure (C33) | 104 yuan | + | 0.0257 | Tian and Zhang (2018) | ||
| Per capita spending on science and technology (C34) | 104 yuan | + | 0.0398 | Vij and Vij (2012) |
Note: + represents a positive indicator; - represents a reverse indicator; N represents a neutral indicator. |
Table 2 The potential value of the DPGT in BECA from 2011 to 2020 |
| Item | District | 2011 | 2014 | 2017 | 2020 | 2011-2020 growth rate (%) |
|---|---|---|---|---|---|---|
| Qi-A | Mentougou | 43.87 | 59.43 | 59.26 | 54.56 | 24.37 |
| Yanqing | 46.59 | 57.71 | 57.79 | 61.15 | 31.25 | |
| Pinggu | 41.73 | 47.27 | 52.83 | 50.39 | 20.75 | |
| Huairou | 46.05 | 61.56 | 57.68 | 58.73 | 27.54 | |
| Miyun | 44.40 | 57.87 | 57.63 | 54.13 | 21.91 | |
| Changping | 42.35 | 51.01 | 52.96 | 50.17 | 18.47 | |
| Fangshan | 42.33 | 59.00 | 51.57 | 41.75 | -1.37 | |
| Qi-B1 | Mentougou | 10.48 | 14.47 | 14.80 | 13.41 | 27.96 |
| Yanqing | 10.00 | 11.73 | 11.75 | 12.08 | 20.80 | |
| Pinggu | 3.91 | 4.78 | 4.63 | 5.33 | 36.32 | |
| Huairou | 5.56 | 6.99 | 7.01 | 6.06 | 8.99 | |
| Miyun | 7.11 | 8.65 | 8.74 | 8.66 | 21.80 | |
| Changping | 10.49 | 12.03 | 12.52 | 12.08 | 15.16 | |
| Fangshan | 15.70 | 22.57 | 22.46 | 18.23 | 16.11 | |
| Qi-B2 | Mentougou | 12.10 | 21.77 | 23.58 | 21.02 | 73.72 |
| Yanqing | 18.75 | 26.52 | 24.03 | 24.58 | 31.09 | |
| Pinggu | 18.81 | 19.58 | 19.97 | 16.30 | -13.34 | |
| Huairou | 16.48 | 25.33 | 22.64 | 20.80 | 26.21 | |
| Miyun | 16.52 | 22.12 | 18.23 | 19.90 | 20.46 | |
| Changping | 13.68 | 18.75 | 19.10 | 17.93 | 31.07 | |
| Fangshan | 5.82 | 14.18 | 5.05 | 5.01 | -13.92 | |
| Qi-B3 | Mentougou | 21.29 | 23.18 | 20.88 | 20.14 | -5.40 |
| Yanqing | 17.84 | 19.46 | 22.01 | 24.49 | 37.28 | |
| Pinggu | 19.01 | 22.91 | 28.23 | 28.76 | 51.29 | |
| Huairou | 24.02 | 29.24 | 28.02 | 31.87 | 32.68 | |
| Miyun | 20.77 | 27.10 | 30.65 | 25.57 | 23.11 | |
| Changping | 18.18 | 20.22 | 21.34 | 20.15 | 10.84 | |
| Fangshan | 20.80 | 22.25 | 24.06 | 18.51 | -11.01 |
Note: Qi-A, Qi-B1, Qi-B2, and Qi-B3 indicate the values of DPGT in BECA, the potential of green tourism resources, the potential of green tourism ecology and the potential of the green tourism socio-economy, respectively. |
Table 3 Classification of the DPGT in BECA |
| District | 2011 | 2014 | 2017 | 2020 |
|---|---|---|---|---|
| Mentougou | Ⅳ | Ⅰ | Ⅰ | Ⅱ |
| Yanqing | Ⅲ | Ⅰ | Ⅰ | Ⅰ |
| Pinggu | Ⅳ | Ⅲ | Ⅱ | Ⅱ |
| Huairou | Ⅲ | Ⅰ | Ⅰ | Ⅰ |
| Miyun | Ⅳ | Ⅰ | Ⅰ | Ⅱ |
| Changping | Ⅳ | Ⅱ | Ⅱ | Ⅱ |
| Fangshan | Ⅳ | Ⅰ | Ⅱ | Ⅳ |
Fig. 2 Spatial differentiation of the DPGT in BECA |
Fig. 3 The enhancement model of DPGT in BECA |
| [1] |
|
| [2] |
|
| [3] |
|
| [4] |
|
| [5] |
|
| [6] |
|
| [7] |
|
| [8] |
|
| [9] |
|
| [10] |
|
| [11] |
|
| [12] |
|
| [13] |
|
| [14] |
|
| [15] |
|
| [16] |
|
| [17] |
|
| [18] |
|
| [19] |
|
| [20] |
|
| [21] |
|
| [22] |
|
| [23] |
|
| [24] |
|
| [25] |
|
| [26] |
|
| [27] |
|
| [28] |
|
| [29] |
|
| [30] |
|
| [31] |
|
| [32] |
|
| [33] |
|
| [34] |
|
| [35] |
|
| [36] |
|
| [37] |
|
| [38] |
|
| [39] |
|
/
| 〈 |
|
〉 |