
Journal of Resources and Ecology >
Resilience Assessment and the Diagnosis of Obstacles at Ancient Capital Tourism Sites
Received date: 2023-05-09
Accepted date: 2023-08-30
Online published: 2023-12-27
Supported by
The Henan Province Philosophy and Social Science Planning Project(2018CJJ069)
The Henan University of Finance and Economics and Law School-level Project([2021] 16)
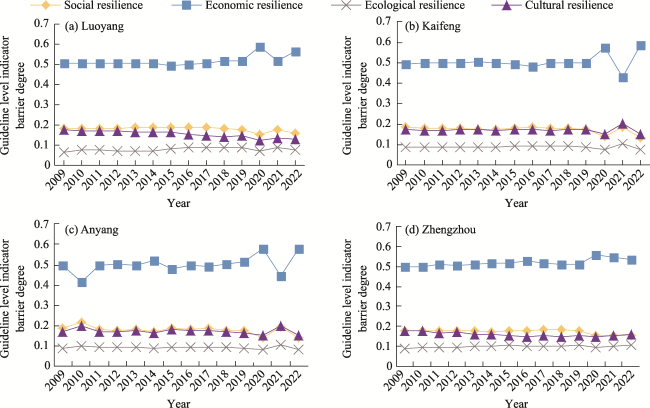
Based on the theory of resilience, this study utilized the panel data of the four major ancient capital tourist sites in Henan Province from 2009 to 2022 to construct a resilience evaluation index system that includes economic resilience, social resilience, cultural resilience, and ecological resilience. Then, with the help of the entropy-weighted TOPSIS method and an obstacle-degree model, the resilience levels of the ancient capital tourist sites in 2009‒2022 were measured and the factors that act as obstacles were identified. The findings can be summarized in terms of Comprehensive Resilience, Subsystem Resilience and Factors Acting as Barriers. (1) Comprehensive resilience:This study reveals disparities in the development of overall resilience in ancient city tourist destinations. Zhengzhou emerges as the leader with the highest overall resilience score of 0.577, followed by Luoyang. In contrast, Kaifeng and Anyang exhibit relatively lower levels of resilience development. (2) Subsystem resilience:Zhengzhou consistently maintains a relatively high level of resilience with minor fluctuations, while Luoyang occupies a mid-range position and exhibits a stable developmental trajectory. Conversely, Kaifeng and Anyang have consistently operated at lower resilience levels, and are characterized by slower developmental progress. (3) Factors acting as barriers:Distinct subsystem indicators exert varying degrees of influence as barriers for resilience within the ancient city tourist destinations, referred to as the “barrier degree”. Economic resilience consistently maintains the highest barrier degree among the subsystems, while social resilience and cultural resilience demonstrate relatively similar barrier degrees. In contrast, ecological resilience exhibits the lowest barrier degree. The factors that obstruct the enhancement of resilience in ancient city tourist destinations exhibit remarkable consistency, with minimal annual fluctuations. Notably, the total tourist growth rate stands out as the primary impediment that constrains resilience development, and it consistently demonstrates a high barrier degree.
WANG Yingjie , JIAO Shanshan , ZHU Xiaoyue . Resilience Assessment and the Diagnosis of Obstacles at Ancient Capital Tourism Sites[J]. Journal of Resources and Ecology, 2024 , 15(1) : 77 -89 . DOI: 10.5814/j.issn.1674-764x.2024.01.007
Table 1 Index system for measuring the resilience of ancient capital tourism sites |
| Target layer | System layer | Weight | Indicator layer | Unit | Indicator meaning (Nature) | Weight | Property |
|---|---|---|---|---|---|---|---|
| The level of resilience of the ancient capital tourist place | Economic resilience | 0.4970 | Growth rate of total tourism revenue (A1) | % | Tourism economic growth capacity | 0.1496 | + |
| Per capita disposable income of urban residents (A2) | yuan | Per capita payment capacity | 0.0108 | + | |||
| Total visitor growth rate (A3) | % | Tourism attractiveness | 0.1777 | + | |||
| GDP per capita (A4) | yuan | Economic strength | 0.0193 | + | |||
| Foreign direct investment amount (A5) | 108 USD | Degree of openness to the outside world | 0.0558 | + | |||
| Commodity retail price index (A6) | System consumption level | 0.0110 | ‒ | ||||
| Total retail sales of consumer goods (A7) | 104 yuan | Economic spending power | 0.0531 | + | |||
| Share of primary sector in GDP (A8) | % | Economic output is strongly influenced by natural factors | 0.0197 | ‒ | |||
| Social resilience | 0.1812 | Urbanization rate (B1) | % | Tourism market potential | 0.0051 | + | |
| Number of students in school (B2) | 104 person | Systematic learning ability | 0.0211 | + | |||
| Number of beds in medical and health institutions (B3) | Medical and health conditions | 0.0317 | + | ||||
| Natural population growth rate (B4) | % | Natural population growth | 0.0489 | ‒ | |||
| Share of science expenditure in fiscal expenditure (B5) | % | Science and technology investment efforts | 0.0266 | + | |||
| Share of education spending in fiscal spending (B6) | % | Education support efforts | 0.0031 | + | |||
| Share of social security and employment in fiscal spending (B7) | % | Social security capability | 0.0062 | + | |||
| Unemployment rate (B8) | % | Social stability | 0.0385 | ‒ | |||
| Cultural resilience 0.1690 | Number of scenic spots of grade 4A and above (C1) | Richness of cultural tourism resources | 0.0361 | + | |||
| Number of national-level intangible cultural heritage projects (C2) | Cultural resource endowment potential | 0.0035 | + | ||||
| National key cultural relics protection unit (C3) | Heritage resources protection efforts | 0.0289 | + | ||||
| Investment in fixed assets (C4) | 108 yuan | Investment intensity of the cultural industry | 0.0462 | + | |||
| Attendance at performances by performing arts organizations (C5) | 103 person | Public cultural participation | 0.0250 | + | |||
| Cultural exhibitions (C6) | freq | Cultural liveliness | 0.0293 | + | |||
| Ecological resilience 0.1528 | Greening coverage of built-up areas (D1) | % | Degree in urban greening construction | 0.0010 | + | ||
| Urban domestic sewage treatment rate (D2) | % | Sewage treatment rate strength | 0.0004 | + | |||
| Proportion of days with good air quality (D3) | % | Air quality changes due to tourism disturbance | 0.0091 | + | |||
| Population density (D4) | Person km-2 | Land pressure due to tourism disturbance | 0.0155 | ‒ | |||
| Harmless disposal rate of domestic waste (D5) | % | Solid waste disposal efforts | 0.0049 | + | |||
| Industrial wastewater discharge (D6) | 104 t | Ecological stress caused by wastewater | 0.0142 | ‒ | |||
| Afforestation area (D7) | 103 ha | Artificial maintenance of ecosystem strength | 0.0466 | + | |||
| Arable land area (D8) | 103 ha | Ecological stress due to farming | 0.0611 | ‒ | |||
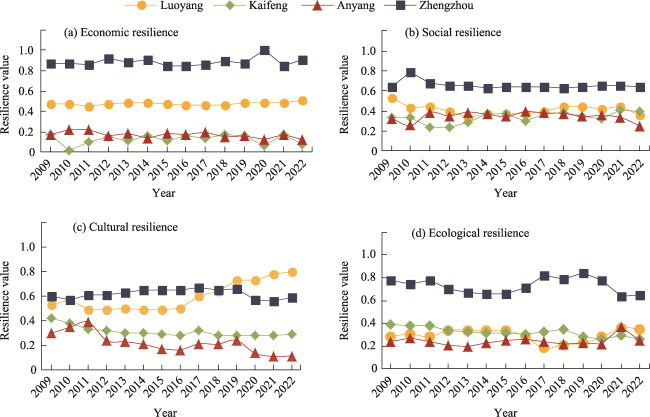
Table 2 The resilience levels of subsystems in ancient capital tourist destinations from 2009 to 2022 |
| Resilience system | City | 2009 | 2010 | 2011 | 2012 | 2013 | 2014 | 2015 | 2016 | 2017 | 2018 | 2019 | 2020 | 2021 | 2022 | Mean value |
|---|---|---|---|---|---|---|---|---|---|---|---|---|---|---|---|---|
| Economic resilience | Luoyang | 0.475 | 0.473 | 0.448 | 0.471 | 0.484 | 0.486 | 0.475 | 0.465 | 0.463 | 0.467 | 0.481 | 0.487 | 0.362 | 0.516 | 0.477 |
| Kaifeng | 0.167 | 0.018 | 0.101 | 0.152 | 0.116 | 0.157 | 0.110 | 0.163 | 0.134 | 0.174 | 0.158 | 0.070 | 0.293 | 0.075 | 0.126 | |
| Anyang | 0.172 | 0.217 | 0.225 | 0.156 | 0.190 | 0.141 | 0.184 | 0.176 | 0.192 | 0.144 | 0.164 | 0.130 | 0.372 | 0.123 | 0.170 | |
| Zhengzhou | 0.870 | 0.868 | 0.859 | 0.917 | 0.879 | 0.913 | 0.852 | 0.846 | 0.855 | 0.895 | 0.873 | 1.000 | 0.638 | 0.914 | 0.885 | |
| Social resilience | Luoyang | 0.531 | 0.430 | 0.451 | 0.398 | 0.340 | 0.370 | 0.367 | 0.378 | 0.400 | 0.452 | 0.444 | 0.425 | 0.443 | 0.357 | 0.413 |
| Kaifeng | 0.341 | 0.333 | 0.236 | 0.234 | 0.284 | 0.367 | 0.368 | 0.304 | 0.370 | 0.384 | 0.351 | 0.328 | 0.406 | 0.397 | 0.336 | |
| Anyang | 0.327 | 0.257 | 0.387 | 0.353 | 0.390 | 0.368 | 0.346 | 0.394 | 0.382 | 0.377 | 0.348 | 0.356 | 0.336 | 0.254 | 0.348 | |
| Zhengzhou | 0.645 | 0.783 | 0.674 | 0.653 | 0.653 | 0.631 | 0.647 | 0.645 | 0.647 | 0.625 | 0.644 | 0.653 | 0.653 | 0.636 | 0.656 | |
| Cultural resilience | Luoyang | 0.530 | 0.567 | 0.492 | 0.490 | 0.499 | 0.488 | 0.494 | 0.504 | 0.603 | 0.638 | 0.727 | 0.732 | 0.776 | 0.801 | 0.596 |
| Kaifeng | 0.421 | 0.383 | 0.326 | 0.317 | 0.300 | 0.295 | 0.291 | 0.277 | 0.324 | 0.278 | 0.282 | 0.282 | 0.283 | 0.286 | 0.310 | |
| Anyang | 0.298 | 0.345 | 0.388 | 0.239 | 0.228 | 0.207 | 0.173 | 0.164 | 0.211 | 0.209 | 0.240 | 0.136 | 0.109 | 0.113 | 0.219 | |
| Zhengzhou | 0.603 | 0.571 | 0.605 | 0.607 | 0.633 | 0.652 | 0.652 | 0.652 | 0.667 | 0.647 | 0.659 | 0.573 | 0.555 | 0.590 | 0.619 | |
| Ecological resilience | Luoyang | 0.286 | 0.308 | 0.283 | 0.342 | 0.341 | 0.335 | 0.336 | 0.288 | 0.183 | 0.214 | 0.228 | 0.279 | 0.523 | 0.351 | 0.295 |
| Kaifeng | 0.391 | 0.379 | 0.376 | 0.339 | 0.325 | 0.312 | 0.311 | 0.302 | 0.327 | 0.351 | 0.289 | 0.259 | 0.318 | 0.265 | 0.323 | |
| Anyang | 0.242 | 0.278 | 0.237 | 0.210 | 0.203 | 0.229 | 0.251 | 0.262 | 0.236 | 0.220 | 0.231 | 0.218 | 0.220 | 0.250 | 0.246 | |
| Zhengzhou | 0.773 | 0.743 | 0.777 | 0.699 | 0.670 | 0.664 | 0.662 | 0.711 | 0.817 | 0.786 | 0.844 | 0.781 | 0.429 | 0.649 | 0.730 |
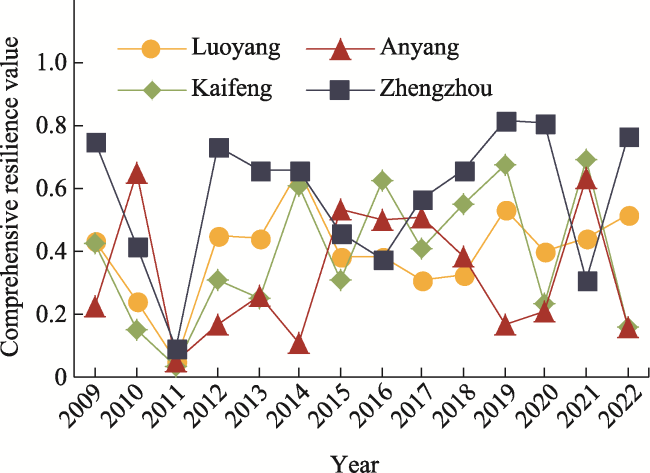
Table 3 Resilience values of the four ancient capitals in Henan Province |
| Resilience system | City | 2009 | 2010 | 2011 | 2012 | 2013 | 2014 | 2015 | 2016 | 2017 | 2018 | 2019 | 2020 | 2021 | 2022 | Mean value |
|---|---|---|---|---|---|---|---|---|---|---|---|---|---|---|---|---|
| Composite resilience | Luoyang | 0.433 | 0.243 | 0.050 | 0.449 | 0.441 | 0.658 | 0.383 | 0.382 | 0.307 | 0.323 | 0.532 | 0.402 | 0.446 | 0.516 | 0.398 |
| Kaifeng | 0.424 | 0.155 | 0.034 | 0.313 | 0.253 | 0.610 | 0.313 | 0.623 | 0.405 | 0.550 | 0.673 | 0.235 | 0.692 | 0.158 | 0.388 | |
| Anyang | 0.223 | 0.651 | 0.050 | 0.170 | 0.257 | 0.112 | 0.538 | 0.499 | 0.512 | 0.385 | 0.167 | 0.212 | 0.632 | 0.161 | 0.326 | |
| Zhengzhou | 0.746 | 0.415 | 0.097 | 0.735 | 0.661 | 0.657 | 0.661 | 0.379 | 0.568 | 0.655 | 0.814 | 0.805 | 0.313 | 0.768 | 0.577 |
Fig. 3 The trends in the degree to which guideline level indicators act as barriers |
Table 4 Degrees of influence of the main barriers in the indicator layer |
| City | 2010 | 2012 | ||||||||
|---|---|---|---|---|---|---|---|---|---|---|
| Factor 1 | Factor 2 | Factor 3 | Factor 4 | Factor 5 | Factor 1 | Factor 2 | Factor 3 | Factor 4 | Factor 5 | |
| Luoyang | A3(0.172) | A1(0.153) | D8(0.019) | A5(0.061) | C1(0.036) | A3(0.182) | A1(0.155) | D8(0.070) | A7(0.056) | C1(0.033) |
| Kaifeng | A3(0.175) | A1(0.145) | A5(0.061) | D8(0.059) | C3(0.030) | A3(0.174) | A1(0.148) | A5(0.060) | D8(0.060) | C3(0.030) |
| Anyang | A3(0.170) | D8(0.074) | A5(0.072) | A7(0.068) | C4(0.058) | A3(0.177) | A1(0.153) | D8(0.062) | C4(0.048) | C1(0.037) |
| Zhengzhou | A3(0.183) | A1(0.147) | A5(0.056) | A7(0.054) | C4(0.049) | A3(0.190) | A1(0.159) | B4(0.054) | A7(0.051) | C4(0.046) |
| City | 2014 | 2016 | ||||||||
| Factor 1 | Factor 2 | Factor 3 | Factor 4 | Factor 5 | Factor 1 | Factor 2 | Factor 3 | Factor 4 | Factor 5 | |
| Luoyang | A3(0.190) | A1(0.148) | D8(0.071) | A7(0.055) | C5(0.026) | A3(0.187) | A1(0.155) | D8(0.069) | B4(0.055) | C6(0.030) |
| Kaifeng | A3(0.175) | A1(0.150) | D8(0.060) | A5(0.060) | C1(0.036) | A3(0.177) | A1(0.130) | D8(0.062) | A5(0.061) | C1(0.037) |
| Anyang | A3(0.194) | A1(0.160) | D8(0.061) | A5(0.058) | C4(0.046) | A3(0.171) | A1(0.151) | D8(0.063) | A5(0.060) | C4(0.047) |
| Zhengzhou | A3(0.197) | A1(0.169) | B4(0.056) | D7(0.052) | C1(0.037) | A3(0.210) | A1(0.176) | B4(0.058) | D7(0.055) | C1(0.036) |
| City | 2018 | 2020 | ||||||||
| Factor 1 | Factor 2 | Factor 3 | Factor 4 | Factor 5 | Factor 1 | Factor 2 | Factor 3 | Factor 4 | Factor 5 | |
| Luoyang | A3(0.196) | A1(0.163) | D8(0.071) | A7(0.051) | C6(0.0238) | A3(0.248) | A1(0.201) | D8(0.065) | A7(0.046) | C1(0.023) |
| Kaifeng | A3(0.176) | A1(0.145) | D8(0.062) | A5(0.061) | C1(0.037) | A3(0.227) | A1(0.199) | D8(0.055) | A5(0.052) | C4(0.041) |
| Anyang | A3(0.179) | A1(0.151) | D8(0.063) | A5(0.060) | C1(0.037) | A3(0.243) | A1(0.185) | D8(0.055) | A5(0.052) | C1(0.032) |
| Zhengzhou | A3(0.199) | A1(0.169) | B4(0.062) | D7(0.056) | C6(0.035) | A3(0.236) | A1(0.192) | B4(0.050) | D7(0.047) | C1(0.033) |
| 2021 | 2022 | |||||||||
| Factor 1 | Factor 2 | Factor 3 | Factor 4 | Factor 5 | Factor 1 | Factor 2 | Factor 3 | Factor 4 | Factor 5 | |
| Luoyang | A3(0.179) | A1(0.173) | D8(0.079) | A7(0.054) | C1(0.028) | A3(0.256) | A1(0.162) | D8(0.069) | A7(0.048) | C1(0.024) |
| Kaifeng | A1(0.130) | A3(0.098) | D8(0.074) | A5(0.070) | C4(0.055) | A3(0.229) | A1(0.206) | D8(0.055) | A5(0.052) | C1(0.032) |
| Anyang | A1(0.141) | A3(0.108) | A5(0.068) | D8(0.066) | C1(0.042) | A3(0.239) | A1(0.188) | D8(0.054) | A5(0.052) | C6(0.028) |
| Zhengzhou | A3(0.232) | A1(0.190) | D7(0.055) | B4(0.047) | C6(0.036) | A1(0.202) | A3(0.200) | D7(0.057) | B4(0.046) | C6(0.037) |
Note:Only the top 5 factors acting as barriers are listed. |
| [1] |
|
| [2] |
|
| [3] |
|
| [4] |
|
| [5] |
|
| [6] |
|
| [7] |
|
| [8] |
|
| [9] |
|
| [10] |
|
| [11] |
|
| [12] |
|
| [13] |
|
| [14] |
|
| [15] |
|
| [16] |
|
| [17] |
|
| [18] |
|
| [19] |
|
| [20] |
|
| [21] |
|
| [22] |
|
| [23] |
|
| [24] |
|
| [25] |
|
| [26] |
|
| [27] |
|
| [28] |
|
/
| 〈 |
|
〉 |