Ecotourism

The Evolution of Resilience and the Obstacles Facing the Tourism Socio-Ecological System (TSES) in Hainan Province

  • QI Zhenying ,
  • KANG Jiaqi ,
  • YOU Changjiang , *
Expand
  • School of Tourism, Hainan University, Haikou 570228, China
*YOU Changjiang, E-mail:

Received date: 2023-04-04

  Accepted date: 2023-07-20

  Online published: 2023-12-27

Supported by

The National Natural Science Foundation of China(41561111)

The National Natural Science Foundation of China(41061054)

Abstract

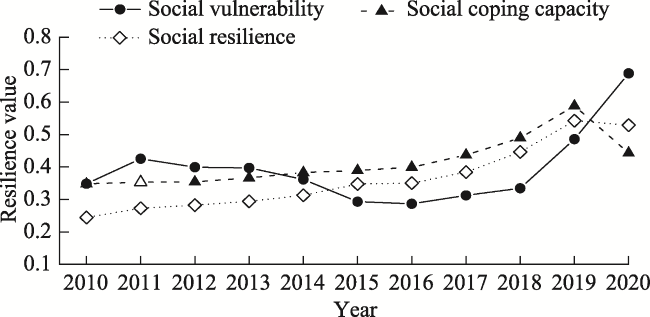
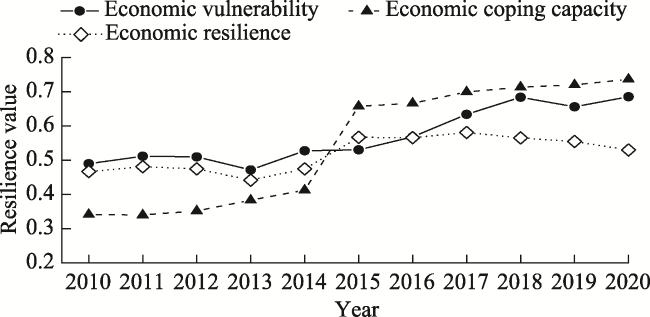
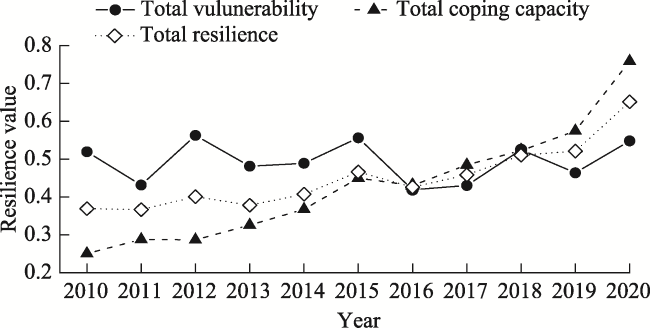
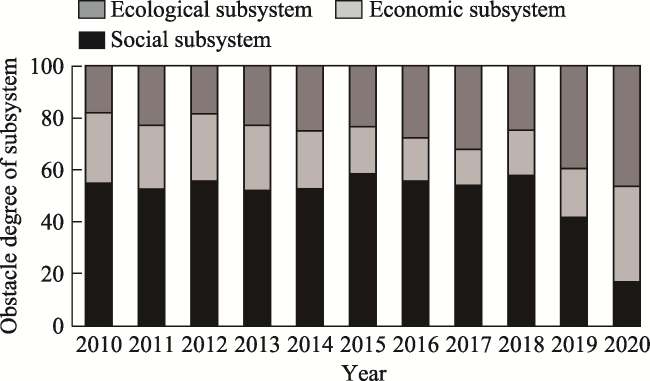
As a pioneer demonstration area of tourism development in China, tourism has become the pillar industry of Hainan Province, and tourism activities have become the main disturbance impacting the socio-ecological system in Hainan Province. Analyzing the evolutionary trend of resilience and factors influencing the TSES in Hainan Province is crucial for exploring the local sustainable tourism development path. To achieve that, we first built the resilience evaluation index system for TSES in Hainan Province. Using the entropy weight method-gray correlation-TOPSIS comprehensive analysis model, an obstruction degree model was used to analyze the evolution of resilience and the factors influencing TSES between 2010 and 2020. The results indicate that the resilience of TSES in Hainan Province showed a steady upward trend from 2010 to 2020, and it has remained in the medium stage. Among the subsystems, the resilience of the social subsystem increased steadily from the low stage to the medium stage. The resilience of the economic subsystem was in the middle stage, rising at first and then declining. The overall resilience of the ecological subsystem declined slowly, showing a trend of downward-upward-downward- upward, and was in the medium stage. In terms of influencing factors among the three subsystems, the social subsystem had the highest degree of obstruction during 2010-2018, while the ecological subsystem had the greatest degree of obstruction in 2019-2020. For the degrees of obstruction by individual factors, there were 11 major factors, including the proportion of the added value of tertiary industry in GDP, and among them the factors belonging to the social subsystem appeared most frequently. Therefore, the resilience of TSES in Hainan Province is in the process of continuous development, but there is still much room for improvement. For improving the resilience of TSES, it is important to effectively identify the obstacles and take corresponding measures in a timely manner.

Cite this article

QI Zhenying , KANG Jiaqi , YOU Changjiang . The Evolution of Resilience and the Obstacles Facing the Tourism Socio-Ecological System (TSES) in Hainan Province[J]. Journal of Resources and Ecology, 2024 , 15(1) : 66 -76 . DOI: 10.5814/j.issn.1674-764x.2024.01.006

1 Introduction

As an important part of marine resources, islands are an important carrier for realizing and expanding the Marine economy. China has many types of islands with rich resources, including more than 11000 large and small islands (Li et al., 2022b). In recent years, island tourism has developed rapidly, and its industry structure has gradually transformed into the tertiary industry of tourism services in some islands, which has contributed important strength to the realization of the marine economy (Li et al., 2021). However, as a special region with a sensitive environment, most islands have the characteristics of being far from the mainland, with a small land area, a simple geographical structure, few biological species, poor system stability, limited environmental carrying capacity, and other features of vulnerability. Tourism development will inevitably bring many irreversible impacts on the social development, economic structure and ecological environment of islands, and tourism activity often becomes the main disturbance of the local socio-ecological system (Mike and Geoffrey, 2004; Wang and Liu, 2013; You et al., 2021; Zhao et al., 2021). Therefore, studying the sustainable development of island tourism is of great significance.
The Tourism socio-ecological system (TSES) is a complex system formed by the interaction of tourism-related people, the tourism industry and the ecological environment. Within this system, the social, economic and ecological subsystems interact to form a human-earth system with specific functions based on tourism activities (Chen and Yang, 2011; 2012). The concept of resilience originated in the field of materials science. It was introduced into the field of ecology in 1973 (Holling, 1973), and it has been continuously interpreted and developed in different fields since then, such as ecology, disaster science, geography, regional science and engineering. In the field of ecology, the three most influential views of resilience are: engineering resilience, ecological (ecosystem) resilience/social resilience, and socio-ecological resilience (Folke, 2006; Wang et al., 2017). Compared with engineering and ecological resilience, socio- ecological resilience is more focused on the system’s adaptive capacity, transformability, learning and innovation, which is very important for the sustainable development of the system (Li et al., 2014). The resilience of TSES is the amount of disturbance that the TSES can tolerate before moving into different state spaces that are controlled by different processes. It has three meanings: 1) The amount of disturbance that the system can absorb and remain in the same state; 2) The degree to which the system can self-organize; and 3) The degree to which the system can build and improve its learning and adaptative capability (Folke et al., 2010). The relevant studies have mainly focused on its concept and quantitative measurement. There are two primary methods for measuring it. The first is to calculate it using the resilience formula or model based on how it relates to vulnerability (Shen, 2014). The other employs resilience as the theoretical and methodological framework, measuring it by constructing a resilience evaluation index system of the socio-ecological system (SES) based on the social, economic and ecological subsystems, from the perspective of both vulnerability and coping capacity (Espeso et al., 2020). The current research focuses mostly on cities or communities with mature tourism development or regions that are rich in tourism characteristics, such as arid areas, and less attention has been paid to island-type tourism destinations.
As a typical tropical island, tourism has developed into a pillar industry in Hainan Province (Qin, 2020; Chu et al., 2020). However, there are still problems such as unbalanced development and singular tourism products, and the sustainability of tourism development is being challenged (Wang et al., 2018). Therefore, taking Hainan Province as the research object, this study created a resilience evaluation index system for the TSES in Hainan Province and used methods such as the entropy weight method, grey correlation analysis, the TOPSIS comprehensive analysis model and the obstruction degree model to analyze the evolutionary characteristics of resilience and obstacles facing TSES in Hainan Province from 2010 to 2020. This analysis has some theoretical significance and also serves to guide the province of Hainan’s sustainable development strategy.

2 Study area

Hainan Province is located in the south of China (3°18°00ʺ- 20°04°12ʺN, 108°09°00ʺ-120°03°00ʺE), with a total land area of about 3.52×10⁴ km2, including Haikou, Sanya, and 19 other cities and counties, and it is a typical island-type tourist destination (Wang et al., 2018). Increasing numbers of visitors are being drawn to the distinctive tropical coastline resources, prehistoric forests and biological landscapes, good ecological environment, livable climatic conditions, and distinctive history and culture of the ethnic minority. Before 1988, Hainan Island was a part of Guangdong Province’s administrative territory, and its tourism industry was essentially undeveloped. The State Council suggested the building of Hainan International Tourism Island in December 2009, and since then, local infrastructure service facilities for the tourism industry were greatly enhanced, and the level of tourism development has substantially increased. In 2018, the State Council proposed the strategic positioning of Hainan Province as an International Tourism Consumption Center, and its level of tourism development has been further improved. By the end of 2020, Hainan Province had 54 scenic spots of 3A level and above, including six 5A level scenic spots, 28 4A level scenic spots, and 10 national reserves. Tourism revenue in 2020 reached 87.26 billion yuan, accounting for 15.8% of the GDP in Hainan Province, and the total number of tourists received reached 64.55 million, so tourism has become the pillar industry of Hainan Province (Wu and Li, 2012).

3 Methods

3.1 Data sources

The basic study data were obtained from the official 2010-2020 Hainan Statistical Yearbook, produced by the Statistics Bureau of Hainan Province, the Statistical Bulletin of National Economic and Social Development of Hainan Province published by the government of Hainan Province, and The Monitoring Data of Marine Environmental Quality published by the Department of Ecology and Environment of Hainan Province. Some missing data were filled in by averaging the data of adjacent years.

3.2 Construction of the resilience evaluation index system

A socio-ecological system is a complex system formed by the interactions between humans and the environment, including social, economic and ecological aspects (Cumming et al., 2005; Zhang et al., 2022). At present, there is no unified research paradigm for the resilience evaluation index system of SES. Most studies have constructed it from the two perspectives of vulnerability and coping capacity, based on the three sub-systems of society, economy and ecology. The selection of evaluation indexes is directly related to the research area and type of system. For example, Wang et al. (2015) and He et al. (2022) conducted a diachronic measurement of resilience from the two perspectives of vulnerability and coping capacity based on the three sub-systems of society, economy and ecology. Wang et al. (2021), in combination with the actual situation of Dabie Mountain, a poor mountainous area, highlighted the impact of the proportion of cultivated land area and pesticide yield on the local TSES when selecting the indicators. Li et al. (2022a) combined the characteristics of cultural tourism resources in arid areas, and added the dimension of the cultural subsystem in the construction of a resilience evaluation index system. Therefore, this study drew on the existing research results, combined the actual situation of Hainan Province, followed the principle of scientific validity and feasibility, and constructed the resilience evaluation index system of TSES in Hainan Province from the two perspectives of vulnerability and coping capacity based on the three social, economic and ecological subsystems. The weights of factors were all determined by the entropy weight method (Table 1).
Table 1 Resilience evaluation index system of TSES in Hainan Province
Target level Subsystem level Project level Indicator Interpretation and nature of the indicator Weight
Resilience evaluation index system of TSES in Hainan
Province
Social
subsystems
Vulnerability C1 Tourism population density Demographic structure (-) 0.0199
C2 Natural population growth rate Demographic characteristics (*) 0.0745
C3 Urban unemployment registration rate Social stability (-) 0.0135
C4 Number of criminal cases established Social security (-) 0.0144
Coping
capacity
C5 Social security and employment as a proportion of local general public budget expenditure Investment of social security (+) 0.0249
C6 Culture, education, health and science as a proportion of local general public budget expenditure Investment in the culture, education, health and science (+) 0.0314
C7 Number of medical beds per million people Health care conditions (+) 0.0248
C8 Balance of deposits in domestic and foreign currencies of financial institutions Social storage status (+) 0.0259
C9 Number of tourist hotels Social reception capacity (+) 0.0154
C10 Number of public toilets Level of infrastructure development (+) 0.0373
C11 Urbanization rate Level of society modernization (+) 0.0417
C12 Mileage in highways open to traffic Internal transportation convenience (+) 0.0282
C13 Total postal and telecommunications operations Level of communication infrastructure development (+) 0.0683
C14 Average distance of civil passenger transportation External accessibility (+) 0.0789
Economic
subsystems
Vulnerability C15 Total tourist arrivals Tourism scale (+) 0.0257
C16 Total tourism revenue Tourism benefits (+) 0.0259
C17 Tertiary sector employees as a proportion of employed persons Capacity of employment generated by tourism (+) 0.0201
C18 Ratio of tertiary sector in GDP Dependence of economy on the tertiary sector (*) 0.0222
C19 Pull coefficient index of tourism revenue Pulling power of tourism to other
industries (+)
0.0522
Coping
capacity
C20 GDP per capita Overall economic level (+) 0.0195
C21 Disposable income of urban and rural residents per capita Economic level of inhabitants (+) 0.0234
C22 Financial self-sufficiency rate Level of response to risk (+) 0.0406
C23 Fixed asset investment amount Intensity of investment (+) 0.0173
Ecological
subsystems
Vulnerability C24 Tourism spatial density Land pressure due to tourism activities (-) 0.0209
C25 Forest coverage rate Natural conditions (+) 0.0088
C26 The proportion of days with air quality above Grade II in the effective monitoring days in the whole year Air quality (+) 0.0165
C27 Number of typhoons registered annually Impact of natural disasters on the
environment (-)
0.0579
C28 Proportion of first-class water quality in near-shore waters of major tourist areas Impact of tourism activities on water quality (+) 0.0254
C29 Total annual water supply in cities per capita Ecological stress due to water use (-) 0.0179
Coping
capacity
C30 Urban domestic sewage treatment rate Capacity of wastewater treatment (+) 0.0281
C31 Harmless treatment rate of household garbage Capacity of solid waste disposal (+) 0.0087
C32 Ratio of environmental protection expenditure to local general public budget expenditure Investment in environmental spending (+) 0.0264
C33 Area of park green space per capita Level of ecological conservation (+) 0.0434

Note: “+”, “-” and “*” represent the nature of the impact of the listed factors on resilience, where “+” means positive factors, “-” means negative factors, and “*” indicates moderate values.

3.2.1 Selection of factors in the social subsystem

The social subsystem is the inherent support of TSES. Its factors mainly evaluate the five aspects of social security, social stability, social expenditure, social public utilities and social storage. For social security, the number of established criminal cases was chosen; for social stability, the tourism population density and the natural population growth rate were chosen; for social expenditure, the factors of social security and employment as a percentage of local general public budget expenditure were chosen; and for culture, education, health, and science as a percentage of local general public budget expenditure were chosen; the number of medical beds per million people, the mileage of roads open to traffic, the number of public toilets, total postal and telecommunications operations and urbanization rate were chosen for social public utilities; and the balance of deposits in domestic and foreign currencies of financial institutions was selected for social storage (Wang et al., 2016; Zhan and Gai, 2018; Yu, 2019; Li et al., 2022a). Considering the special geographical location of Hainan Province, which is far from the mainland and surrounded by the sea, tourists prefer air transportation over rail and water transportation, so the average distance of civil passenger transportation was introduced to measure the external accessibility of TSES. In addition, the number of tourist hotels was introduced as an indicator to measure the social reception capacity of the TSES.

3.2.2 Selection of factors in the economic subsystem

The core of TSES is the economic subsystem, which was primarily assessed in terms of four factors: industrial structure, economic stability, the effect of tourism on economic development, and economic investment. For industrial structure, tertiary sector employment as a percentage of total employment, the tertiary sector’s share of GDP, and fiscal self-sufficiency rates were chosen; for economic stability, total tourist arrivals, total tourism revenue, GDP per capita, and the disposable income of urban and rural residents per capita were chosen; the pull coefficient index of tourism revenue was selected for the impact of tourism on economic development; and the fixed asset investment amount was selected for measuring economic investment (Yang, 2006; Liu et al., 2015; Wu et al., 2017).

3.2.3 Selection of factors in the ecological subsystem

The ecological subsystem is the guarantee and bearer of TSES, and the selected factors mainly evaluate four aspects of the environmental condition, ecological conservation capacity, impact of tourism activities on the ecological environment, and ecological management. The ecological environmental conditions were measured by the parameters of forest coverage rate and the proportion of days with air quality above Grade II in the effective monitoring days in the whole year; tourism spatial density and total annual water supply in cities per capita were selected for the impact of tourism activities on the ecological environment; the ecological conservation capacity was represented by the area of park green space per capita and the ratio of environmental protection expenditure to local general public budget expenditure; and ecological management was measured by the harmless treatment rate of household garbage and the urban domestic sewage treatment rate (Yin et al., 2017; Zhang et al., 2019; Ma et al., 2020; Zhao et al., 2021). In view of the characteristics of the “3S (Sun, Shine, and Sea)” tourism activities in Hainan Province, the proportion of first-class water quality in near-shore waters of major tourist areas was also selected to measure the impact of tourism activities on the ecological environment. Finally, considering the geographic location of Hainan Province, number of typhoons registered annually was selected to measure the impact of natural disasters on the ecological environment.

3.3 Entropy weight method-grey correlation-TOPSIS comprehensive analysis model

TOPSIS (Approximate Ideal Solution Ranking) is a method of ranking the merits of each evaluation object by ranking the closeness between the evaluation object and the ideal solution (Wu et al., 2017). A multi-component statistical analysis technique called grey correlation analysis examines the degree of connection between each influencing element and the index in the system. Based on the synthesis of the advantages and disadvantages of each of these two methods and considering objectivity, this study used the entropy weight method-gray correlation-TOPSIS integrated analysis model for the analysis. The specific idea behind this method is assuming that 11 sample scenarios (m = 11) of resilience of the SES in Hainan Province from 2010 to 2020 are evaluated, containing 33 evaluation factors (n = 33), and the corresponding values of each indicator are xij (i, j = 1, 2, 3,...), then this constitutes a decision matrix of X = {xij }m×n. The specific calculation steps are detailed in the literature (Bu et al., 2020).
(1) Obtain the standardized decision matrix Y = {Yij }m×n by using the extreme difference standardization method to standardize the data according to the nature of each indicator.
(2) Determine the weight of each indicator according to the entropy value method as W={w1, w2,..., w33}.
(3) Calculate the weighted normalized decision matrix based on the obtained weights as Z = {Zij}m×n, Zij = wi×Yij.
(4) Determine the positive and negative ideal solutions of the matrix Z, respectively, as Z+ ={z1+, z2+,..., z33+}, Z- = {z1-, z2-,..., z33- }, zj+=maxj Zij, and zj- =minj Zij.
(5) Calculate the Euclidean distance between each sample solution and the positive and negative ideal solutions, d+ and d-, respectively.
(6) Calculate the gray correlation coefficient matrices A+ = {aij+ }m×n and A- = {aij- }m×n for each sample scenario with positive and negative ideal solutions, respectively.
(7) Calculate the gray correlation degree between each sample solution to the positive and negative ideal solutions, r+ and r-, respectively, based on the obtained gray correlation coefficient matrix.
(8) Calculate the relative closeness Si of each sample scenario based on the Euclidean distance and gray correlation degree.
The calculated result Si was used to indicate the relative closeness between the sample solution and the optimal solution, with a larger Si indicating a better sample and vice versa. The Si values were divided into low, medium and high levels according to the standard in Table 2.
Table 2 The dividing standards of Si
Grade Low Medium High
Range of values [0, 0.33) [0.33, 0.66) [0.66, 1)

Note: Si denotes the relative closeness.

3.4 Obstruction degree model

This study used the obstruction degree model to analyze the obstacles that hinder the improvement of resilience of the TSES in Hainan Province. The calculation formulas are as follows:
${{A}_{ij}}=\frac{\left( 1-{{Y}_{ij}} \right)\times {{w}_{j}}}{\underset{i=1}{\overset{n}{\mathop{\mathop{\sum }^{}}}}\,\left( 1-{{Y}_{ij}} \right)\times {{w}_{j}}}\times 100\%$
${{A}_{i}}=\underset{j=a}{\overset{b}{\mathop{\mathop{\sum }^{}}}}\,{{A}_{ij}}$
${{A}_{j}}=\frac{\underset{i=1}{\overset{n}{\mathop{\mathop{\sum }^{}}}}\,{{A}_{ij}}}{m}$
where Aij denotes the obstruction value of the j-th indicator in the i-th year; Yij denotes the standard value; wj denotes the weight of indicator; Ai denotes the obstruction value of the subsystem in the i-th year; a denotes the start indicator number of the subsystem level; b denotes the end indicator number of the subsystem level; m denotes the number of years; and Aj denotes the average obstruction degree of the j-th indicator over m years.

4 Results and analysis

4.1 Evolution of resilience of the TSES in Hainan Province

Based on the grey correlation degree and TOPSIS comprehensive analysis model, the resilience, vulnerability and coping ability index of the TSES of Hainan Province from 2010 to 2020 were measured.

4.1.1 Evolution of social subsystem resilience

The resilience index of the social subsystem during 2010-2020 increased from 0.245 in 2010 to 0.759 in 2020, and the level rose from low to high. The evolution of resilience shows an overall upward trend, rising steadily from 2010 to 2017, and then increasing significantly from 2018 to 2020 (Fig. 1).
Fig. 1 Evolution of social subsystem resilience in Hainan Province from 2010 to 2020
The support of national policies and the continuous improvement of the social subsystem jointly promoted the steady rise in the resilience of the social subsystem in Hainan Province. Since the Hainan International Tourism Island Strategy was put forward in 2010, the tourism industry in Hainan Province has developed rapidly. On the one hand, the tourism development has provided many local employment opportunities and positions. More and more people are engaged in tourism and related industries, the registered urban unemployment rate has dropped from 3% to 2.3%, and social stability has improved. At the same time, the influx of many tourists has intensified the local social pressure, and the vulnerability has increased, but the extent of that increase is small. On the other hand, the tourism development has also promoted the improvement of infrastructure and tourism service facilities in Hainan Province. The number of tourist hotels and public toilets in Hainan Province doubled from 2010 to 2017. Tourism reception capacity has greatly improved. Secondly, the mileage of highways open to traffic and the average transport distance of civil aviation passengers in Hainan Province have gradually increased, and the external and internal accessibility have steadily improved. These factors together contributed to the steady improvement in the resilience of the social subsystem in Hainan Province during 2010-2017. Since 2018, The State Council proposed the construction of Hainan Free Trade Port and clarified the strategic positioning of Hainan as an International Tourism Consumption Center, the continuous benefits of duty-free shopping tourism and other policies have greatly promoted the rapid development of tourism in Hainan Province, and the elasticity of the social subsystem has significantly improved from 2018 to 2020. It should be noted that the tourism industry bore the brunt of the COVID-19 epidemic in 2020, and the vulnerability of social subsystems increased significantly. At the same time, the tourism and catering industry has been hit and the number of tourist hotels declined from 953 in 2019 to 860 in 2020, so the coping capacity of the social subsystem has declined. As a result, the resilience of the social subsystem decreased.

4.1.2 Evolution of economic subsystem resilience

The resilience index of the economic subsystem during 2010-2020 increased from 0.467 in 2010 to 0.589 in 2020, and has been consistently in the medium stage. The evolution of resilience shows a trend of “upward then downward”, with fluctuations rising from 2010 to 2015, and then basically stable with a slight decline from 2016 to 2020 (Fig. 2).
Fig. 2 Evolution of economic subsystem resilience in Hainan Province from 2010 to 2020
Tourism is important for realizing the island economy. The development of tourism and related industries has promoted an improvement in the resilience of the economic subsystem. Under the guidance of national policies, Hainan is firmly moving in the direction of building Hainan International Tourism Island (2010-2017) and Hainan Free Trade Port (2018), and its comprehensive economic strength is constantly improving, with an average annual growth rate of per capita GDP reaching 13.6% from 2010 to 2020. Therefore, the coping capacity of the economic subsystem continues to increase. From 2015 to 2020, the proportion of tertiary industry in GDP in Hainan Province continued to rise, reaching 60.4% in 2020, and the proportion of tertiary industry employment increased from 48.55% in 2014 to 56.95% in 2020. The economic industry of Hainan Province is increasingly dependent on the tertiary industry, with tourism as the core. As a result, the vulnerability of the economic subsystem increased during 2015-2018. Since The State Council proposed the construction of Hainan Free Trade Port in 2018, many enterprises have flooded in during the wave of its construction, the industrial structure has become diversified, the pulling coefficient of tourism income has gradually decreased, and the vulnerability of the economic subsystem has decreased. However, since the outbreak of the COVID-19 epidemic in 2020, the tourism industry has been hit hard, the real economy has faced major challenges, and the vulnerability of the economic subsystem has increased. When the coping capacity of a system is basically stable, the evolution of resilience is the opposite of the vulnerability, that is, when the vulnerability rises, the resilience decreases. Therefore, the evolution of resilience in the economic system in Hainan Province shows a trend of “upward then downward” from 2010 to 2020.

4.1.3 Evolution of ecological subsystem resilience

The resilience index of the ecological subsystem during 2010-2020 decreased from 0.564 in 2010 to 0.457 in 2020, and always remained in the medium stage. The evolution of resilience generally showed a “downward-upward-downward-upward” fluctuating trend (Fig. 3).
Fig. 3 Evolution of ecological subsystem resilience in Hainan Province from 2010 to 2020
Hainan Province is the only tropical oceanic island in China, which is surrounded by the sea, far from the mainland, with a small land area, a simple regional structure, few biological species, poor system stability, limited environmental carrying capacity and other similar characteristics, so its ecological vulnerability is high. However, due to the relatively low level of tourism development in Hainan Province up until 2010, the resilience of the ecological subsystem was higher in the early stage. Since 2010, when The State Council proposed to build Hainan as an international tourism island, local tourism has developed rapidly, with a large influx of tourists and growth of the tourist population. The annual tourist arrivals rose from 25.8735 million in 2010 to 64.5508 million in 2020, an increase of 249.49%. On the whole, the large influx of tourists has gradually increased the density of the tourism space in Hainan Province, which has brought great pressure to the local ecological environment. In addition, the development of tourism tends to drive a large amount of social and economic activity, which inevitably affects the local ecological environment. Therefore, the resilience of the ecological subsystem in Hainan Island gradually decreased during 2010-2014. Maintaining a good ecological environment is the premise of ecotourism, and tourism development also encourages the local government to accelerate the construction of a good ecological environment. During the 12th Five-Year Plan period, Hainan has made great achievements in ecological civilization construction, with the forest coverage rate increasing from 51.98% in 2012 to 62.1% in 2016. Since then, the forest coverage rate has remained stable, the vulnerability of the ecological subsystem has generally decreased, and the resilience of the ecological subsystem has improved in 2015. Since 2016, with the awakening of environmental awareness and the implementation of relevant environmental protection policies, the proportion of environmental protection expenditure in the general public budget expenditure of Hainan Province has increased significantly, the treatment technology of urban domestic sewage and the pollution-free treatment technology of domestic waste have been continuously optimized, and the resilience of the ecological subsystem has shown an upward trend, but it still remained at a medium level in 2020.

4.1.4 Evolution of TSES resilience

The improvement of TSES resilience in Hainan Province from 2010 to 2020 was the result of the interaction and mutual influences of the three subsystems of ecology, economy and society through two aspects of vulnerability and coping ability. Its evolutionary characteristics show the following features.
(1) It steadily increased. The resilience index of TSES in Hainan Province has steadily increased from 0.369 in 2010 to 0.652 in 2020, but it has remained at a medium level, and the total resilience showed a stable increasing trend (Fig. 4).
Fig. 4 Evolution of TSES resilience in Hainan Province from 2010 to 2020
(2) The three subsystems work together to control the evolution of TSES resilience, and the evolutionary trends of the social and economic subsystem resilience are consistent with that of TSES. From 2010 to 2015, the resilience of the social subsystem increased slowly and steadily, and the resilience of the economic subsystem also increased. The resilience of the ecological subsystem decreased slowly from 2010 to 2014, and increased significantly in 2015. The three sub-systems influence each other, resulting in a slow rise in the resilience of the TSES in Hainan Province from 2010 to 2015. From 2016 to 2020, the resilience of the social subsystem increased steadily and then it decreased in 2020, while the resilience of the economic subsystem decreased slowly, and the resilience of the ecological subsystem increased slowly. Ultimately, the total resilience of the TSES increased steadily, but was still at a medium level.
(3) Vulnerability and coping capacity serve as checks and balances for each other in their control of the evolutionary trend of resilience. The evolutionary trends of resilience and coping capacity are consistent; and in contrast to the trend of vulnerability, they work together to control the evolutionary trend of resilience. During 2010 to 2015, the vulnerability index was highest. The high vulnerability limited the improvement of the resilience index, but the improvement of the coping capacity index weakened the limiting effect of the vulnerability index, thus the resilience index still increased. The coping capacity index rapidly increased from 2016 and 2020 to become the largest. The vulnerability index decreased in 2016 after a certain amount of upward trend, but the increase was not large, thus the resilience index was still able to rise.

4.2 Obstacles to the resilience of TSES

In order to explore the factors influencing the resilience of TSES in Hainan Province, it is necessary to analyze the degree to which related factors act as obstacles to the improvement of TSES.

4.2.1 Degree of obstruction in the subsystems

The degree of obstruction for each subsystem can be estimated using formulas (1) and (2). The degree for the social subsystem climbed from 2010 to 2020, then declined; while that of the economic subsystem increased, then decreased; and that of the ecological subsystem steadily increased (Fig. 5). This study divided the progression of the degree of obstruction of TSES resilience into two stages between 2010 and 2020. The first phase ran from 2010 to 2018, beginning in December 2009 when the State Council suggested building the Hainan International Tourism Island, and ending in 2018 when it suggested building the Hainan Free Trade Port, which would serve as a hub for global tourism consumption in 2019 through 2020 as the second phase. In the first stage, the social subsystem was a greater obstacle than the other two subsystems and occupied the main position. In the second stage, the ecological subsystem improved and became the dominant obstacle.
Fig. 5 Evolution of the degrees of obstruction among the subsystems in Hainan Province from 2010 to 2020
From the subsystem perspective, the main obstacle to resilience enhancement in the first stage originated from the social subsystem. Since the State Council proposed the construction and implementation of Hainan International Tourism Island in 2010, the economic prosperity of Hainan Province has continued to reduce the degree of obstruction from the economic subsystem. The growth in tourists also caused the spatial density of local tourism to climb quickly, from 735 people km-2 in 2010 to 2167 people km-2 in 2018. Additionally, the pressure on the environment clearly grew, as did the impacts on ecological subsystems. However, the urbanization rate of Hainan Province in this stage was below 40%, which was much lower than other cities in China, indicating a low level of social modernization in Hainan Province; and the external accessibility was low due to the geographical location and the level of transportation facilities. These factors greatly limited the local tourism development, making the degree of obstruction of the social subsystem in Hainan Province dominant in this stage.
In the second stage from 2019 to 2020, the policy of the Hainan Free Trade Port was gradually implemented, and the transformation and upgrading of the industrial structure of Hainan Province tended to diversify. The pull coefficient index of tourism revenue decreased, and the ratio of the tertiary sector in GDP increased, which means the pull of tourism on other industries had diminished. Also, the domestic economy was hit by the outbreak of the COVID-19 in 2020, particularly in Hainan Province where tourism is the main industry; thus the degree of obstruction of the economic subsystem decreased. With the development of the economy, local social welfare and social reception capacity have been basically stabilized, and the degree of obstruction of the social subsystem has gradually decreased in relative terms. However, with the increase in popularity, the tourism industry in Hainan continues to develop rapidly, and the continuous increase in the tourist population increased the pressure on the ecological environment, so the degree of obstruction of the ecological subsystem gradually came to occupy the main position.

4.2.2 Degrees of obstruction by individual factors

Equations (1) and (3) can be used to calculate and order the average degree of obstruction for each factor over the period of 11 years (Table 3). The top 11 obstacles were chosen after the factors were ordered according to the average obstruction degree. The 11 factors are: C2 natural population growth rate, C13 total postal and telecommunications operations, C27 annual typhoon registrations, C18 ratio of the tertiary sector to GDP, C10 public restrooms, C33 per capita urban green space, C22 financial self-sufficiency rate, C11 urbanization rate, C6 expenditure on culture, education, health, and science as a percentage of local general public budget expenditure, C14 average distance of civil passenger transportation, C8 balance of deposits in domestic and foreign currencies of financial institutions; and the cumulative degree of obstruction from these 11 factors is 0.529>0.5, which is representative (Ma et al., 2020). These 11 factors include seven factors in the social subsystem, two factors in the economic subsystem, and two factors in the ecological subsystem.
Table 3 The degree of obstruction from factors from 2010 to 2020
Factor 2010 2011 2012 2013 2014 2015 2016 2017 2018 2019 2020 Average obstruction degree Aj Cumulative obstruction degree
C2 0.075 0.076 0.076 0.076 0.077 0.078 0.078 0.079 0.079 0.082 0.085 0.078 0.078
C13 0.075 0.075 0.075 0.075 0.075 0.075 0.076 0.074 0.068 0.062 0.057 0.072 0.150
C27 0.062 0.057 0.063 0.060 0.061 0.064 0.059 0.059 0.063 0.061 0.061 0.061 0.211
C18 0.054 0.054 0.054 0.054 0.054 0.055 0.055 0.055 0.056 0.056 0.056 0.055 0.266
C10 0.044 0.045 0.044 0.044 0.045 0.045 0.044 0.044 0.043 0.043 0.041 0.044 0.309
C33 0.044 0.044 0.044 0.044 0.044 0.044 0.043 0.044 0.044 0.043 0.043 0.044 0.353
C22 0.043 0.043 0.043 0.043 0.044 0.041 0.042 0.042 0.042 0.043 0.043 0.043 0.396
C11 0.038 0.038 0.038 0.039 0.039 0.039 0.039 0.039 0.040 0.040 0.040 0.039 0.435
C6 0.032 0.032 0.032 0.032 0.033 0.033 0.033 0.034 0.034 0.034 0.034 0.033 0.468
C14 0.032 0.032 0.032 0.031 0.031 0.031 0.031 0.031 0.031 0.031 0.031 0.031 0.499
C8 0.031 0.031 0.030 0.030 0.030 0.029 0.029 0.029 0.030 0.030 0.030 0.030 0.529
Among the three subsystems, the factors in the social subsystem appear most frequently. The social subsystem is the inherent support of TSES in Hainan Province. Hainan Province should reduce its vulnerability and improve its coping capacity based on the current conditions and evolutionary trend of the resilience. Social expenditure should be increased to enhance the Coping capacity of the social subsystem; and strengthening the construction of urban infrastructure, accelerating the modernization process, and improving the social public utilities will improve the tourism reception capacity. In the economic subsystem, the average degrees of obstruction for “ratio of tertiary sector in GDP” and “financial self-sufficiency rate” were highest, and the over-dependence on the tourism industry is the main obstacle of the economic subsystem in Hainan Province. In the ecological subsystem, the average degrees of obstruction for “number of typhoons registered annually” and “area of park green space per capita” were the highest, and the main direction for reducing the degree of obstruction of the ecological subsystem is strengthening the capacity of environmental conservation. In the future, the local authorities should focus on accelerating the Industrial transformation and upgrading, and improving the urban environmental conservation capacity, in order to improve the coping capacity of Hainan Province.

5 Discussion

As a typical island-type tourism destination in China, studying the resilience of TSES in Hainan Province is of great importance. In this study, the resilience evaluation index system of TSES in Hainan Province was constructed, and the factors influencing TSES were revealed, so the results have a certain reference significance for the sustainable development of tourism in Hainan Province. This analysis found that the three subsystems work together to control the evolution of TSES resilience, and the economic and social subsystems are consistent with the evolutionary trend of TSES resilience. Li et al. (2023) proposed that the evolutionary trends of resilience of the social and economic subsystems are consistent with the TSES when studying the spatial-temporal evolutionary characteristics of the SES in Hexi region. In his study on the evolution of SES in tourism destinations in poor mountain areas, Wang et al. (2021) proposed that the human-land relationship, tourism development and ecological environment are the main limiting factors. Secondly, this study found that vulnerability and coping ability act as checks and balances for each other in order to control the evolutionary direction of TSES resilience. When studying the resilience of TSES in typical urban areas, He et al. (2022) pointed out that the improvement of coping capacity will drive the improvement of resilience, while the slow exacerbation of vulnerability will slow down the improvement of resilience, and the resilience curve will always lie between coping capacity and vulnerability. This finding is consistent with the conclusions of this study. This study examined the evolution of TSES resilience in Hainan Province from the perspective of time, but it can also be considered from the spatial dimension in the future. Secondly, due to the availability of data, this study only measured the evolution of resilience in a short span of time, from 2010 to 2020, and studies with longer time-frames can be conducted in the future.

6 Conclusions

The resilience of TSES in Hainan Province was in a stable rising trend from 2010 to 2020, increasing from 0.369 in 2010 to 0.652 in 2020, but it is still in a medium developmental stage. The development of resilience was consistent with the evolution of the resilience of the economic and social subsystems. Since the construction of Hainan as an International Tourism Island in 2010, tourism development has driven the healthy development of the local economy and the coordinated evolution of the society, thus promoting a steady increase in the resilience of TSES.
Vulnerability and coping capacity act as checks and balances for each other, and together they control the evolutionary trend of resilience. On the one hand, a sluggish rise in vulnerability prevents the resilience from rising; while a sharp rise in coping ability removes this restriction and finally permits the resilience index to rise. Tourism is the pillar industry of Hainan Province, which has not only boosted regional economic growth but also attracted a sizable tourist population, increasing the pressure on local ecological systems and making them more vulnerable. Tourism has also encouraged Hainan Province to invest more in social infrastructure, environmental protection, and other measures, which provides the conditions and attractiveness for Hainan Province to achieve a larger scale of tourists, and improves the local coping capacity.
Among the degrees of obstruction of the three subsystems, the social subsystem occupied the main position relative to the other two subsystems in 2010-2018, but the ecological subsystem occupied the main position in 2019-2020. In terms of individual factors, the main factors are as follows: natural population growth rate, total postal and telecommunications operations, number of typhoons registered annually, ratio of tertiary sector in GDP, number of public toilets, urban green space per capita, financial self-sufficiency rate, urbanization rate, expenditure on culture, education, health and science as a proportion of local general public budget expenditure, average distance of civil passenger transportation, and the balance of deposits in domestic and foreign currencies of financial institutions. Among them, the factors belonging to the social subsystem appeared most frequently. In the future of tourism development, the main way to improve resilience is to take measures against these obstacles.
[1]
Bu F, He J, Li H, et al. 2020. Correction: Interval-valued intuitionistic fuzzy MADM method based on TOPSIS and grey correlation analysis. Mathematical Biosciences and Engineering, 17(6): 6699-6701.

DOI PMID

[2]
Chen Y L, Yang X J. 2011. Tourism social-ecological systems and resilience research. Journal of Arid Land Resources and Environment, 25(11): 205-211. (in Chinese)

[3]
Chen Y L, Yang X J. 2012. The resilience of Tibet tourism social-ecological systems. Journal of Northwest University (Natural Science Edition), 42(5): 827-832. (in chinese)

[4]
Chu L, Oloo F, Chen B, et al. 2020. Assessing the influence of tourism-driven activities on environmental variables on Hainan Island, China. Remote Sensing, 12(17): 2813. DOI: 10.3390/rs12172813.

[5]
Cumming G, Barnes G, Perz S, et al. 2005. An exploratory framework for the empirical measurement of resilience. Ecosystems, 8(8): 975-987.

DOI

[6]
Espeso P, Pastor M. 2020. Governance, community resilience, and indigenous tourism in Nahá, Mexico. Sustainability, 12(15): 5973. DOI: 10.3390/su12155973.

[7]
Folke C. 2006. Resilience: The emergence of a perspective for social-ecological systems analyses. Global Environmental Change, 16(3): 253-267.

DOI

[8]
Folke C, Carpenter S, Walker B, et al. 2010. Resilience thinking: Integrating resilience, adaptability and transformability. Ecology and Society, 15(4): 20-28.

[9]
He X R, Liu Y, Yin J J. 2022. Resilience of social-ecological system of typical tourist cities: A case study of Zhangjiajie City, Hunan Province. Bulletin of Soil and Water Conversation, 42(1): 259-266. (in Chinese)

[10]
Holling C. 1973. Resilience and stability of ecological systems. Annual Review of Ecology and Systematics, 4: 1-23.

DOI

[11]
Li G F, Jiao H F, Wang Q. 2022a. Interannual variation and influencing factors of social-ecological system resilience of cultural tourism destination in arid area: A case of Dunhuang City, Gansu Province. Arid Land Geography, 45(3): 935-945. (in Chinese)

[12]
Li M C, Wang C X, Guo M Y, et al. 2021. Research on the evaluation and influencing factors of the coupling and coordination of the island tourism development and ecological environment in China. World Regional Studies, 30(5): 1048-1060. (in Chinese)

[13]
Li X H, Zhang X B, Yao L T, et al. 2023. Spatial-temporal evolution characteristics of social-ecological system resilience in Hexi Region. Journal of Arid Land Resources and Environment, 37(7): 38-47.

[14]
Li X M, Xiao R B, Wang H L, et al. 2014. Resilience concept analysis and evaluation of socio-ecological systems: An overview. Journal of Ecology and Rural Environment, 30(6): 681-687. (in Chinese)

[15]
Li Y, Guo J, Huang J C, et al. 2022b. Research on the influence of the spatial form of island-type tourism destination on tourists behavior: The case of five tourist islands in Fujian. Tourism Tribune, 37(6): 27-42. (in Chinese)

[16]
Liu D H, Gong W, Xing W X, et al. 2015. Comprehensive method for determining the weights of vulnerability assessment indexes on islands and coastal zone based on the AHP weight method and entropy weight method. Marine Environmental Science, 34(3): 462-467. (in Chinese)

[17]
Ma Y X, Zhang Z B, Da X J, et al. 2020. Ecological evaluation and obstacle factor analysis of urban green space Jiayuguan from 2007 to 2016. Journal of Earth Environment, 11(3): 292-301. (in Chinese)

[18]
Mike S, Geoffrey W. 2004. Ecotourism and community development: Case studies from Hainan, China. Environmental Management, 33(1): 12-24.

PMID

[19]
Qin H. 2020. Development of Hainan Marine Travel Tourism Sphere Model: A global perspective. Journal of Coastal Research, 106(s1): 93-96.

DOI

[20]
Shen S Y. 2014. Investigating tourism management based on estimating resilience of tourism social-ecological system: A case of Suzhou. Ecological Economy, 30(5): 141-145. (in Chinese)

[21]
Wang H, Xu Y X, Lu S Q, et al. 2017. A comparative study of Chinese translation of resilience terminology in socio-ecological system and its related research fields. Urban Planning International, 32(4): 29-39. (in Chinese)

DOI

[22]
Wang J Y, Liu Y S. 2013. Tourism-led land-use changes and their environmental effects in the southern coastal region of Hainan Island, China. Journal of Coastal Research, 29(5): 1118-1125.

[23]
Wang Q, Lu L, Yang X Z. 2015. Study on measurement and impact mechanism of socio-ecological system resilience in Qiandao Lake. Acta Geographica Sinica, 70(5): 779-795. (in Chinese)

DOI

[24]
Wang Q, Lu L, Yang X Z. 2016. Comparative analysis of the resilience of the socio-ecological subsystems of tourist destination: A case study of Chunan County. Tourism Tribune, 31(2): 116-126. (in Chinese)

[25]
Wang Q, Yang W M, Zhu Y, et al. 2021. Spatio-temporal differentiation of tourism socio-ecological system resilience in poor area: A case study of 12 poverty-stricken counties in the Dabie Mountain of Anhui Province. Scientia Geographica Sinica, 41(6): 1030-1038. (in Chinese)

DOI

[26]
Wang X C, Li J F, Zhang Z. 2018. Evolvement and spatial heterogeneity of core trajectory of tourists in Hainan province. World Regional Studies, 27(4): 156-166. (in Chinese)

[27]
Wu C Y, Guo L L, Yu J T. 2017. Evaluation model and empirical study of regional green growth system based on TOPSIS and Grey relational analysis. Management Review, 29(1): 228-239. (in Chinese)

[28]
Wu X P, Li J Y. 2012. Relationship between growth of tourism industry and inflation: Evidence from Hainan Island. Tourism Tribune, 27(11): 66-71. (in Chinese)

[29]
Yang L. 2006. The influence of tourism on the economic development of Dali Prefecture. Journal of Yunnan Minzu University (Philosophy and Social Sciences Edition), (2): 93-95. (in Chinese)

[30]
Yin P, Liu S G, Duan P L. 2017. Analysis on the vulnerability and obstacle indicators in island-type tourism destination: Take Zhoushan City for example. Economic Geography, 37(10): 234-240. (in Chinese)

[31]
You C J, He X, Chen H Y, et al. 2021. Measuring tourism environmental carrying capacity index values for China’s tropical islands using global comparisons. Tourism Tribune, 36(1): 135-145. (in Chinese)

[32]
Yu Z Y. 2019. Study on island social ecological system and sustainable development: Taking Hainan Island as an example. Journal of Hainan Normal University (Natural Science), 32(3): 340-348. (in Chinese)

[33]
Zhan Y R, Gai M. 2018. Study on measurement and coordinate development of social-ecological system resilience in costal tourism destination. Areal Research and Development, 45(3): 935-945. (in Chinese)

[34]
Zhang T, Zhou B P, Liao H P, et al. 2022. Study on the measurement and improvement path of resilience of rural social ecosystems in Chongqing. Journal of Southwest University (Natural Science Edition), 44(11): 2-12. (in Chinese)

[35]
Zhang Y, Zhang X, Gong Y J, et al. 2019. Preliminary study on impact mechanism and assessment theory system of island ecosystem vulnerability: The cases study of islands in Liaoning Province. Journal of Marine Sciences, 37(4): 68-78. (in Chinese)

DOI

[36]
Zhao N, Wang H, Wang L, et al. 2021. The vulnerability of the tourism-type island social-ecological system (SES) and its influence mechanism: A case of Changhai County. Journal of Chinese Ecotourism, 11(4): 567-584. (in Chinese)

Outlines

/