Ecosystem and Ecosystem Services

Ecological Sensitivity Evaluation and Spatial Pattern Analysis of Minjiang Estuary National Wetland Park based on GIS

  • TANG Yuping , 1 ,
  • SHU Mengrong , 2, * ,
  • WU Yuanjing 3 ,
  • XUAN Yang 4
Expand
  • 1. School of Urban Construction, Fuzhou Technology and Business University, Fuzhou 350007, China
  • 2. College of Art and Design, Fuzhou University of International Studies and Trade, Fuzhou 350000, China
  • 3. College of Landscape Architecture and Art, Fujian Agriculture and Forestry University, Fuzhou 350000, China
  • 4. Guangzhou Bosha Architectural Design Institute Co. Ltd., Fuzhou 350000, China
*SHU Mengrong, E-mail:

Received date: 2023-04-27

  Accepted date: 2023-07-25

  Online published: 2023-12-27

Supported by

The Fujian Social Science Planning Fund Program(FJ2021C103)

Abstract

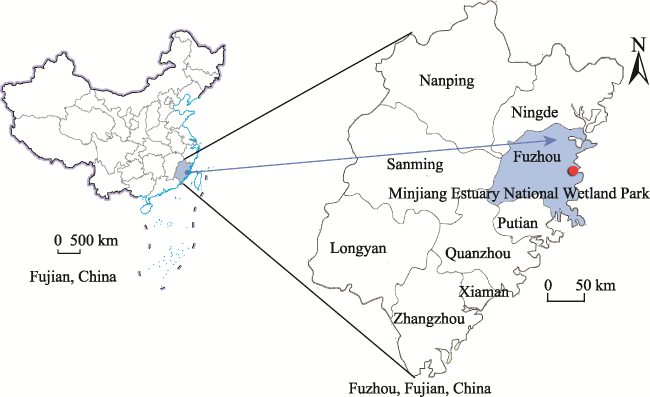
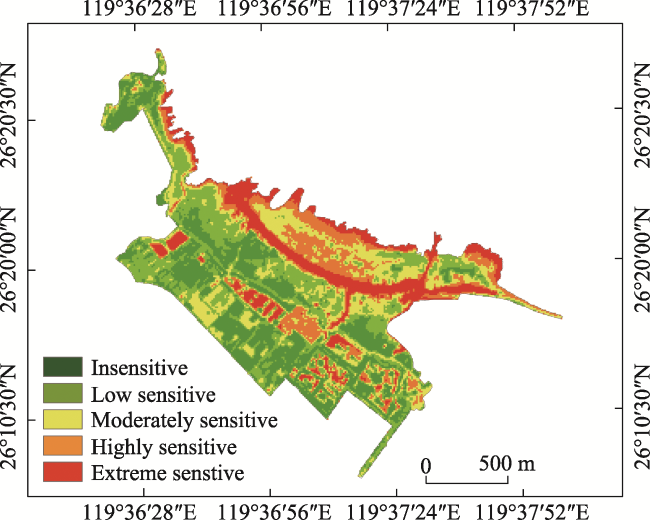
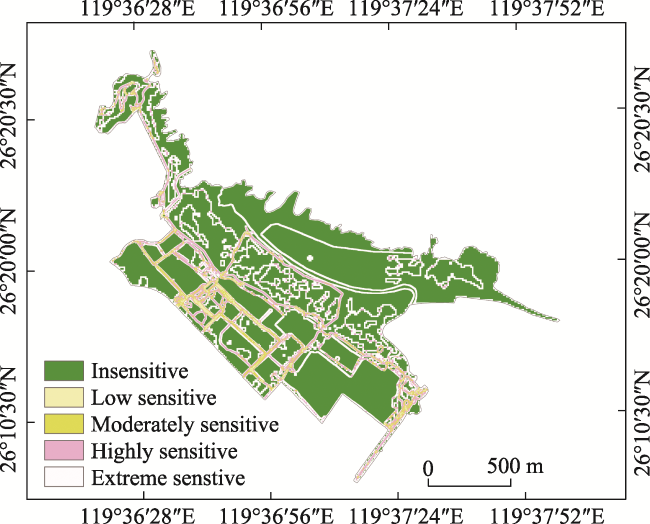
Wetlands are one of the most complex ecosystem types on the planet, and ecological sensitivity assessment is an important foundation for the scientific planning of wetland park systems. The Minjiang River estuary, located in the coastal city of Fuzhou, has outstanding regional characteristics in terms of its ecosystem and biodiversity. The nearby waters are among the richest in marine species in the world and the richest in offshore marine species at that latitude in the northern hemisphere. It has at least four indicators meeting the criteria for internationally important wetlands. In this study, the analytic hierarchy process (AHP) was used to determine the weights of factors, and the comprehensive ecological sensitivity of Minjiang Estuary National Wetland Park was evaluated using the weighted-overlap method by the Remote Sensing (RS) and Geographic Information System (GIS). An ecological sensitivity evaluation index system for wetland parks was constructed using Delphi, and then an ecological sensitivity assessment of Minjiang Estuary National Wetland Park was built. The sensitivities of different areas in the Minjiang Estuary National Wetland Park were divided five ecological sensitivity levels: extremely sensitive, highly sensitive, moderately sensitive, minimally sensitive, and insensitive. The results show that the riverbanks, beaches, canals, ponds, and surrounding areas were in the range of highly and moderately sensitive areas, while insensitive and minimally sensitive areas were distributed in the artificial landscape environments such as woodlands, farmland, and parks.

Cite this article

TANG Yuping , SHU Mengrong , WU Yuanjing , XUAN Yang . Ecological Sensitivity Evaluation and Spatial Pattern Analysis of Minjiang Estuary National Wetland Park based on GIS[J]. Journal of Resources and Ecology, 2024 , 15(1) : 33 -43 . DOI: 10.5814/j.issn.1674-764x.2024.01.003

1 Introduction

Ecological sensitivity refers to the degree of sensitivity of an ecosystem to human interference and environmental changes, specifically, the type, difficulty, and probability of ecological environmental problems that would occur in a region (Ratcliffe, 1997; Naujokaitis-Lewis et al., 2009). The essence of ecological sensitivity assessment is to clearly identify and mitigate potential ecological problems in the current natural environment background (Wu et al., 2011). Under natural conditions, the ecosystem is relatively stable, as are the coupling relationships between ecological processes. When external interference exceeds a certain threshold, however, some ecological processes will over-expand, causing serious ecological and environmental problems (e.g., soil erosion, land desertification, soil salinization, and others) and destroying the relatively stable coupling relationship between ecological processes and the stability of the ecosystem. In order to comprehensively assess the condition of a regional eco-environment, and consequently identify the priority areas for conservation of the ecological environment, ecological sensitivity evaluations need to be conducted. Ecological sensitivity represents the responses of an ecosystem to environment changes caused by both external factors and internal factors (Christer and Grelsson, 1995; Zhang et al., 2007; Rossi et al., 2008; Zhang et al., 2010). Foreign scholars mostly use model building and superposition analysis to study the ecological sensitivity of a specific area, and this approach has some experience and serves as a guideline for ecological sensitivity research in China. With China’s emphasis on the environment, research on ecological environmental sensitivity assessment is gradually increasing. There have been related studies in scenic areas (Wu, 2016; Yue et al., 2022), forest parks (Peng et al., 2021), wetlands (Qin, 2020; Lu et al., 2022), urban spaces (Ma and Wang, 2021), and rural spaces (Liu et al., 2018).
To determine the relevant factors and construct the model for superposition analysis, ArcGIS, AHP, Delphi, and other methods must be used, and these methods are limited to GIS and AHP (Herlin, 2016). ArcGIS is mainly used for geographic data analysis, assigning values to individual evaluation factors, and constructing an indicator system for the ecological sensitivity evaluation through GIS. Using Analytic Hierarchy Process (AHP), a wetland ecological evaluation system can be constructed through three criteria layers and eight indicator layers to study the most important factors affecting wetland ecology. The Delphi expert method selects evaluation factors from three dimensions: terrain, natural resources, and landscape conditions. Because there has been little research on estuary wetland parks in coastal cities, this study used the Minjiang Estuary National Wetland Park at Changle Estuary as the research object, and the results can provide scientific and systematic guidance for the protection and development of wetland park types in coastal areas in the future.
Although wetlands only account for about 6% of the Earth’s land surface area, 40% of plant and animal species live or reproduce in wetlands. Wetlands also play a crucial role in human society, other ecosystems, and the climate, providing basic ecosystem services such as water regulation, including flood control and water purification. More than 1 billion people worldwide rely on wetlands for their livelihoods. Wetlands are distinctive, complex ecohydrological systems that occur within a wide range of climatic and topographic environments. They constitute one of the world’s most productive and important natural resources (Thamaga et al., 2022). Wetlands are valuable for numerous ecological and social reasons, such as greenhouse gas sequestration, commercial fishing, flood control, pollution mitigation, and recreation (Sierszen et al., 2012). Wetland conservation alternatives have been described in terms of environmental protection zones, biodiversity protection, recreational services and flooding infrastructure (Hassan, 2019). Wetland parks are known as the “kidney of the city”. They are ecosystems with various functions such as flood storage and drought prevention, climate regulation, promoting silt and land creation, and the degradation of environmental pollutants (Lu et al., 2012). Because of their beautiful scenery and wild interest, wetlands have become the primary venues for urban and rural residents to engage in recreation, health, and fitness activities (Christopoulou and Tsachalidis, 2004). They are also an important component of the urban wetland system, which plays an important role in the urban ecosystem and serves as a practical base for wetland protection, popularization and education of wetland knowledge, and the prevention and control of urban pollution. Most importantly, they are critical hotspots for biodiversity conservation (James, 2000). Therefore, in this study, the ecological sensitivity evaluation and spatial pattern research of Minjiang Estuary National Wetland Park were conducted, and the scientific development and utilization were carried out based on the evaluation results, in order to achieve the reasonable symbiosis between protection and development.
Minjiang Estuary National Wetland Park is one of Fujian Province’s most important coastal wetland reserves. It is located at the Minjiang River’s estuary in Changle District, Fuzhou, and plays an important and significant role in the Minjiang River’s overall ecological environment. Evaluating landscape ecological sensitivity in estuarine areas is important for providing a reference for landscape optimization and ecological conservation. However, the comprehensive characteristics of the landscape ecological sensitivity, including the changes under various disturbances, the spatiotemporal heterogeneities, and the multiple scale effects, have received insufficient attention thus far (Chi et al., 2019). An estuary is the part of a river system where the river flows into the sea, and estuarine areas are special due to their unique natural conditions and the associated complex human activities (Huang et al., 2008). Using GIS, RS, the Delphi expert evaluation method, and analytic hierarchy process (AHP), the ecological sensitivity evaluation system of Minjiang Estuary Wetland Park was constructed in this study, and the comprehensive grading of ecological sensitivity evaluation in the area was conducted. Local- to regional-scale studies have demonstrated that the conservation or restoration of coastal wetland ecosystems, such as salt marshes and mangroves, provides nature-based risk mitigation, as these wetlands have the natural capacity to mitigate the impacts of storm surges and related flood risks (Coppenolle and Temmerman, 2020).

2 Overview of the research area

The Fujian Min River estuary is located in Changle District, Fuzhou City, on the south side of the estuary of the Min River, spanning 13 administrative villages in three townships, with geographical coordinates of 26°01'08"- 26°03'39"N, 119°36'28"-119°41'15"E (Fig. 1). It is located at the intersection of two biogeographic provinces, the Central China Subtropical Forest and the South China Rainforest, as well as the Northwest Pacific Region and the South China Sea Region. It is the northern boundary of mangrove distribution and the southern boundary of sea trillium cassis distribution in the coastal region of mainland Asia, providing a good habitat for many water birds, fish and crustaceans. It is home to 1311 species of wildlife, including 87 species of wildlife of national importance, and the nearby waters are one of the richest in marine species in the world and the richest in offshore marine species at that latitude in the northern hemisphere. It has at least four indicators meeting the criteria for internationally important wetlands.
Fig. 1 Location of Minjiang Estuary National Wetland Park

3 Research methods and ecological sensitivity system construction

3.1 Basic data sources and processing

The basic data source used in this study is DEM 30 m resolution digital elevation data, which were sourced from the geospatial data source website, Landsat 8 remote sensing images, and the terrain map of the Minjiang River Estuary National Wetland Park. The Landsat 8 remote sensing images were obtained from the Earthexplore website on December 19, 2021, and the land use type data obtained from the global land cover data of Globeland 30 mainly came from the Globleland website. ArcGIS10.0 software was used to process the projection coordinate shapefile data generated from the corrected original data, as well as the terrain data obtained from DEM data. The vegetation normalization (NDVI) was obtained through an analysis using ENVI and RS data, and relevant data were obtained. Finally, using the spatial analysis function in GIS, the individual evaluation factors were evaluated, and the single factor analysis chart and the index system of ecological sensitivity evaluation were obtained based on the characteristics of the Minjiang Estuary National Wetland Park. Then, by superimposing each factor, the comprehensive ecological sensitivity analysis chart of Minjiang Estuary National Wetland Park was obtained.
Based on the original data and remote sensing images, distribution characteristics and land types, the land types were classified and calculated in the study area, and finally the information table of land use types in Minjiang Estuary National Wetland Park was generated by GIS (Table 1).
Table 1 Land use types in Minjiang Estuary National Wetland Park
Land use factor type Patch quantity Area (m²) Ratio (%)
Wetland 16 473622 23.50
Woodland 124 106425 5.28
Farmland 272 598710 29.71
Irrigation grassland 50 56952 2.83
Roads 32 53990 2.68
Build 46 15338 0.76
Others 410 710244 35.24

3.2 Construction of the ecological sensitivity evaluation index system

3.2.1 Selection of index evaluation factors

To build the Minjiang Estuary National Wetland Park’s ecological sensitivity evaluation system, local ecological evaluation factors must be chosen. We can obtain scientific and reasonable evaluation results for the study area if we can successfully construct scientific and appropriate ecological factors. Multi-factor comprehensive methods are commonly used when selecting eco-environmental sensitivity indicators (Ha et al., 1998. Cassel and Petschel, 2000; He et al., 2004). The selection of ecologically sensitive factors should account for the uniqueness of the ecological environment in the research area as well as the differences with other areas, and the ecologically sensitive factors chosen should be representative (Tian, 2020). As a result, this study employed the Delphi expert method to select the evaluation factors from three dimensions: topography, natural resources, and landscape conditions; and eight factor indexes with weight values greater than 0.03 were chosen based on the evaluation of ten experts in landscape architecture, urban planning, and other relevant fields.

3.2.1.1 Topography

(1) Slope: In general, the steeper the ground, the more unstable the ecosystem and the higher the ecological sensitivity value. This is because the greater the surface slope, the lower the intensity of received solar radiation, and various climatic conditions are more likely to erode the surface soil (Lu, 2007). The slope of the ground typically influences the survival, development, and construction of wetland animals and plants, the stability of geological bodies, the degree of soil development, vegetation diversity, and microclimatic conditions such as temperature, humidity, and precipitation (Wei, 2020).
(2) Aspect: The sunshine time, solar radiation intensity and rainfall received by the ground in different aspects will change, which will affect the survival of animals and plants, as well as landscape planning and development.
(3) Elevation: The greater the altitude, the less diverse the ecosystem and the greater the ecological sensitivity (Zhou et al., 2021). The elevation will affect the overall geological stability and soil development, resulting in changes in the diversity of vegetation in the ecosystem and changes in microclimate such as temperature and humidity, as well as influencing the layout planning and construction of the subsequent wetland park.

3.2.1.2 Natural resources

(1) Waters and wetlands: One of the most important components of a wetland park, and even the entire wetland system, is the water body. The water body is an important factor for protecting the ecological gene pool and improving the ecological environment in the study area, which influences the overall environmental construction planning (Wu, 2016). The creation of a buffer zone is an important method and means of protecting the water environment (Wang et al., 2019). The ecological impact and radiation range of the area surrounding the water area were analyzed in this study by establishing a buffer zone in the water area.
(2) Vegetation coverage: This is an important indicator for measuring the growth of surface vegetation. It is one of the important indicators used to describe changes in the ecosystem and the environment (Yang et al., 2021). It refers to the proportion of the vertical projection area of vegetation in the total area of the study area. The normalized vegetation index (NDVI) quantifies vegetation by measuring the difference between near infrared and red light (i.e., the absorption by vegetation). Because NDVI and the vegetation are related (Jiang et al., 2020), the NDVI index was used to calculate the relevant plant coverage.
(3) Vegetation type: Different vegetation types have varying degrees of ecological sensitivity to the environment. Plant-covered areas have a higher ecological sensitivity than planned human-development land; and water areas, wetland buffer zones, woodlands, shrubs, and grasslands have a higher ecological sensitivity than farmland.

3.2.1.3 Landscape conditions

(1) Landscape ecological value: Wetland is the most important natural space in urban landscape units, and it has significant landscape ecological value. The ecological value can be used to demonstrate the overall characteristics of wetland parks and to reveal the regional characteristics.
(2) Landscape pattern: This can reflect the comprehensive characteristics of a landscape pattern, calculate the index of patch type, quantity, density, and other parameters. It can also quantify the current state of a landscape pattern, and provide a more scientific basis for assessing the ecological sensitivity of the entire region (Liu et al., 2021).

3.2.2 Determination of index weights

Because of the complexity of the ecosystem, various ecological factors have varying impacts on the different land use types, and their effects are also variable. As a result, this study determined the evaluation factors and their weight values based on the characteristics of the Minjiang Estuary National Wetland Park, expert evaluation, and the degree of influence of different ecological factors on the land. The higher the weighted sum, the more sensitive the study area’s ecology (David, 1996). The ecological sensitivity evaluation factors were divided into five grades according to the Delphi expert evaluation method: extremely sensitive, highly sensitive, moderately sensitive, minimally sensitive, and insensitive, and the Likert scale was used to assign values of 1, 2, 3, 4, and 5, respectively, to indicate the sensitivity from low to high (Table 2).
Table 2 Single factor grading standards of ecological sensitivity of Minjiang Estuary National Wetland Park
Ecological index factor Classification levels of ecological sensitivity
Insensitive Minimally sensitive Moderately sensitive Highly sensitive Extremely sensitive
Slope (°) 0-1 1-3 3-6 6-12 12-24
Aspect Due south;
Flat slope
Southeast;
Southwest
East;
West
Northeast;
Northwest
Due north
Elevation (m) 9-14 14-19 19-26 26-36 36-48
Vegetation coverage 0-0.2 0.2-0.4 0.4-0.6 0.6-0.8 0.8-1
Land use type Bare land Irrigation grassland Farmland Woodland Waters, wetlands
Waters, wetlands Unbuffered zone 0-30 m buffer zone 30-80 m buffer zone 80-200 m buffer 200+ m buffer
Landscape ecological value A relatively stable artificial ecosystem Semi-artificial ecosystem, general biodiversity The natural ecosystem and the original habitat are damaged to some extent
Landscape pattern Average patch area Patch density Patch area Fragmentation index Number of patches
Graded assignment 1 2 3 4 5
The analytic hierarchy process (AHP) is a widely used tool in the problem of multi-criteria decision making (MCDM) (Satty, 1994). Since this method was proposed, it has been applied in many areas such as environmental science (Ramanathan, 2001; Ananda and Herath, 2009), management science (Kahraman et al., 2004; Felix and Kumar, 2007), and many others. AHP is widely used in the field of water ecology. The weight of each ecological factor in this study was mainly calculated by AHP. The first step is to fill in the judgment matrix and construct the subjective evaluation matrix (Table 3).
Table 3 Comparative matrix of ecological factors in Minjiang Estuary National Wetland Park
Ecological index factor Slope Aspect Elevation Landscape ecological value Landscape pattern Vegetation coverage Vegetation form Wetland Weight
Slope 1 1 0.3333 0.5 0.3333 0.3333 0.25 0.2 0.0419
Aspect 1 1 3 1 0.5 0.3333 0.25 0.2 0.0632
Elevation 3 0.3333 1 4 2 1 0.5 0.3333 0.104
Landscape ecological value 2 1 0.25 1 0.5 0.3333 0.25 0.2 0.0506
Landscape pattern 3 2 0.5 2 1 0.5 0.3333 0.25 0.0843
Vegetation coverage 3 3 1 3 2 1 0.5 0.3333 0.132
Vegetation form 4 4 2 4 3 2 1 0.5 0.211
Wetland 5 5 3 5 4 3 2 1 0.313
Secondly, from the output results in Table 3, we used the square root method to obtain the feature vector and check the weight of each index.
Finally, the consistency test was used to determine whether the built judgment matrix contains logical errors. If it fails, the judgment matrix must be recreated. According to the RI table, the maximum characteristic root was 8.7246, and the corresponding RI value was 1.404, so CR=CI/RI= 0.0737, which passes this one-time test. Thus, the slope, aspect, and elevation weight scores were taken as 0.0419, 0.0632, 0.104, 0.0506, 0.0843, 0.132, 0.211, and 0.313, respectively(Table 4, Table 5).
Table 4 Maximum characteristic root CI value of the characteristic vector weight value of ecological index factors
Ecological index factor Feature vector Weight Maximum characteristic root CI
Slope 0.4177 0.0419 8.7246 0.1035
Aspect 0.6306 0.0632
Elevation 1.0366 0.104
Landscape ecological value 0.504 0.0506
Landscape pattern 0.8409 0.0843
Vegetation coverage 1.3161 0.132
Vegetation form 2.104 0.211
Wetland 3.1209 0.313
Table 5 Consistency test results
Variable Maximum characteristic root CI RI CR Consistency test result
Value 8.7246 0.1035 1.404 0.0737 Pass

4 Results and analysis

4.1 Single factor ecological sensitivity analysis

4.1.1 Slope sensitivity analysis

The slope sensitivity analysis was classified into five grades based on 0-1°, 1°-3°, 3°-6°, 6°-12°, and 12°-24°, with grades ranging from insensitive to extremely sensitive. According to Fig. 2, the greater the slope of the study area, the more vulnerable its sensitivity, and the insensitive areas are primarily concentrated in the water areas and wetland buffer areas, accounting for 45.60% of the total. Minimally and moderately sensitive areas accounted for 30.48% and 18.26% of total sensitive areas, respectively. This area is relatively large, and while the slope of the study area is not steep, the staggered distribution is concentrated. Extremely sensitive and highly sensitive areas account for only a small portion of the total area, at 5.67% of the total area. These areas are primarily concentrated in the artificial environment areas in the east, such as Wenshi Yantai Dingmazu Park, the park’s rest pavilion, and the ecological bird island.
Fig. 2 Slope ecological sensitivity analysis (Minimally sensitive)

4.1.2 Elevation sensitivity analysis

When the DEM data of the study area were analyzed using ArcGIS 10.0, the elevation of the study area was found to be primarily concentrated in the range of 9-48 m, and the terrain of the entire area is relatively flat, indicating a gentle and low elevation situation. The park’s elevation was divided into five categories: 9-14 m, 14-19 m, 19-26 m, 26-36 m, and 36-48 m, and the sensitivity assignment increases with elevation. The analysis found that 94% of the park is insensitive or minimally sensitive, while extremely sensitive and highly sensitive areas cover approximately 2.2% of the area in Yantai’s Mazu Park, Wenshi in the east. The moderately sensitive area covers 3.87% of the total land area and is scattered around the farmland and ponds (Fig. 3).
Fig. 3 Elevation ecological sensitivity analysis (Minimally sensitive)

4.1.3 Sensitivity analysis of slope aspect

A difference in the slope aspect will cause a difference in the amount of light and radiation intensity in an area, and the length of the sunshine receiving time will also be different, thus affecting the growth of animals and plants in the area and the survival of species. For the northern hemisphere, the radiation income is relatively large in the south slope, southeast slope, east slope and southwest slope (Chen et al., 2015). In this study, the slopes were divided into nine directions and five grades, namely, flat slope and due south slope are insensitive areas, southwest slope and southeast slope are minimally sensitive areas, due west slope and due east slope are moderately sensitive areas, northeast slope and northwest slope are highly sensitive areas, and due north slope is extremely sensitive areas. According to the analysis of DEM data by ArcGIS 10.0, 44.31% of the area in the study area is insensitive, 13.99% is minimally sensitive, 13.55% is moderately sensitive, 19.83% is highly sensitive and only 8.33% is extremely sensitive (Fig. 4).
Fig. 4 Ecological sensitivity analysis of slope aspect (Minimally sensitive)

4.1.4 Sensitivity analysis of vegetation coverage

One of the most important factors in wetlands is vegetation, which serves a variety of ecological functions. The extent of vegetation cover is proportional to ecological stability. This study divided it into five grades based on the normalized difference vegetation index (NDVI): 0-0.2, 0.2-0.4, 0.4-0.6, 0.6-0.8, and 0.8-1. Insensitive and minimally sensitive areas account for more than 51% of the total area, moderately sensitive areas are 20.24%, and highly sensitive areas are 14.77%. According to Fig. 5, buffer zones such as farmland, waters, and beaches have a high ecological sensitivity, whereas other plots have a low sensitivity.
Fig. 5 Ecological sensitivity analysis of vegetation coverage (Minimally sensitive)

4.1.5 Sensitivity analysis of vegetation types

Vegetation types were classified into five categories based on the current state of the park’s vegetation planting: bare land, water wetland, woodland, shrub grassland, and farmland. As shown in Fig. 6, the insensitive area accounts for 38.68% of the total area, with the majority of it concentrated in internal land, such as woodland and wetland. The minimally sensitive area is 2.83%, and the moderately sensitive area is 29.71%, and they are mostly found in farmland, woodland, and other vegetated plots. The extremely sensitive area is 23.60%, and the highly sensitive area is 5.28%. These areas are mostly found in the man-made landscapes and buildings, such as the Wetland Museum and Wenshi Yantai Dingmazu Park.
Fig. 6 Ecological sensitivity analysis of vegetation types (Minimally sensitive)

4.1.6 Analysis of water area and wetland sensitivity

Rivers, ponds, beaches, streams, and other types are prevalent in the study area. The greater the ecological sensitivity, the closer the area is to the water (Liu, 2016). According to the current state of the park’s water system, buffer zones were established with peripheral distances of 200 m or more, 80-200 m, 30-80 m, 0-30 m, and 0 m, respectively, and assigned values of 1 through 5. As shown in Fig. 7, the area distribution of various types of areas is relatively balanced, with insensitive areas accounting for 11.25% of the total, with the majority concentrated in Wenshi Yantai top Mazu Park; in addition to 19.96% in vulnerable areas and 24.72% in moderately sensitive areas, primarily in inland woodland and farmland. The area is primarily distributed in ponds, riverbanks, beaches, farmland canals, and other areas with a highly sensitive area of 20.47% and an extremely sensitive area of 23.60%. As a result, it is necessary to strengthen the protection of these portions of the water area, establish an appropriate buffer zone, improve the water management system, and reduce artificial landscape construction, excessive use, and intervention.
Fig. 7 Ecological sensitivity analysis of water area and wetland (Minimally sensitive)

4.1.7 Sensitivity analysis of landscape ecological value

The landscape ecological value of the Minjiang Estuary Wetland Park was graded based on the aspects of the main ecosystem integrity and biodiversity. First, an artificial ecosystem with a stable ecosystem was designated as a minimally sensitive area, and a semi-natural and semi-artificial ecosystem with general biodiversity was designated as a moderately sensitive area. Third, a highly sensitive area is one in which the original habitat has been damaged and the ecosystem is uns table. According to Fig. 8 and Table 6, the highly sensitive area of landscape ecological value is 33.15%, the moderately sensitive area is 23.50%, and the minimally sensitive area is 43.45%. Minimally sensitive areas are primarily found in farmland and woodland, while moderately sensitive areas are found in ponds, banks, beaches, and wetlands, and highly sensitive areas are found in, mountains, parks, and other areas.
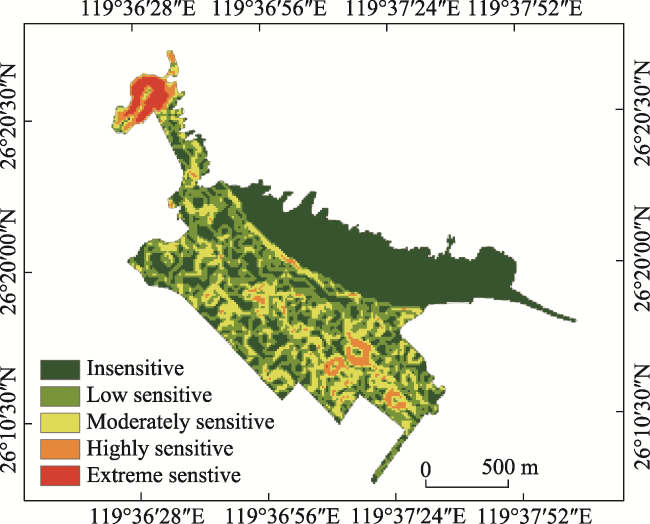
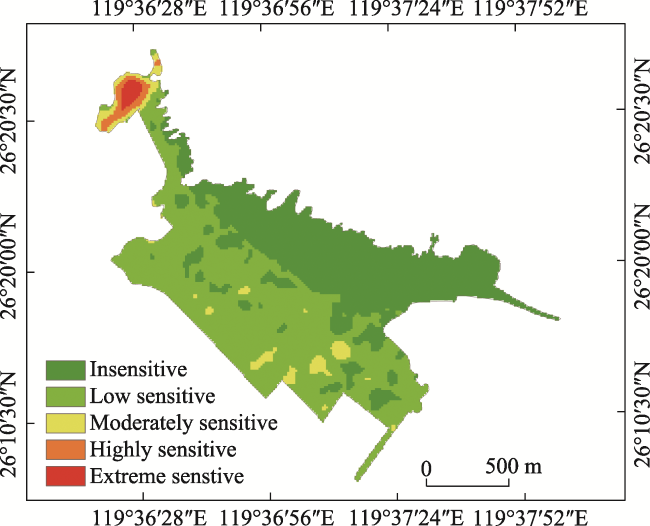
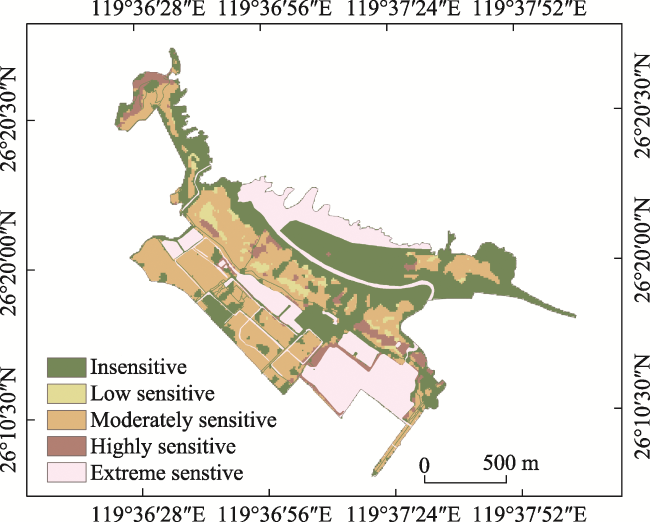
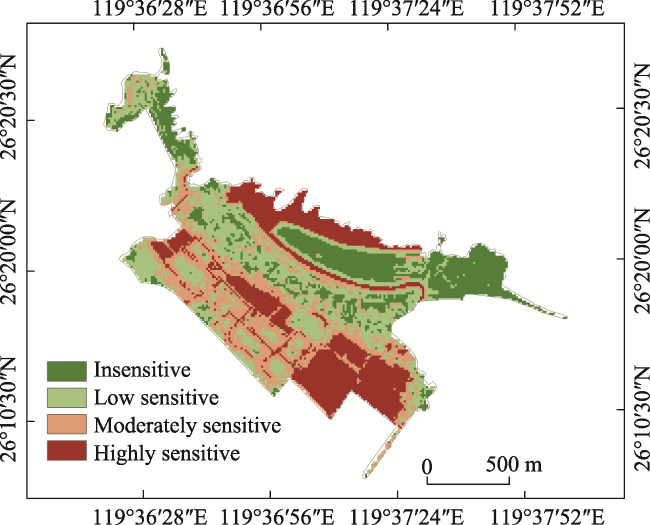
Fig. 8 Analysis of the ecological sensitivity of landscape ecological value (Minimally sensitive)
Table 6 Single factor ecological sensitivity level information
Evaluation factor Extremely sensitive Highly sensitive Moderately sensitive Minimally sensitive Insensitive
Area (ha) Ratio (%) Area (ha) Ratio (%) Area (ha) Ratio (%) Area (ha) Ratio (%) Area (ha) Ratio (%)
Slope/(°) 0.04 1.83 0.08 3.84 0.37 18.26 0.61 30.48 0.92 45.60
Elevation/m 0.02 0.78 0.03 1.41 0.08 3.87 1.03 51.53 0.85 42.42
Aspect 0.17 8.33 0.40 19.83 0.27 13.55 0.28 13.99 0.89 44.31
Vegetation coverage 0.26 13.09 0.30 14.77 0.41 20.24 0.55 27.30 0.50 24.61
Vegetation form 0.47 23.60 0.11 5.28 0.60 29.71 0.06 2.83 0.78 38.68
Waters, wetlands 0.47 23.60 0.41 20.47 0.50 24.72 0.40 19.96 0.23 11.25
Landscape ecological value - - 0.67 33.15 0.47 23.50 0.87 43.45 - -
Landscape pattern 0.39 20.25 0.15 7.55 0.13 2.74 0.03 1.49 1.31 67.97

4.1.8 Landscape pattern sensitivity analysis

The sensitivity of landscape patterns is determined primarily by five factors: average patch area, patch density, patch area, fragmentation index, and patch number. According to the evaluation values in Table 2, ArcGIS10.0 was used to analyze the study area’s landscape pattern ecological sensitivity grading map. Figure 9 and Table 6 show that 67.97% of the park is an insensitive area, with the majority of it concentrated in the park’s waters, farmland, woodland, and other areas. Minimally and moderately sensitive areas, which account for approximately 4.2% of the total, are primarily concentrated on roads and canals. The highly sensitive area is 7.55% and the extremely sensitive area is 20.25%Table 7.
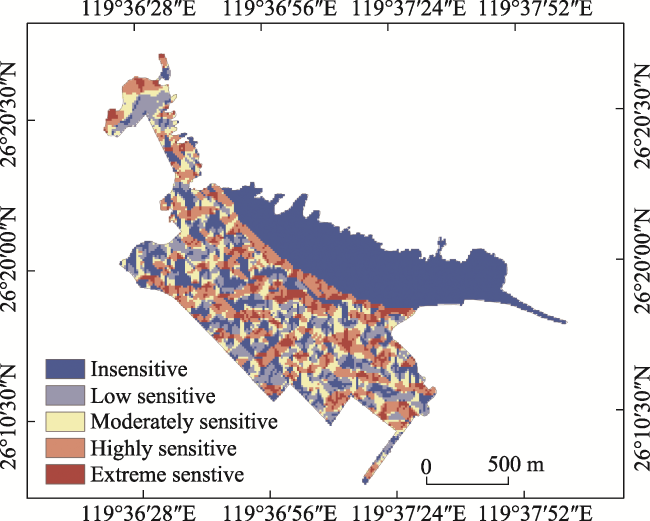
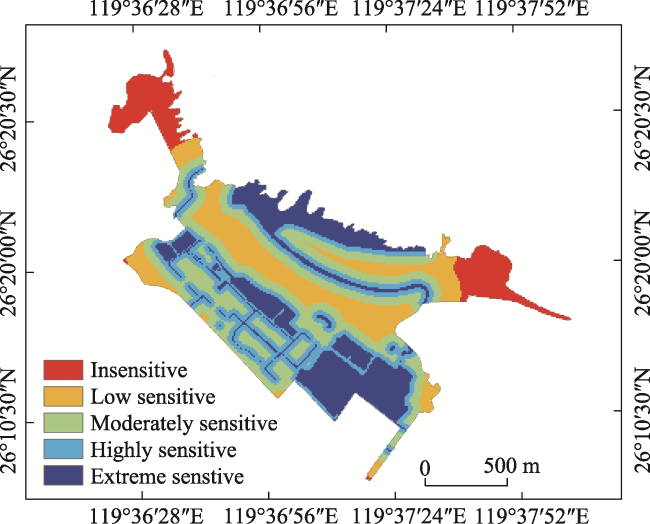
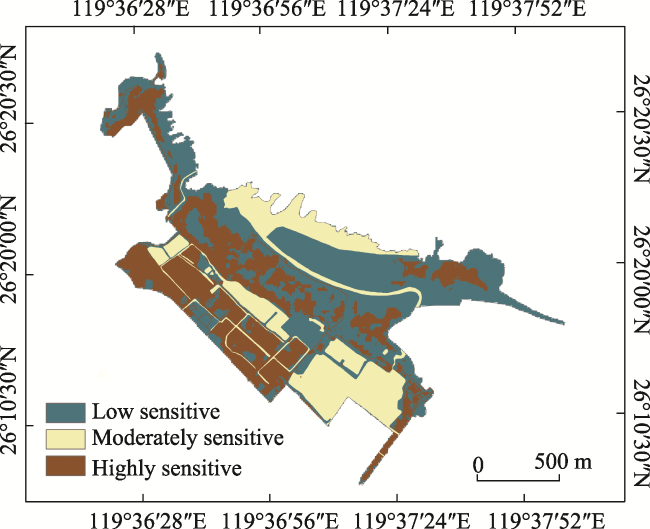
Fig. 9 Analysis of the ecological sensitivity of landscape pattern (Minimally sensitive)
Table 7 Analysis of the Landscape Pattern Index and the Classification of Landscape Types
Types of landscape ecological elements Class area, (m²) Number of patches Patch density Average patch area (m²) Fragmentation index
Wetland 47.3622 16 7.9393 29601 0.0005
Woodland 10.6425 124 61.5299 858 0.1445
Farmland 59.871 272 134.9688 2201 0.1236
Irrigation grassland 5.6952 50 24.8104 1139 0.0439
Road 5.399 32 15.8787 1687 0.0190
Build 1.5338 46 22.8256 333 0.1381
Other 71.0244 410 203.4456 1732 0.2367

4.2 Comprehensive analysis of the ecological sensitivity evaluation

4.2.1 Comprehensive evaluation of ecological sensitivity

Synthesizing the eight single-factor sensitivity analysis figures using GIS’s spatial analysis, the comprehensive sensitivity index values ranged from 1.13199 to 4.3873 (Table 8). The comprehensive evaluation values were processed using reclassification tool of ArcGIS 10.0, and an ecological sensitivity analysis map of Minjiang Estuary National Wetland Park was created (Fig. 10). The comprehensive ecological sensitivity index model’s calculation formula is as follows:
${{S}_{i}}=\sum\limits_{j=1}^{n}{{{E}_{ij}}\times {{W}_{j}}}$
Table 8 Statistical table of grade information for the comprehensive ecological sensitive areas
Ecological sensitivity grade Graded interval Area (㎡) Proportion (%)
Highly sensitivity 1.13199-1.9234 0.42 21.04
Mederately sensitivity 1.9234-2.4085 0.59 29.18
Low sensitivity 2.4085-3.0341 0.52 26.05
Insensitive 3.0341-4.3873 0.48 23.73
Fig. 10 Comprehensive ecological sensitivity analysis diagram
where Si is the ecological sensitivity index of the i evaluation unit, and i is the number of the evaluation units; Eij is the sensitivity value of the j evaluation factor of the i evaluation unit; and Wj is the weight value of the j evaluation factor.

4.2.2 Comprehensive analysis of ecological sensitivity

Figure 10 and Table 8 show that the insensitive area covers 23.73% of the total area, with the majority of it concentrated in the inland woodland area and the artificial landscape area along the shore. These areas are suitable for development and construction because they can withstand certain levels of disturbance from development and construction and have a stable ecological environment. However, during the development and construction process, the principle of sustainable development should still be followed, and scientific and reasonable planning should be made in order to meet people’s needs while not destroying the current ecological system’s stability.
According to Fig. 10 and Table 8, with a total area of 26.05%, the low sensitivity areas are primarily distributed in artificial environments such as woodland, farmland periphery, Wenshi Yantai Dingmazu Park, wetland museum, and others. This type of area has high biodiversity, a stable habitat, and can withstand external interference to some extent. We should pay attention to the principle of moderation and develop its multi-functional characteristics in subsequent planning and construction.
According to Fig. 10 and Table 8, the middle sensitivity area covers 29.18% of the total park area and is primarily located in the buffer zone around the water area. Such areas are ecologically sensitive, and the environment is easily harmed. This necessitates that, in the subsequent planning process, consideration must be given to the protection of the original ecological environment, in order to minimize the interference and influences of tourists and others.
According to Fig. 10 and Table 8, the highly sensitivity areas are primarily found in the park’s wetlands of riparian beaches, ponds, and canals, accounting for 21.04% of the total area. The ecological sensitivity shows that this type of area is extremely fragile, and there are many different types of aquatic and terrestrial plants, and human activities have affected and destroyed the natural ecosystem. This necessitates that subsequent planning must strictly control and manage such areas, and prohibit development. Simultaneously, protective measures should be strengthened to reduce human influences and interference in this area, in order to restore and stabilize its ecosystem.

5 Conclusions

This study of the ecological sensitivity and regional evaluation of the Minjiang River Estuary National Wetland Park provides a scientific basis for the formulation of regional policies for the prevention and treatment of wetland ecological environmental problems. The ecological sensitivity of Minjiang River Estuary National Wetland Park was divided into four areas: Highly sensitive, Low sensitive, Moderately sensitive and Insensitive. This study puts forward suggestions for environmental protection and governance from three aspects: macro policy, medium planning and micro measures. From the macro perspective, we should be guided by macro policies, give full play to the advantages of the nature reserves, such as resource endowment and excellent ecological environment, and protect the green and ecological diversity of wetland parks. From the perspective of medium planning, we should actively introduce corresponding technical personnel, advocate for everyone to protect the wetlands, introduce corresponding protection measures and development strategies through the analysis of ecological evaluation, strengthen the park management, and improve the park management level and intensity. Microscopically, the highly sensitive areas are extremely sensitive to external environmental disturbances, and the ecological environment is extremely fragile in these areas. If it is disturbed and damaged by human activities, the consequences are serious and may be irreversible. Therefore, a strict ecological protection zone should be established from policy and planning, in which development and construction should be strictly prohibited. It is mainly located on the wetlands and waters in the study area, which is a dense water network and an area with highly sensitivity of the ecological and vegetation types of landscape ecological value. Therefore, the protection of the ecological environment should be strengthened, the original vegetation should be protected, the plant configuration should be increased, the forest cover should be improved, and the stability of the structure and function of the ecosystem should be enhanced. The ecological environment in moderately sensitive areas is sensitive too and is also fragile. The concept of sustainable development should be implemented, and we must insist on harmonizing development and conservation in the planning of the wetland park. The buffer zone for the waters in the area should be made more resilient in order to reduce the damage to the waters caused by human activities. Enhancing the resilience of the waters in the region through buffer zones will reduce damage to the waters from anthropogenic activities, while enriching the ecosystem community structure and enhancing the structural stability and integrity of the regional ecosystem through wetland areas, such as the shallow water areas. The minimally sensitive areas are mostly located in the areas around woodlands, farmlands, Yantai top Mazu Park and the Wetland Museum, where the number of landscape patches can be increased through the development of tourism agriculture or the establishment of parks to enhance the stability of the ecosystem and improve its environmental carrying capacity. Insensitive areas are mainly located in buildings, roads and unused land, etc., which can be developed and constructed in a reasonable manner, while focusing on the ecology of land construction to achieve organic harmony between the landscape and structures.
The overall sensitivity of the Minjiang Estuary Wetland National Park is relatively balanced, with high and medium sensitivity areas occupying nearly 50% and low and non-sensitive areas occupying 50%. Highly and moderately sensitive areas are mainly concentrated in the waters and the buffer zone near the waters; while moderately and insensitive areas are mainly concentrated in woodlands, farmlands or artificial landscape environments. As a result, in the future, it will be necessary to strengthen the protection of the water areas, wetlands, and their buffer zones, as well as to rationally plan the use of sensitive and low sensitivity areas in development.
The results of this study serve as a scientific guide for the development and planning of other wetland parks, but it has some limitations. Despite the fact that a number of experts were invited to score the ecological sensitivity factors of wetland parks, the subjective factors are significant, so it could easily be biased. As a result, more basic data and investigation are required to reduce the human subjectivity and improve the scientific validity of the overall ecological sensitivity evaluation. In the future, wetland park planning and management should place greater emphasis on the application of scientific foundations and theoretical knowledge, the avoidance of human interference and destruction, the promotion of harmonious coexistence between man and nature, and the protection, restoration, and development of urban wetland parks.
[1]
Ananda J, Herath G. 2009. A critical review of multi-criteria decision making methods with special reference to forest management and planning. Ecological Economics, 68(10): 2535-2548.

DOI

[2]
Cassel M, Petschel G. 2000. GIS-based assessment of the threat to world forests by patterns of non-sustainable civilisation nature interaction. Journal of Environmental Management, 59(4): 279-298.

DOI

[3]
Chen S, Jiang W W, Chen Y, et al. 2015. Ecological sensitivity analysis of Fuyang built-up area supported by GIS. Journal of Zhejiang A & F University, 32(6): 837-844. (in Chinese)

[4]
Chi Y, Zhang Z W, Gao J H, et al. 2019. Evaluating landscape ecological sensitivity of an estuarine island based on landscape pattern across temporal and spatial scales. Ecological Indicators, 101: 221-237.

DOI

[5]
Christer N, Grelsson N. 1995. The fragility of ecosystems: A review. Journal of Applied Ecology, 32: 677-692.

DOI

[6]
Christopoulou O, Tsachalidis E. 2004. Conservation policies for protected areas (wetlands) in Greece: A survey of local residents’ attitude. Water, Air and Soil Pollution: Focus, 4(4): 445-457.

[7]
Coppenolle R, Temmerman S. 2020. Identifying global hotspots where coastal wetland conservation can contribute to nature-based mitigation of coastal flood risks. Global and Planetary Change, 187: 103125. DOI: 10.1016/j.gloplacha.2020.103125.

[8]
David R. 1996. A theoretical framework for land evaluation. Geoderm, 72(3-4): 165-190.

DOI

[9]
Felix C, Kumar N. 2007. Global supplier development considering risk factors using fuzzy extended AHP-based approach. Omega, 35(4): 417-431.

DOI

[10]
Ha S R, Jung D I, Yoon C H. 1998. A renovated model for spatial analysis of pollutant runoff loads in agricultural watershed. Water Science and Technology, 38(10): 207-214.

[11]
Hassan S. 2019. Urban-rural divides in preferences for wetland conservation in Malaysia. Land Use Policy, 84: 226-237.

DOI

[12]
He Y B, Chen Y Q, Chang X, et al. 2004. Study on GIS methodology for regionalization of natural ecology and socio-economy. Journal of China Agricultural Resources and Regional Planning, (4): 39-43. (in Chinese)

[13]
Herlin I. 2016. Exploring the national contexts and cultural ideas that preceded the landscape character assessment method in England. Landscape Research, 41(2): 1-11.

DOI

[14]
Huang B R, Ouyang Z Y, Zheng H, et al. 2008. Construction of an eco-island: A case study of Chongming Island, China. Ocean & Coastal Management, 51(8-9): 575-588.

[15]
James G. 2000. Wetland loss and biodiversity conservation. Conservation Biology, 14(1): 314-317.

DOI

[16]
Jiang Y C, Li D L, Zheng R. 2020. Variation characteristics of snow cover and frozen soil and their relationships with vegetation in the Tibetan Plateau from 1971 to 2016. Transactions of Atmospheric Sciences, 43(3): 481-494. (in Chinese)

[17]
Kahraman C, Cebeci U, Ruan D. 2004. Multi-attribute comparison of catering service companies using fuzzy AHP: The case of Turkey. International Journal of Production Economics, 87(2): 171-184.

DOI

[18]
Liu L, Tang X L, Xiong X, et al. 2018. Ecological sensitivity analysis of rural natural landscape in the south of Jiangsu Province based on GIS. Journal of Nanjing Forestry University (Natural Sciences Edition), 42(4): 159-164. (in Chinese)

[19]
Liu S Y, Tang X L, Sun Y F, et al. 2021. Impact of tourists’ ecological values on their environmental responsibility behavior: The case of Yuelu Mountain Scenic Areas. Areal Research and Development, 40(1): 161-167. (in Chinese)

[20]
Liu W Y. 2016. Research on the recognition and spatial regulation strategy of urban waterfront buffer zone. Diss., Wuhan, China: Huazhong University of Science and Technology. (in Chinese)

[21]
Lu M, Li K K, Kang W F, et al. 2012. Research progress of wetland landscape architecture. Journal of Shandong Jianzhu University, 27(2): 224-228. (in Chinese)

[22]
Lu M, Mu H G, Tan L, et al. 2022. Ecological sensitivity evaluation of Jixi National Wetland Park based on ArcGIS. Periodical of Ocean University of China, 52(12): 95-103. (in Chinese)

[23]
Lu T Z. 2007. Study on typology of ecological methods in urban design since 1990 in China. Diss., Shanghai, China: Tongji University. (in Chinese)

[24]
Ma Y C, Wang Y B. 2021. The establishment of ecological sensitivity assessment system on urban blue-green space. Intelligent Building and Smart City, (6): 47-49. (in Chinese)

[25]
Naujokaitis-Lewis I, Curtis M, Arcese P, et al. 2009. Sensitivity analyses of spatial population viability analysis models for species at risk and habitat conservation planning. Conservation Biology, 23(1): 225-229.

DOI PMID

[26]
Peng T, Liu J X, Deng C Y. 2021. Ecological sensitivity evaluation of Fuzhou National Forest Park based on GIS and Analytic Hierarchy Process method. Taiwan Agricultural Research, (1): 84-90.

[27]
Qin R. 2020. Study on functional division of Lugu Lake Wetland Nature Reserve based on ecological sensitivity analysis. Diss., Chengdu, China: Chengdu University of Technology. (in Chinese)

[28]
Ramanathan R. 2001. A note on the use of the analytic hierarchy process for environmental impact assessment. Journal of Environmental Management, 63(1): 27-35.

PMID

[29]
Ratcliffe D. 1997. A nature conservation review. Cambridge, UK: Cambridge University Press.

[30]
Rossi P, Pecci A, Amadio V, et al. 2008. Coupling indicators of ecological value and ecological sensitivity with indicators of demographic pressure in the demarcation of new areas to be protected: The case of the Oltrepò Pavese and the Ligurian-Emilian Apennine area (Italy). Landscape and Urban Planning, 85(1): 12-26.

DOI

[31]
Saaty T. 1994. How to make a decision: The analytic hierarchy process. Interfaces, 24(6): 19-43.

[32]
Sierszen M, Morrice J, Trebitz A, et al. 2012. A review of selected ecosystem services provided by coastal wetlands of the Laurentian Great Lakes. Aquatic Ecosystem Health & Management, 15(1): 92-106.

[33]
Thamaga K, Dube T, Shoko C. 2022. Advances in satellite remote sensing of the wetland ecosystems in Sub-Saharan Africa. Geocarto International, 37(20): 5891-5913.

DOI

[34]
Tian M. 2020. Sensitivity-based analysis of ecospatial structure of tourism industry in Shandong Province. Journal of Southwest China Normal University (Natural Science Edition), 45(7): 100-106. (in Chinese)

[35]
Wang H C, Wang L, Wei B L. 2019. The ecological sensitivity evaluation of characteristic town based on GIS: A case in Yingqiu Town of Shandong Province. Periodical of Ocean University of China, 49(8): 100-107. (in Chinese)

[36]
Wei Y L. 2020. Ecological sensitivity evaluation of Hefei based on GIS and RS. Technology Wind, (14): 153-154. (in Chinese)

[37]
Wu J H, Li J W, Zhu H R. 2011. Land ecological sensitivity evaluation of Yan’an based on zonal statistics of ArcGIS. Journal of Natural Resources, 26(7): 1180-1188. (in Chinese)

[38]
Wu L J. 2016. The ecological sensitivity analysis of Lang Mountain Scenic Area’s research on protection and utilize. Diss., Changsha, China: Central South University of Forestry and Technology. (in Chinese)

[39]
Yang C Y, Wang S X, Yang C Y, et al. 2021. Spatial-temporal variation characteristics of vegetation coverage along Sichuan-Tibet railway. Journal of Arid Land Resources and Environment, 35(3): 174-182. (in Chinese)

[40]
Yue J Y, Lu J Y, Fan L Z, et al. 2022. Study on ecological sensitivity evaluation and protection strategy of Mount Tai Scenic Spot. Jiangxi Science, 40(1): 117-124. (in Chinese)

[41]
Zhang M W, Jin H J, Cai D S, et al. 2010. The comparative study on the ecological sensitivity analysis in Huixian Karst Wetland, China. Procedia Environmental Sciences, 2: 386-398.

DOI

[42]
Zhang Z, Xu J H, Han G F. 2007. Ecological sensitive area division indicator system. Ecologic Science, 26(1): 79-83. (in Chinese)

[43]
Zhou X Y, Cai J, Zhang W W. 2021. Ecological sensitivity evaluation of national ecological county based on GIS. Journal of Yunnan Agricultural University (Social Science), 15(4): 148-155. (in Chinese)

Outlines

/