Impact of Human Activities on Ecosystem

Does the Construction of a Power Transmission Line (PTL) in a Coastal Mountainous Area Affect the Regional Ecological Security?—Taking Fujian Tangyuan PTL as an Example

  • ZHENG Cuichun , 1 ,
  • LI Xiaomei , 1, * ,
  • FAN Zhipeng 1 ,
  • LI Xi 2
Expand
  • 1. College of Environmental and Resources Sciences & College of Carbon Neutral Modern Industry, Fujian Normal University, Fuzhou 350007, China
  • 2. Electric Power Research Institute, State Grid Fujian Electric Power Co. Ltd, Fuzhou 350007, China
*LI Xiaomei, E-mail:

Received date: 2023-03-14

  Accepted date: 2023-06-12

  Online published: 2023-12-27

Supported by

The Scientific and Technological Project of State Grid Fujian Electric Power Co., Ltd.(52130420002F)

Abstract

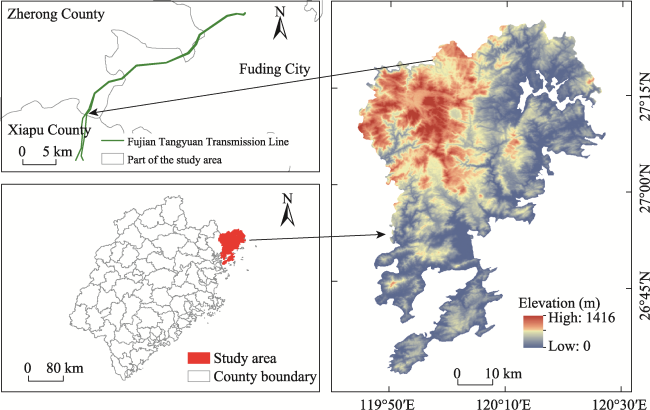
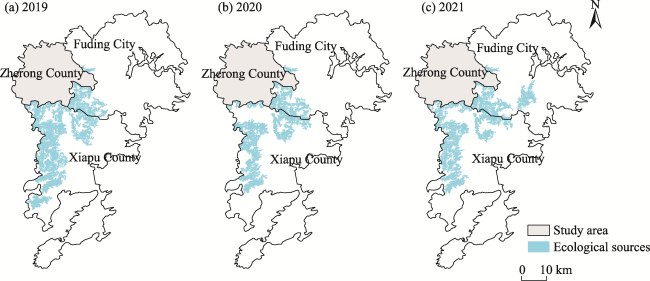
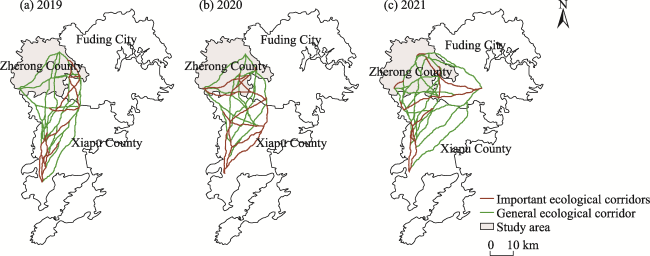
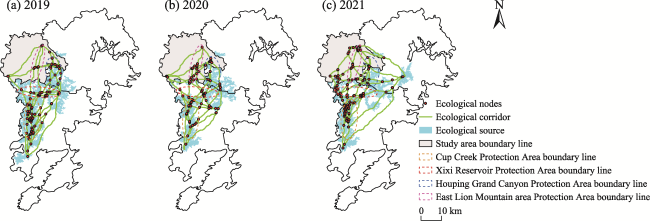
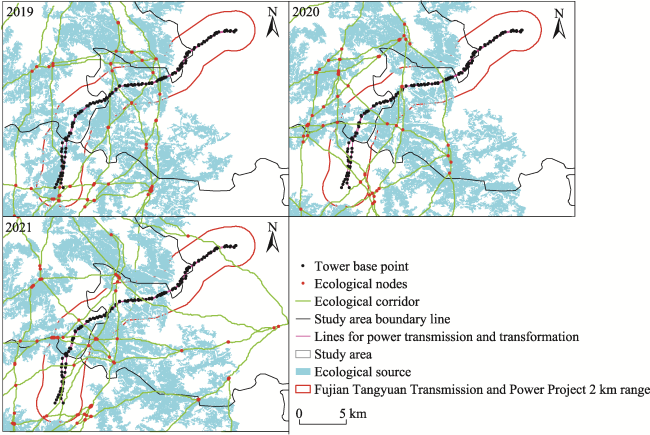
Ecological security and its patterns are hot topics for regional ecological protection. In the subtropical coast mountainous area with high precipitation, complex topography, and frequent typhoons, does the construction of a Power Transmission Line (PTL) affect local ecological security? Taking Fujian Tangyuan PTL as an example, this study examined changes in the Ecological Security Pattern (ESP) at regional and local scales by using Morphological Spatial Pattern Analysis (MSPA), Minimum Cumulative Resistance (MCR) and the Gravity model. The results showed that within the PTL timelines (before, during and after building the PTL), the ecological source area occupied 14.21%, 11.79% and 14.11% of the whole research region; while the important eco-corridors numbered 20, 21 and 16, respectively; and the eco-nodes numbered 168, 123 and 227, respectively. At the local scale, in the PTL buffer space (2 km from the PTL on either side, i.e., the potential ecological impact zone) within the timelines (before-during-after building the PTL), the ecological source area occupied 39.78 km2, 27.44 km2 and 29.88 km2, respectively, and the eco-corridor lengths were 50.78 km, 44.36 km and 67.18 km with 13, 7 and 25 eco-nodes, respectively. Clearly, during the building of the PTL, the ecological “source-corridor” decreased at first and gradually recovered after the construction, while the challenge to the ecological safety from the PTL occurred at the local scale. The results of this study provide a method for evaluating the ecological integrity disturbance by linear projects and scientific protection strategies are proposed.

Cite this article

ZHENG Cuichun , LI Xiaomei , FAN Zhipeng , LI Xi . Does the Construction of a Power Transmission Line (PTL) in a Coastal Mountainous Area Affect the Regional Ecological Security?—Taking Fujian Tangyuan PTL as an Example[J]. Journal of Resources and Ecology, 2024 , 15(1) : 173 -181 . DOI: 10.5814/j.issn.1674-764x.2024.01.015

1 Introduction

Ecological security means the preservation of the ecological condition and ecosystem services of a region to effectively guarantee economic development for people’s life and health without degradation (Fu, 2010). Since it appeared in the report of the 19th National Congress, the issue of ecological security has gradually attracted great attention (Sun, 2017). The ecological security pattern (ESP) refers to the ecosystem spatial configuration for maintaining species diversity and the integrity of the ecosystem structure and processes (Ma et al., 2004), and for enabling a sustainable supply of ecosystem services.
The main methods of ESP are graph theory, circuit theory, superposition method, Minimum Cumulative Resistance (MCR) and others (Zhang et al., 2021). MCR can explicitly reveal the interactions between landscape pattern changes and ecological process evolution, and is widely used in regional ESP research (Tan et al., 2020). Following the landscape pattern theory of Forman (Forman and Baudry, 1984), Yu (1999) initially proposed the “landscape ESP” based on the MCR model. Based on MCR, Yang proposed a “green center corridor network” with “four belts, three zones, seven clusters, ten corridors, and multiple centers” for the urban agglomeration in Guanzhong District (Yang et al., 2017). By using RS and GIS technology, there are many models for ESP, such as the InVEST model (Zhao et al., 2022), MSPA model (Yao et al., 2022), FLUS model (Liu et al., 2021), and gravity model (Feng et al., 2022). ESP aims to solve the spatial conflicts between economic development and eco-environmental protection for regional sustainable development (Li et al., 2007).
Current ESP research is mostly conducted at the regional scale, and less involves a small scale such as building sites. Presently, the ecological impact assessment of projects is focused on “species-habitat-biological community-ecological system-ecologically sensitive area” (Ministry of Ecology and Environment of China, 2022), which requires predicting the potential ecological impact on the environment. Ecological security is less of a concern in the field of ecological assessment.
This study investigated the changes in ESP during the construction of an EPL in a subtropical coastal mountain area. Fujian Tangyuan PTL (State Grid and Southern Power Grid Connection Project) was taken as the research site, which is located in the Northern part of Fujian province. This study focused on tracing the changes in ESP in the three timelines (before (2019), during (2020) and after (2021) the PTL construction) using the MCR model at both regional and local (i.e., a 2 km buffer zone on each side of the line) scales. The results can provide a feasible theory and practical methods for evaluating the changes in ecological integrity caused by engineering projects.

2 Study area and data

2.1 Study area

The research area, where the Fujian Tangyuan PTL is located, includes Zherong, Fuding and Xiapu counties in Northern Fujian Province (Fig. 1). In Fuding City, 91.03% of the total land area is covered by hilly terrain with a forest coverage rate of 60.3%. In Zherong County, the forest coverage rate is 75.5%. Furthermore, Xiapu County has a long coastline (505 km), one-eighth of which is located in the province. The topography of the research area is dominated by low hills and mountains, and the rainfall is high (1500-2000 mm) and concentrated. The Fujian Tangyuan PTL starts in Xishanxia Village, Xiapu County, and ends in Bailin Town, Fuding City. The project was built from October 2019 to September 2020.
Fig. 1 Geographical location of the study area

2.2 Data sources

The data in this study include remote sensing image data, DEM data, road data, and other relevant data (Table 1). Sentinel-2 images were selected for January 24 and 29, 2019 (before construction), February 18, 2020 (during construction), and January 13 and 18, 2021 (after construction).
Table 1 Data information and sources
Data type Spatial resolution Data source
Sentinel-2 data 10 m ESA (https://earth.esa.int/web/guest/home)
Rainfall data 10 km NASA (https://www.nasa.gov/)
ASTER GDEM 30 m Geospatial Data Cloud (http://www.gscloud.cn/)
Soil property data Vector Institute of Soil Science, Chinese Academy of Sciences (http://www.issas.ac.cn/)
Road data Vector National Catalogue Service for Geographic
Settlement data Vector Information (https://www.webmap.cn/main.do?method=index)

3 Research methodology

3.1 Morphological spatial pattern analysis

Unlike the traditional ecological analysis methods at a coarse scale, Morphological Spatial Pattern Analysis (MSPA) can identify and segment the raster image pixels through mathematical calculations to derive the ecological patches (Qin et al., 2023). MSPA can divide the data into seven non-overlapping landscape morphology classes of core, isolated island, gap, edge area, connecting bridge, traffic circle, and branches (Xu et al., 2015), among which the core is considered as the ecological source site.

3.2 Landscape Connectivity Index

Landscape connectivity refers to the mutual continuity of landscape elements between spatial units, and it can quantitatively characterize the ease of material diffusion and migration of one element between ecological source sites (Guo et al., 2021). Currently, the most commonly used landscape connectivity indices include the overall connectivity index $dIIC$ in Eq. (1), the possible connectivity index PC in Eq. (2), and the patch importance index dPC in Eq. (3).
$dIIC=\frac{\sum\limits_{i=1}^{n}{\sum\limits_{j=1}^{n}{\frac{{{\alpha }_{i}}{{\alpha }_{j}}}{1+n{{l}_{ij}}}}}}{A_{L}^{2}}$
$PC=\frac{\sum\limits_{i=1}^{n}{\sum\limits_{j=1}^{n}{{{\alpha }_{i}}{{\alpha }_{j}}P_{ij}^{*}}}}{A_{L}^{2}}$
$dPC=\frac{PC-P{{C}_{\text{remove}}}}{PC}$
where n is the total number of patches in the region;${{a}_{i}}$ is the area of patch i; ${{a}_{j}}$ is the area of patch j; nlij represents the number of connections between patch i and patch j; $P_{ij}^{\text{*}}$ is the maximum of the product of all path probabilities between patch i and patch j; ${{A}_{L}}$ is the total area of the landscape in the study area; dIIC denotes the overall connectivity index of the patches; PC denotes the possible connectivity index of the patches; dPC denotes the importance of the patches; and $P{{C}_{\text{remove}}}$ denotes the possible connectivity index of the landscape after removing an element in the landscape (Qin et al., 2023).

3.3 Minimum Cumulative Resistance

Minimum Cumulative Resistance (MCR) is a model for calculating the minimum cost of species movement from a source to a destination (Liu et al., 2010; Yang et al., 2022). In GIS spatial analysis, the model determines the connection paths between each of the ecological source sites (Chen et al., 2022) through the setting of ecological resistance coefficients. Its calculation formula is given in Eq. (4).
$MCR={{f}_{\text{min}}}\left( \underset{i=1}{\overset{m}{\mathop \sum }}\,\sum\limits_{j=1}^{n}{{{D}_{ij}}\times {{R}_{i}}} \right)$
where MCR is the minimum cumulative resistance value; fmin reflects the function of the positive relationship between $MCR$ and the variables Dij and Ri; Dij denotes the spatial distance from ecological source j to i; and ${{R}_{i}}$ denotes the resistance of a species crossing a landscape surface i.
As shown in Table 2, this study selected seven factors that represent natural and human aspects as the ecological resistance factors for constructing a comprehensive resistance surface evaluation index system for ecological expansion (Li, 2020; Yang et al., 2021; Qin et al., 2023). The seven factors are all closely related to ecological resistance. Among them, the land use type comprehensively reflects the ecological landscape, and its ecological resistance weight is highest. The distance from residential areas and road density directly reflect the impact of human activities on ecological security. The larger the distance from residential areas, the smaller the ecological resistance; and the higher the road density, the greater of the ecological resistance. In the research area, the complex terrain is a natural barrier for ecological connections, so greater values of DEM and slope may resist species movement. At the landscape scale, a higher vegetation coverage may be beneficial for ecological security. Analytic Hierarchy Process was applied to determine the weights of each of the factors. At a consistency test value of CR<0.10, the judgment matrix passes the consistency test, and finally provides the MCR according to Eq. (1).
Table 2 Resistance classification and resistance values of the ecological resistance factors
Resistance factor Unit Weight Resistance value
1 3 5 7 9 11
Elevation m 0.18 0-146 146-335 335-538 538-767 767-1416 -
Land use type - 0.26 Woodland Water Arable land Unused land Construction land -
Slope ° 0.10 0.1-7.13 7.13-17.18 17.18-27.03 27.03-37.82 37.82-77.71 -
Distance from the settlement m 0.18 3000-5000 - 2000-3000 1000-2000 0-1000 -
Vegetation cover - 0.05 0.87-1 0.69-0.87 0.48-0.69 0.20-0.48 0-0.20 -
Road density km km-2 0.09 0.71 0.71-2.08 2.08-3.50 3.50-5.33 5.33-48.91 -
Soil erosion intensity - 0.13 Slight Mild Moderate Strong Extremely strong Severe

3.4 Gravity model

The gravity model can quantify the interactions between source sites and is used to evaluate the relative importance of ecological corridors (Ai et al., 2023). Based on the MCR model, the gravity model extracts important ecological corridors from the potential ecological corridors. The gravity model is shown in Eq. (5).
${{G}_{ij}}=\frac{{{N}_{i}}{{N}_{j}}}{D_{ij}^{2}}=\frac{\frac{\ln {{S}_{i}}}{{{P}_{i}}}\times \frac{\ln {{S}_{j}}}{{{P}_{j}}}}{{{\left( \frac{{{L}_{ij}}}{{{L}_{\text{max}}}} \right)}^{2}}}=\frac{{{L}_{\text{max}}}^{2}\ln {{S}_{i}}\ln {{S}_{j}}}{L_{ij}^{2}{{P}_{i}}{{P}_{j}}}$
where Gij is the mutual work force between patches i and j; Ni and Nj are the weights of the two patches, respectively;
${{D}_{ij}}$is the normalized value of the potential corridor resistance between patches i and j; Pi is the resistance value of patch i; ${{S}_{i}}$ is the area of patch i; ${{L}_{ij}}$ is the cumulative resistance value of the corridor between patches i and j; and ${{L}_{\text{max}}}$ is the maximum value of the cumulative resistance of all corridors.

4 Results and analysis

4.1 Regional ESP

4.1.1 Ecological source

The ecological source maintains regional ecosystem stability and provides most of the ecosystem services (Wang et al., 2022). In this study, the maximum likelihood method was used to classify Sentinel-2 images into five land use classes of woodland, watershed, parkland, construction land, and unused land. This study considered three timelines of “before (2019), during (2020) and after (2021)” the PTL building. The final classification accuracy was greater than 90%. By using the woodland and watershed as foreground and other land classes as background, seven landscape morphology types were obtained by MSPA. The top 30 core areas were chosen, then the top 10 patches with the greatest patch importance index $dPC$ were extracted as the important ecological source sites in the study area (Fig. 2).
Fig. 2 Spatial distribution of the regional ecological sources in 2019, 2020 and 2021

4.1.2 Ecological corridors

An ecological corridor is a narrow and continuous strip area between two ecological sources that serves as a route for organism migration at the least cost. It not only sustains landscape ecological processes, but also contributes to the enrichment of local regional biodiversity (Li, 2020). With low resistance to expansion, it is a channel between two adjacent ecological source sites and an important flow channel for species migration in the region (Yang et al., 2021). This study identified the ecological corridors by using MCR and the gravity model (Fig. 3).
Fig. 3 Spatial distribution of the important regional ecological corridors in 2019, 2020 and 2021
Based on the MCR model, 158 (2019), 144 (2020) and 270 (2021) potential ecological corridors were identified in the three time periods, while the numbers of important ecological corridors for the corresponding years based on the gravity model were 20, 21 and 16 (Fig. 3). Figure 3 shows that the ecological corridors in the three periods were similar within a “quadrilateral” space.

4.1.3 Ecological nodes

Ecological nodes, which can be referred to as ecological pinch points or ecological strategic points, serve as stepping stones for the corridor networks. They provide resting places for migratory species, can increase landscape connectivity, and facilitate the movement of interior species between patches (Ding et al., 2022). If ecological nodes are destroyed, the migration and dispersal of species will be impeded. The intersections between all ecological corridors were set as ecological nodes, and the numbers of ecological nodes in the three timelines were 168, 123, and 227, respectively (Fig. 4).
Fig. 4 Regional ecological protection focus areas in 2019, 2020 and 2021

4.1.4 Ecological reserves

ESP is comprehensively composed of ecological “source- corridor-node”. According to the results of the regional ESP, four ecological safety protection areas can be outlined clearly (Fig. 4), and they can be named as the Cup Creek and Xixi Reservoir Ecological Safety Protection Area in Xiapu County, the Houping Grand Canyon Ecological Safety Protection Area across Fuding, Zherong and Xiapu County, and the East Lion Mountain Ecological Safety Protection Area across Zherong and Xiapu counties.

4.2 Regional ESP impacts

The spatial disturbance of regional ESP occurred during the construction period. Figure 2 shows that the ecological source space was displaced, and the ecological source space was expanded to the west during (2020) and after (2021) construction, and the important ecological corridors were shifted to the west. The ecological source sites were located in the western and central mountainous areas with higher vegetation coverage and greater connectivity, which are suitable for species migration as well as material and energy exchange. In the eastern, northern and southern areas, the land use consists of garden land, arable land and construction land with a higher level of urbanization.
The construction of PTL has brought changes in the regional ecological “source-corridor-node”. The total ecological source areas occupied 14.21% (2019), 11.79% (2020) and 14.11% (2021) of the study area in the three periods. Taking pre-construction as the background, the impact of construction on the regional ESP is shown in Fig. 4. Before construction, the ecological “source-corridor-node” parameters were an area of 465.66 km2, a length of 566.44 km, and numbering 168, respectively. The number showed a decline during construction. After construction, the corresponding ecological “source-corridor-node” parameters were 462.18 km2 (-0.75%), 624.02 km (+10.17%), and 227 (+35.11%), respectively. Note that the numbers in parentheses indicate the degree of change, and this notation is also used below. In 2021, the area of ecological source sites had not yet recovered to the level of the pre-construction period (2019).
Taking pre-construction as the background, the impact of the PTL construction on the conservative areas is shown in Fig. 4 and Table 3. In 2019, the “source-corridor-node” parameters of Cup Creek ecological safety protection area were 79.80 km2, 140.54 km, and 87, respectively, and these parameters were reduced in 2020 and in 2021. There were mountain ecological areas such as Qiaotouzai Mountain, Dapingli Mountain and Baishi Mountain in Cup Creek. The “source-corridor-node” parameters of Xixi Reservoir ecological safety protection area in 2019 were 29.59 km2, 72.15 km, and 27, respectively; in 2021, they were 18.49 km2 (-37.51%,), 57.63 km (-20.12%), and 28 (+3.70%); and in 2020, these parameters showed declines. There were mountain ecological areas such as Chai Mountain, Qukeng Mountain and Flaming Mountain in Xixi Reservoir. The “source-corridor-node” parameters of Houping Grand Canyon ecological safety protection area in 2019 were 47.75 km2, 79.01 km, and 26, respectively; in 2020, they were 48.62 km2 (+1.82%), 51.32 km (-35.05%), and 22 (-15.38%); and in 2021, smaller values of these parameters were observed. In Houping Grand Canyon, Houping Grand Canyon, Menkeng Mountain and Jianfeng Top were the ecological areas. The “source-corridor-node” parameters of East Lion Mountain’s ecological safety protection area in 2019 were 32.71 km2, 48.47 km, and 7, respectively; and in 2020 and 2021, these parameters showed expansion. In East Lion Mountain, the mountainous ecological areas were Niutou Mountain, High Mountain and North Mountain.
Table 3 Regional ecological protection hot-spot areas
Timeline Variable Ecological safety protection area
Cup Creek area Xixi Reservoir area Houping Grand Canyon area East Lion Mountain area
Pre-construction (2019) Ecological source (km2) 79.80 29.59 47.75 32.71
Ecological
corridor (km)
140.54 72.15 79.01 48.47
Ecological node (piece) 87 27 26 7
Under
construction (2020)
Ecological source (km2) 62.44 (‒21.75) 12.20 (‒58.77) 48.62 (+1.82) 37.28 (+13.97)
Ecological
corridor (km)
99.87 (‒28.94) 48.89 (‒32.24) 51.32 (‒35.05) 63.65 (+31.32)
Ecological node (piece) 30 (‒65.52) 12 (‒55.56) 22 (‒15.38) 28 (+300.00)
After construction (2021) Ecological source (km2) 64.80 (‒18.80) 18.49 (‒37.51) 47.25 (‒1.05) 38.13 (+16.57)
Ecological corridor (km) 111.25 (‒20.84) 57.63 (‒20.12) 63.32 (‒19.86) 53.28 (+9.92)
Ecological node (piece) 61 (‒29.89) 28 (3.70) 15 (‒42.31) 40 (+471.43)

Note: The data in parentheses represent the growth rates compared to pre-construction, %; The same below.

Overall, the ecological safety protection areas in Cup Creek and Xixi Reservoir were somewhat influenced by the building of the PTL, while those in Houping Grand Canyon were weak. After the construction, the previous ecological safety protection area had not been completely restored to the pre-construction level. Therefore, the ecological protection should be strengthened in these areas.

4.3 Impact of ESP in the buffer area

4.3.1 Impact of ESP in the buffer area

According to “Technical Guidelines for Environmental Impact Assessment Ecological Impact” (HJ 19-2022), and the ecological environmental characteristics of the area where this power transmission line crossed, a 2 km buffer area could be drawn out as the ecological evaluation area of the project (Fig. 5).
Fig. 5 ESP in the buffer area of Fujian Tangyuan PTL
As shown in Fig. 5, the ecological source sites in the buffer area were mainly distributed to the east and southwest of the line in 2019, while the southern ecological source sites had almost disappeared in 2020 and 2021. In 2019, the ecological corridors were dense in the central and southwestern parts of the line, but in 2020, the ecological corridors moved to the south and decreased in density. In 2021, one ecological corridor was added in the north, and the central ecological corridors were densely interwoven, but they were sparse in the southern part. In 2019, the ecological “source-corridor-node” parameters in the buffer area were 39.78 km2, 50.78 km, and 13; while in 2020, they were 27.44 km2, 44.36 km, and 17, respectively. The corresponding figures in 2021 were 29.88 km2, 67.18 km, and 25, respectively. Therefore, the area of the ecological source and the length of the ecological corridors in the buffer area were reduced under the influence of project construction, while after construction, there were rapid improvements in the area of ecological sources, the length of ecological corridors, and the number of ecological nodes. Additionally, the buffer area crossing the ecological protection area of Xixi Reservoir was 20.91 km2 and that of Houping Grand Canyon was 34.48 km2. Therefore, the construction of PTL led to the spatial displacement of the ESP, a rapid decline in the ecological source area, a reduction in the ecological corridor length, and incrementing of the ecological nodes.

4.3.2 The ecological safety protection area for building PTL

There are a total of 137 tower bases in Fujian Tangyuan PTL. The starting tower bases were located on both sides of the county road in Xishanxia Village, Xiapu County, and the ending tower bases were located on the north side of Xinyang Natural Village, Tangyuan Administrative Village, Bailin Town, Fuding City. A total of 61 pagodas were located in the ecological protection areas, 18 of which were located in the ecological protection area of Xixi Reservoir and 43 of which were located in the ecological protection area of Houping Grand Canyon. The pagodas ZA9, ZA23, ZA24, ZB24, and ZB25 were located in the ecological source areas in the three timelines, which represented the most critical areas of material circulation and energy flow in the ecosystem and the areas that were highly susceptible to ecological problems (Chen, 2020). Therefore, they should be used for maintaining the local ecological security and sustainable development (Yang et al., 2017), so these tower bases need to be protected with priority.
The Fujian Tangyuan PTL project started in December 2019 and ended in September 2020. Based on the research results of this study, the peak period of the construction disturbance was from Dec. 2019 to Sep. 2020, when the JA1-JA6, JA8-JA11, ZA1-ZA7, ZA9, ZA11-ZA32, JB1-JB3, JB8-JB11, ZB1-ZB7, ZB11-ZB34, JZA31 and JZB31 tower bases and their surrounding roads should be of great concern. After construction, the ecological restoration should be monitored and checked.

4.4 Scale of the PTL impact on ESP

The impacts of PTL on ESP at the regional scale and the buffer area scale are shown in Table 4. Compared with the ESP before PTL construction in 2019, the changes in the ecological “source-corridor-node” parameters were -l7.05%, -7.31% and -26.79%, respectively, in 2020 at regional scale; while at the local scale, the corresponding changes were -31.02%, -12.64% and 30.77%, respectively. In 2021, the changes of the ecological “source-corridor-node” parameters were -0.75%, 10.17% and 35.11%, respectively, at regional scale; while the corresponding changes at the local scale were -24.89%, 32.30% and 92.31%, respectively. Meanwhile the ESPs at both spatial scales were spatially displaced in 2020 and 2021. The impact of PTL on ESP was more obvious and sensitive at the local scale, so this scale would be suggested as the preferable spatial scope of ecological assessments for PTL projects. Regarding the aspect of ecological restoration of PTL projects, the ecological source area at the local scale should be seriously considered after the construction.
Table 4 Comparing the impacts of the PTL project on ESPs at two spatial scales
Timeline Parameter Spatial scale
Regional scale
(Growth rate compared to pre-construction)
Local scale (Buffer area)
(Growth rate compared to pre-construction)
Pre-construction (2019) Ecological source (km2) 465.66 39.78
Ecological corridor (km) 566.44 50.78
Ecological node (piece) 168 13
Under construction (2020) Ecological source (km2) 386.27 (‒17.05%) 27.44 (‒31.02%)
Ecological corridor (km) 525.04 (‒7.31%) 44.36 (‒12.64%)
Ecological node (piece) 123 (‒26.79%) 17 (+30.77%)
After construction (2021) Ecological source (km2) 462.18 (‒0.75%) 29.88 (‒24.89%)
Ecological corridor (km) 624.02 (+10.17%) 67.18 (+32.30%)
Ecological node (piece) 227 (+35.11%) 25 (+92.31%)

5 Conclusions

Based on MSPA, the MCR model and the gravity model, this study examined the ESP with the ecological “source- corridor-node” in the area where Fujian Tangyuan PTL was constructed, and the changes in ESP at both regional and local scales caused by building the PTL were analyzed. The conclusions of this study are threefold.
(1) Changes of the ESP at the regional scale
During construction, the ecological resource space and corridors gradually moved westward. In 2019, the ecological “source-corridor-node” parameters were 465.66 km2, 566.44 km, and 168 respectively, while in 2020, they were 386.27 km2 (-17.05%), 525.04 km (-7.31%), and 123 (-26.79%), respectively. The corresponding figures in 2021 were 462.18 km2 (-0.75%), 624.02 km (+10.17%), and 227 (+35.11%). Therefore, one conclusion is that ESP might be restored after the end of PTL construction at the regional scale.
(2) Changes of the ESP at the local scale
In 2019, the ecological “source-corridor-node” parameters were 39.78 km2, 50.78 km, and 13 in 2019; while they were 27.44 km2 (-31.02%), 44.36 km (-12.64%), and 17 (+30.77%) in 2020; and they were 29.88 km2 (-24.89%), 67.18 km (+32.30%), and 25 (+92.31%) in 2021, respectively. The ESP indicated a reduction in the ecological source areas. The ecological corridors and nodes showed restoration after the construction.
(3) The buffer area shoulde be regular monitored
The results also suggested that a 2 km buffer area along PTL should be used as the spatial scope of the ecological assessment for PTL projects. After building a PTL, the ecological source sites in the buffer area will require regular monitoring until complete restoration.
Regarding the selection of ecological expansion resistance factors, seven factors were selected in this study, which may not be enough for the ESP in a region. Other economic and social factors should also be considered as the ecological expansion resistance factors. In the study area, the change of ESP was calculated while ignoring the impacts of other activities in the same region at the same time.
[1]
Ai J W, Yu K Y, Huang R X, et al. 2023. The impact of wind power projects on potential ecological corridors based on the MSPA-MCR Model. Acta Ecologica Sinica, 43(9): 3665-3676. (in Chinese)

[2]
Chen G M. 2020. Research on spatial-temporal evolution characteristics and ecological security pattern of land-use in Panxi Region: A case study of Huili County. Diss., Chengdu, China: Chengdu University of Technology. (in Chinese)

[3]
Chen Q, Liu P H, Zhu C M. 2022. Construction of an ecological security structure in Fuzhou City of Jiangxi Provicne based on an MCR model. Bulletin of Soil and Water Conservation, 42(2): 210-218. (in Chinese)

[4]
Ding M M, Liu W, Xiao L, et al. 2022. Construction and optimization strategy of ecological security pattern in a rapidly urbanizing region: A case study in central-south China. Ecological Indicators, 136: 108604. DOI: 10.1016/j.ecolind.2022.108604.

[5]
Feng B O, Yue W Z, Xia H X. 2022. Evaluation of ecological conservation red line from the perspective of ecological security pattern: Taking Zhejiang Province, China as an example. Chinese Journal of Applied Ecology, 33(9): 2466-2474. (in Chinese)

DOI

[6]
Forman R T, Baudry J. 1984. Hedgerows and hedgerow networks in landscape ecology. Environmental Management, 8(6): 495-510.

DOI

[7]
Fu B J. 2010. Trends and priority areas in ecosystem research of China. Geographical Research, 29(3): 383-396. (in Chinese)

DOI

[8]
Guo J X, Hu Z Q, Li H X, et al. 2021. Construction of municipal ecological space network based on MCR model. Transactions of the Chinese Society for Agricultural Machinery, 52(3): 275-284. (in Chinese)

[9]
Li R. 2020. Study on the landscape security pattern using MSPA and MCR models in the upstream of Nenjiang River. Diss., Harbin, China: Harbin Normal University. (in Chinese)

[10]
Li Z Y, Yang G S, Dong Y W. 2007. Establishing the ecological security pattern in rapidly developing regions—A case in the AYRAP. Journal of Natural Resources, 22(1): 106-113. (in Chinese)

[11]
Liu J L, Li S P, Fan S L, et al. 2021. Identification of territorial ecological protection and restoration areas and early warning places based on ecological security pattern: A case study in Xiamen-Zhangzhou-Quanzhou Region. Acta Ecologica Sinica, 41(20): 8124-8134. (in Chinese)

[12]
Liu X F, Shu J M, Zhang L B. 2010. Research on applying minimal cumulative resistance model in urban land ecological suitability assessment: As an example of Xiamen City. Acta Ecologica Sinica, 30(2): 421-428. (in Chinese)

[13]
Ma K M, Fu B J, Li X Y, et al. 2004. The regional pattern for ecological security (RPES) : The concept and theoretical basis. Acta Ecologica Sinica, 24(4): 761-768. (in Chinese)

[14]
Ministry of Ecology and Environment of China. 2022. Technical guidelines for environmental impact assessment ecological impact:HJ 19-2022. Beijing, China: China Environmental Science Press. (in Chinese)

[15]
Qin Z B, Xuan J, Huang L J, et al. 2023. Ecological network construction of sea-island city based on MSPA and MCR model—A case study of Pingtan Island in Fujian Province. Research of Soil and Water Conservation, 30(2): 303-311. (in Chinese)

[16]
Sun P L. 2017. Temporal and spatial evolution of land use conflicts in the poverty belt around Beijing and Tianjin from the perspective of ecological security. Diss., Beijing, China: China Agricultural University. (in Chinese)

[17]
Tan H Q, Zhang J L, Zhou X S. 2020. Construction of ecological security patterns based on minimum cumulative resistance model in Nanjing City. Bulletin of Soil and Water Conservation, 40(3): 282-288, 296, 325. (in Chinese)

[18]
Wang Z Y, Luo K Y, Zhao Y H, et al. 2022. Modelling regional ecological security pattern and restoration priorities after long-term intensive open-pit coal mining. Science of the Total Environment, 835: 155491. DOI: 10.1016/j.scitotenv.2022.155491.

[19]
Xu F, Yi H W, Kong F H, et al. 2015. Developing ecological networks based on mspa and the least-cost path method: A case study in bazhong western new district. Acta Ecologica Sinica, 35(19): 6425-6434. (in Chinese)

[20]
Yang R L, Bai Z K, Shi Z Y. 2021. Linking morphological spatial pattern analysis and circuit theory to identify ecological security pattern in the loess plateau: Taking Shuozhou City as an example. Land, 10(9): 907. DOI: 10.3390/land10090907.

[21]
Yang T R, Kuang W H, Liu W D, et al. 2017. Optimizing the layout of eco-spatial structure in Guanzhong urban agglomeration based on the ecological security pattern. Geographical Research, 36(3): 441-452. (in Chinese)

DOI

[22]
Yang X C, Li S N, Zhu C M, et al. 2022. Simulating urban expansion based on ecological security pattern—A case study of Hangzhou, China. International Journal of Environmental Research and Public Health, 19(1): 301. DOI: 10.3390/ijerph19010301.

[23]
Yao C Y, An R, Dou C, et al. 2022. Research on construction and evaluation of forest land ecological network in Three Gorges Reservoir Area based on MSPA and MCR model. Resources and Environment in the Yangtze Basin, 31(9): 1953-1962. (in Chinese)

[24]
Yu K J. 1999. Landscape ecological security pattern of biological conservation. Acta Ecologica Sinica, 19(1): 8-15. (in Chinese)

[25]
Zhang Y X, Wei H, Na J M, et al. 2021. Construction of urban ecological security pattern based on MCR model: A case study of Pingliang City, Gansu Province. Journal of Nanjing Normal University (Natural Science Edition), 44(3): 54-62. (in Chinese)

[26]
Zhao Y H, Luo Y H, Yi T Y, et al. 2022. Constructing an ecological security pattern in Shenzhen, China, by matching the supply and demand of ecosystem services. Chinese Journal of Applied Ecology, 33(9): 2475-2484. (in Chinese)

DOI

Outlines

/