Impact of Human Activities on Ecosystem

Resource and Environmental Carrying Capacity Assessment in Earthquake-prone Area—Taking the Luding Earthquake Disaster as an Example

  • LIU Jiazhuo , 1, 2 ,
  • WANG Juanle , 2, 3, 4, * ,
  • LI Kai 2, 3
Expand
  • 1. School of Earth Science and Surveying and Mapping Engineering, China University of Mining & Technology (Beijing), Beijing 100083, China
  • 2. State Key Laboratory of Resources and Environmental Information System, Institute of Geographic Sciences and Natural Resources Research, Chinese Academy of Sciences, Beijing 100101, China
  • 3. University of Chinese Academy of Sciences, Beijing 101408, China
  • 4. Jiangsu Center for Collaborative Innovation in Geographical Information Resource Development and Application, Nanjing 210023, China
*WANG Juanle, E-mail:

Received date: 2023-08-06

  Accepted date: 2023-10-08

  Online published: 2023-12-27

Supported by

The Construction Project of China Knowledge Centre for Engineering Sciences and Technology(CKCEST-2022-1-41)

Abstract

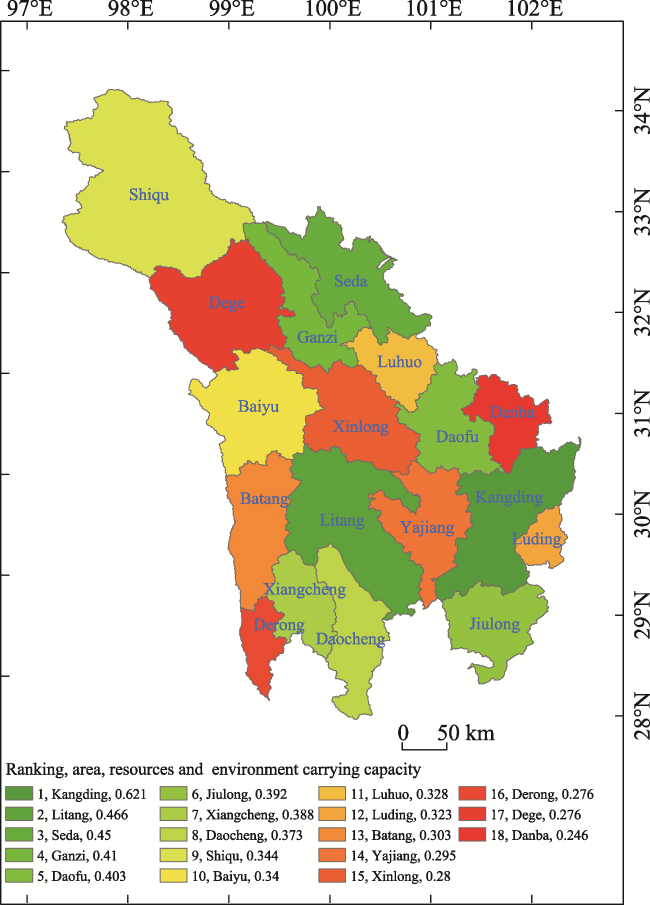
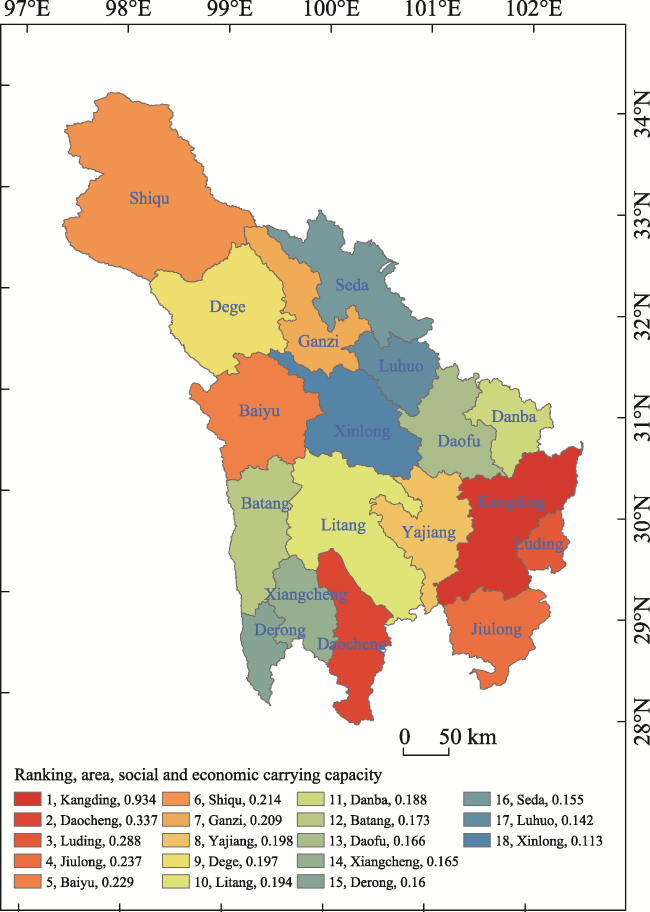
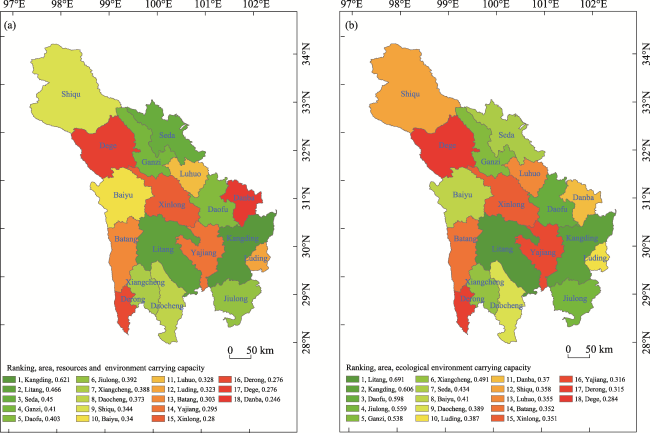
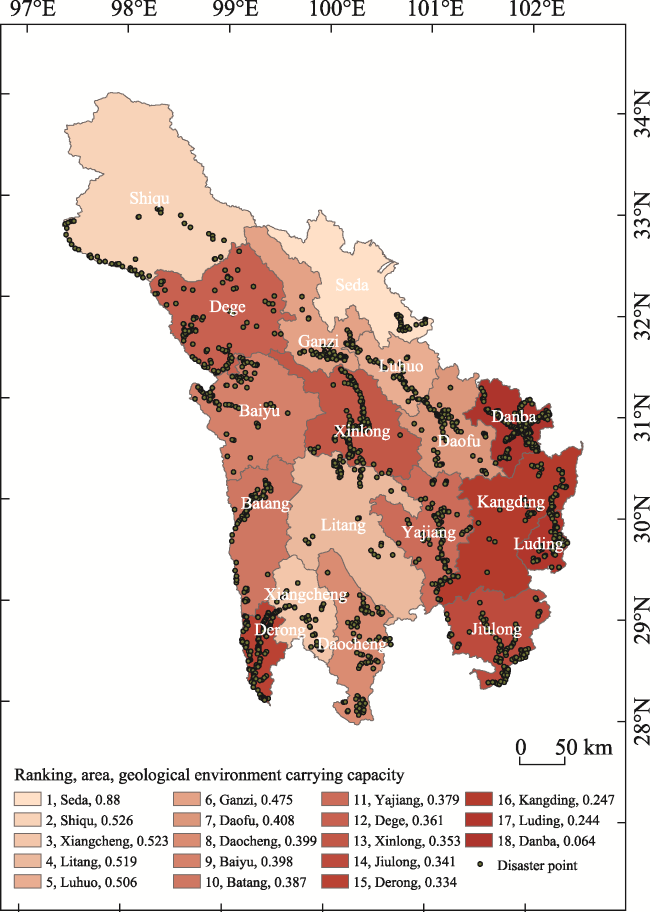
Earthquakes are one of the major natural disaster threats worldwide and directly cause substantial economic losses and many casualties every year. Research on the resource and environmental carrying capacity in earthquake-prone areas is urgently required for regional earthquake relief efforts and post-disaster reconstruction. This study considered Ganzi Tibetan Autonomous Prefecture (Ganzi Prefecture) in Sichuan Province, China, focusing on the impact of the Luding 6.8 Magnitude Earthquake in Ganzi Prefecture in 2022. An evaluation system for the resource and environmental carrying capacity of earthquake-prone areas was established. A total of 23 indicators were selected that cover ecological, social economical, and geological aspects, and the weight of each index was determined by the Analytic Hierarchy Process. The relative ranking of the resource and environmental carrying capacities of each county and city were calculated using the weighted Technique for Order Preference by Similarity to Ideal Solution (TOPSIS). Consequently, the post-disaster reconstruction strategy of Ganzi Prefecture was evaluated and analyzed. The results show that the resource and environmental carrying capacities of each administrative area differ regionally. Evidence shows that the resource and environmental carrying capacity in southeastern Ganzi Prefecture is generally higher than in the northwest, owing to the joint influence of the social economy and ecological and geological environment. This study provides carrying capacity assessment data and support methods for earthquake-prone areas.

Cite this article

LIU Jiazhuo , WANG Juanle , LI Kai . Resource and Environmental Carrying Capacity Assessment in Earthquake-prone Area—Taking the Luding Earthquake Disaster as an Example[J]. Journal of Resources and Ecology, 2024 , 15(1) : 161 -172 . DOI: 10.5814/j.issn.1674-764x.2024.01.014

1 Introduction

Earthquakes are a major natural disaster threat worldwide. According to EM Data database statistics, 1333 earthquakes of magnitude 4 and above have occurred since 1950 (EM- DAT, 2023). The countries with the most earthquakes include China, Indonesia, Iceland, Japan, Turkey, and the United States. Earthquakes directly cause economic losses of billions of dollars and numerous casualties every year. According to UN News, more than 23 million people were affected by earthquakes in Turkey and Syria in 2023, leaving millions of victims homeless (UN News, 2023). The earthquake in Haiti in 2010 caused more than 220000 deaths and 360000 injuries, destroying 100000 houses (UN News, 2010). Approximately 80000 people suffered from the Wenchuan earthquake in 2008, and the estimated economic loss reached 800 billion yuan (UN News, 2008). Earthquakes continue to threaten the safety of human life and property worldwide.
China is one of the most vulnerable countries to earthquake disasters. On September 5, 2022, a 6.8 magnitude earthquake occurred in Luding, Ganzi Tibetan Autonomous Prefecture (hereafter referred to as Ganzi or Ganzi Prefecture) in Shichuan Province, which induced multiple secondary disasters such as landslides, collapses, and barrier lakes, and resulted in serious casualties and property losses. In China, this was one of the top ten natural disasters in 2022 according to the Ministry of Emergency Management of China. The Emergency Management Department of Sichuan Province reported that the Luding earthquake affected a total of 548000 people in the Ya’an, Ganzi and Liangshan Prefectures. A total of 117 people were killed or missing, and the direct economic loss was 15.48 billion yuan. It was the largest earthquake in Sichuan Province since 2013. Ganzi Prefecture is one of the main earthquake-prone areas in China. After the Wenchuan earthquake on May 12, 2008 and the Ya’an Lushan earthquake on April 20, 2013, the geological environment of Ganzi Prefecture has become more fragile (Fan et al., 2022). Geological disaster points have spread across the region, and low-magnitude earthquakes occur frequently. Therefore, strengthening research on the resource and environmental carrying capacity in this ethnic group and these earthquake-prone areas is of great practical significance.
The resource and environmental carrying capacity refers to the ability of the resource and environmental systems to bear various social and economic activities while meeting the developmental needs and the relative stability of functions within a certain region (Wang et al., 2019; Wang et al., 2020; Qi et al., 2022). Research on resource and environmental carrying capacity evaluation has a developmental history in China that can be traced back to 1988 (Dang and Peng, 1988). Domestic research on resource and environmental carrying capacity has developed from single-factor evaluation to multi-factor and dynamic integrated evaluation, which are now more pluralistic and comprehensive than those of past years (Wang et al., 2019; Wang et al., 2020; Qi et al., 2022). Common evaluation methods for resource and environmental carrying capacity include the index system, footprint, and classical statistical methods (Zhang et al., 2018; Hsu et al., 2021). The analysis of the resource and environmental carrying capacity of areas prone to geological disasters is complex and involves a multidisciplinary approach (Zhou et al., 2021).
Scholars have studied the Du-Wen Road in the Wenchuan earthquake area and analyzed the highway from the ecological, earthquake, and social economy aspects based on the resource and environmental carrying capacity (Wang et al., 2020). Xu and Hu (2020) proposed a method that distinguishes the boundaries of geological disaster investigation areas, established a scientific monitoring system for different geological disasters based on geological environmental carrying capacity research, and further proposed related geological disaster prevention and mitigation strategies. Yu (2021) evaluated the geological environmental carrying capacity of the disaster-forming environment of sediment flows and found a correlation between the geological environment and landslide disasters. Xie (2019) established an evaluation model for resource and environmental carrying capacity that combines individual and comprehensive evaluations, while Wang et al. (2018) proposed quantitative standards based on a general survey of geographical conditions. As important factors for measuring regional stability, social and economic factors appear frequently in research on resource and environmental carrying capacity. The aforementioned studies constructed evaluation systems with regional characteristics and enriched the research on the resource and environmental carrying capacity of geological disaster stricken areas.
However, developing a mature, complete, and comprehensive model is difficult because of the various physical geographical disaster-forming environments in each study area, coupled with different evaluation factors in the carrying capacity models. Thus, additional studies are required to evaluate the carrying capacity of resources and the environment in earthquake-prone areas. In addition, factors related to various secondary disasters that may be caused by earthquakes, such as soil erosion, are usually not considered within the scope of carrying capacity assessments. Thus, the existing resource and environmental carrying capacity evaluation systems contain certain deficiencies when applied in earthquake-prone areas with complex disaster chains.
Therefore, this study proposed an improved resource and environmental carrying capacity assessment method for use in earthquake-prone areas. This study had three goals. The first was to quantify the impacts of earthquakes. The second goal was to study the correlation between the quality of the carrying capacity and the spatial distribution of resource and environmental carrying capacity. The third goal was to explore possible strategies for the reconstruction of disaster stricken areas based on the regional assessment of resource and environmental carrying capacity. The results of this study are expected to provide a reference for the resource and environmental carrying capacity assessments of other earthquake-prone regions around the world.

2 Research areas and data sources

2.1 Research area

The study took Ganzi Prefecture in Sichuan Province in China as the research area, within 27°58ʹN-34°20ʹN, 97°22ʹE-102°29ʹE. Ganzi Prefecture is located in the transitional zone between the first and second steps in China’s three-level landform pattern. It belongs to the western Sichuan alpine plateau area in the northern part of the Hengduan Mountains, between the Yunnan and Guizhou Plateau and the Sichuan Basin. Various ethnic minority groups inhabit this area. It borders the Aba Tibetan and Qiang Autonomous Prefecture and Ya’an City in the east, Liangshan Yi and Yunnan Diqing Tibetan Autonomous Prefecture in the south, the Tibet Autonomous Region along the Jinsha River in the west, and the Yushu Tibetan and Goluo Tibetan Autonomous Prefectures in Qinghai Province in the north. The state’s administrative area is approximately 153000 km2. The geographical location of the study area is shown in Fig. 1.
Fig. 1 Research area map and elevation data

2.2 Data indicators and data sources

Two types of data sources were used in this study. One is the official statistics compilation released by the People’s Government of Ganzi Prefecture, including the 2021 Ganzi Statistical Yearbook and 2021 Ganzi Prefecture Water Resources Bulletin (Garze Prefecture Bureau of Statistics, 2021). The other is spatial data, including land cover data from the China Geological Survey, a digital elevation model from the China National Qinghai-Tibet Plateau Data Center, meteorological data from Ganzi Prefecture Meteorological Bureau, and geological disaster points in the region collected from the China Earthquake Administration. Based on the collected data, 23 indicators were selected for evaluation from three aspects: Social and economic, ecological, and the geological environment (Song et al., 2016; Wang et al., 2019; Wang et al., 2020). The Analytic Hierarchy Process (AHP) was used to determine the weights of the evaluation indices. The weighted technique for Order Preference by Similarity to Ideal Solution (TOPSIS) method was used to calculate the relative strengths and weaknesses of the resource and environmental carrying capacity. Based on the calculated results, the resource and environmental carrying capacities of each administrative region were ranked and the post-disaster reconstruction strategy of Ganzi Prefecture was analyzed according to the results. The evaluation system and indicators are provided in Table 1.
Table 1 Evaluation system for resource and environmental carrying capacity in Ganzi Prefecture
Level 1 indicator Level 2 indicator Level 3 indicator Weight
Social economy (0.223) Population (0.077) Total resident population 0.033
Population density 0.044
Economy (0.081) Disposable income per capita 0.026
GDP per capita 0.024
Ratio of the total value of the secondary and tertiary industries to gross domestic product 0.031
Infrastructure (0.065) Water supply penetration rate 0.016
Gas penetration rate 0.013
Electricity production 0.017
Green coverage rate of built-up areas 0.006
Urbanization level 0.013
Ecological environment (0.476) Land (0.088) Per capita arable land area 0.038
Size of the built-up area 0.050
Water resources (0.125) Per capita water resources 0.071
Annual rainfall 0.054
Environmental quality (0.113) Per capita green area 0.040
Normalized Difference Vegetation Index 0.054
Annual average temperature 0.019
Primary industry (0.149) Gross output value of the primary industry 0.149
Geological environment (0.301) Topography (0.120) Average slope 0.025
Mean elevation 0.039
Soil erosion severity 0.056
Geological disaster (0.181) Number of disaster points 0.082
Earthquake intensity (Luding Earthquake) 0.099

3 Methods

3.1 Weight determination of resource and environmental carrying capacity in earthquake-prone areas based on AHP

This study used the AHP to calculate the index weights of each layer. Several experts in related fields were invited to evaluate the importance of various indicators through a questionnaire. The one through nine scale method was used to evaluate the importance levels of the indicators. This is discussed in detail in the following section. Some indicators were strengthened based on the evaluation results, including the per capita cultivated land area, per capita water resources, and total output value of agriculture, forestry, animal husbandry, and fisheries. These indicators are more aligned with the environment of Ganzi Prefecture, and their importance levels were increased by one level. Some indicators were weakened, including the area of built-up areas, level of urbanization, and greening of built-up areas. Their importance levels were reduced by one level. Finally, the weight of each indicator was determined by taking the average value from the expert questionnaires.
The AHP is a multi-criterion decision-making method for quantitative analysis proposed by Satty in the 1970s (Saaty, 1990). It is widely used in various fields related to the social economy owing to its combination of qualitative and quantitative processing methods, and its practicability. This is particularly true of urban disasters, economic management, and traffic safety. The basic principle of the AHP is to divide complex decision-making problems into systematic and interrelated levels according to their affiliated relationships. The importance of different factors in the same level are compared with methods such as the one through nine scale method. We established a judgment matrix and calculated it to obtain a hierarchical single ranking. Consequently, a consistency check was conducted. After passing this check, the weights of each layer were transferred from the bottom to the top layer-by-layer to obtain the total layer ranking. Finally, the calculation results were analyzed (Chai and Ngai, 2021).
The calculation steps are as follows.
The first step was to use the one through nine scale method to determine the scale of each indicator and construct a judgment matrix. The judgment matrix is given as:
$A=\left[ \begin{matrix} {{a}_{11}} & {{a}_{12}} & \cdots & {{a}_{1j}} \\ {{a}_{21}} & {{a}_{22}} & \cdots & {{a}_{2j}} \\ \vdots & \vdots & \ddots & \vdots \\ {{a}_{i1}} & {{a}_{i2}} & \cdots & {{a}_{ij}} \\ \end{matrix} \right]$
where aij represents the weight ratio of the i-th evaluation index to the j-th evaluation index, and ${{a}_{ij}}={{{\omega }'}_{i}}:{{{\omega }'}_{j}}$. Table 2 presents the scale values and their meanings.
Table 2 Scale values and their meanings
Relative importance level The score of aij
Evaluation index ai is equally important to aj 1
Evaluation index ai is slightly more important than aj 3
Evaluation index ai is more important than aj 5
Evaluation index ai is obviously more important than aj 7
Evaluation index ai is extremely important relative to aj 9

Note: Here, the score values of 2, 4, 6, 8 and other double numbers indicate the intermediate degrees between the different importance levels.

The second step involved conducting a consistency check. The relative weights of the evaluation indices were calculated using the judgment matrix. For example, if the weight value of index b was twice that of index a, and the weight value of index c was twice that of b, then the weight value of index c should be four times that of a. However, there may be inconsistent exceptions in the actual calculations. In real situations, the judgment matrix may be inconsistent within a certain range. Then, the consistency index was calculated as:
$CI=\frac{\lambda -n}{n-1}$
where λ represents the largest characteristic root of the judgment matrix and n represents the order of the judgment matrix. When CI=0, the judgment matrix is completely consistent. When the value of CI is larger, the inconsistency is more severe.
AHP defines a random index RI to measure the value of CI. It randomly constructs n(n+1)/2 independent n-order judgment matrices, and the sample mean value of CI is taken as the value of RI. The value of RI is related to the order of the judgment matrix, and some values are shown in the Table 3.
Table 3 Value table of random consistency index RI
n 1 2 3 4 5 6 7 8 9 10
RI 0.00 0.00 0.58 0.90 1.12 1.24 1.32 1.41 1.45 1.49
When the order of the judgment matrix is less than or equal to two, the judgment matrix is always completely consistent. When the order is greater than two, the consistency ratio index CR can be calculated as follows:
$CR=\frac{CI}{RI}$
When the value of CR is less than 0.1, the consistency of the judgment matrix is considered acceptable. However, when the value is excessively large, the values in the judgment matrix must be modified (Abdel-Basset et al., 2017).

3.2 Evaluation of resource and environmental carrying capacity in earthquake-prone areas based on the TOPSIS method

The TOPSIS method is a multifaceted decision-making method that was first proposed by Hwang and Yoon in 1981. Two ideal objects exist in the TOPSIS method. The first is the ideal object of affirmation, also known as an optimal solution. The second is the ideal object of negation, also known as the worst solution. The TOPSIS method ranks a limited number of evaluation objects based on their similarity to the idealized objects (Zytoon, 2020), and the calculation method is as follows.
In this example, it is assumed that$A=\left\{ {{A}_{1}},{{A}_{2}},{{A}_{3}},\cdots,{{A}_{m}} \right\}$ in the program layer of the ecological livability evaluation system, with m evaluated areas. The index layer includes $I=\left\{ {{I}_{1}},{{I}_{2}},{{I}_{3}},\cdots,{{I}_{n}} \right\}$with n evaluation indicators. M= $\left\{ 1,2,\cdots,m \right\}$ and $N=\left\{ 1,2,\cdots,n \right\}$are recorded, the original data is set as $X={{\left( {{x}_{ij}} \right)}_{m\times n}}$, and the initial matrix is established. xij is the data value under the j-th index of the i-th evaluated area, where iM, jN.
The first step was to ensure the isotonicity of the variables. Positive and negative indicators were present among the evaluation indicators in this study. However, the TOPSIS method can only handle indicators with the same trend. Therefore, processing the indicators to ensure that they shared the same trend was necessary. Two processing methods are available for this purpose. Excellent indicators are typically converted into low-quality indicators. Another method is to turn reverse indicators into positive indicators. The first method was chosen for this study, and the reciprocal method was adopted to perform the same-trend processing. This can be calculated by using ${{{x}'}_{ij}}=1/{{x}_{ij}}$.
The second step was normalization. Different evaluation indicators may have different units and dimensions; therefore, the data must be normalized. If the original indicator is positive, then the indicator conversion formula is as follows:
${{b}_{ij}}={{x}_{ij}}/\sqrt{\sum\limits_{i=1}^{n}{x_{ij}^{2}}}$
If the original indicator is negative, the indicator conversion formula is as follows:
${{b}_{ij}}={{{x}'}_{ij}}/\sqrt{\sum\limits_{i=1}^{n}{{{\left( {{{{x}'}}_{ij}} \right)}^{2}}}}$
In Equations (4) and (5), xij represents the value of the j-th evaluation index in the i-th area when the original evaluation index is positive; and ij is the reciprocal of the j-th evaluation index in the i-th area when the original evaluation index is negative. In most studies, the value of the evaluation index is negative. Therefore, the above normalization method makes the normalized negative value equal to a positive value. However, this is not reasonable, so adjusting the normalization method was necessary. When the original evaluation index is positive, the commonly used formula is as follows:
${{b}_{ij}}=\left( {{x}_{ij}}-{{x}_{\min }} \right)/\left( {{x}_{\max }}-{{x}_{\min }} \right)$
When the original evaluation index is negative, the commonly used formula is as follows:
${{b}_{ij}}=\left( {{x}_{\max }}-{{x}_{ij}} \right)/\left( {{x}_{\max }}-{{x}_{\min }} \right)$
In Equations (6) and (7), xmin represents the minimum value of the j-th index in all evaluated areas, and xmax represents the maximum value of the j-th index in all evaluated areas. However, in this study, there were no cases in which the original evaluation index was a reverse index or contained negative numbers. Therefore, this situation is not illustrated here.
After normalization, the matrix is as follows:
$B=\left[ \begin{matrix} {{b}_{11}} & {{b}_{12}} & \cdots & {{b}_{1n}} \\ {{b}_{21}} & {{b}_{22}} & \cdots & {{b}_{2n}} \\ \vdots & \vdots & \ddots & \vdots \\ {{b}_{m1}} & {{b}_{m2}} & \cdots & {{b}_{mn}} \\ \end{matrix} \right]$
The third step was to compute the optimal and worst value vectors according to matrix (8). The following are the optimal solution B+ and worst solution B- according to the existing values:
${{B}^{+}}=\left[ \begin{matrix} b_{i1}^{+} & b_{i2}^{+} & \cdots & b_{in}^{+} \\ \end{matrix} \right]$
${{B}^{-}}=\left[ \begin{matrix} b_{i1}^{-} & b_{i2}^{-} & \cdots & b_{in}^{-} \\ \end{matrix} \right]$
In Equations (9) and (10), bin+ represents the normalized maximum value of the m-th evaluation index among all evaluated areas, and it is also the value closest to 1. bin- represents the minimum value after normalization of the m-th evaluation index among all the evaluated areas, and it is the value closest to 0.
The fourth step was to calculate the weighted distances between each index value of the evaluated areas and both the optimal solution $D_{i}^{+}$ and the worst solution $D_{i}^{-}$:
$D_{i}^{+}=\sqrt{\sum\limits_{j=1}^{n}{{{\omega }_{j}}{{\left( b_{ij}^{+}-{{b}_{ij}} \right)}^{2}}}}$
$D_{i}^{-}=\sqrt{\sum\limits_{j=1}^{n}{{{\omega }_{j}}{{\left( b_{ij}^{-}-{{b}_{ij}} \right)}^{2}}}}$
In Equations (11) and (12), $D_{i}^{+}$ represents the similarity between the i-th area and the optimal solution, while $D_{i}^{-}$
represents the similarity between the i-th area and the worst solution. ωj represents the weight coefficient of the j-th index determined by the AHP.
The fifth step was to calculate the proximity of each area to the optimal solution. The formula used was:
${{C}_{i}}=\frac{D_{i}^{-}}{D_{i}^{+}+D_{i}^{-}}$
where Ci represents the proximity of each city to the optimal solution, with a value between 0 and 1. When the value is closer to 1, the evaluation object is closer to the optimal solution. When the value is closer to zero, the evaluation object is closer to the worst solution.
The last step was to rank the evaluated areas according to the Ci values from high to low. When the value of Ci is larger, the resource and environmental carrying capacity of the area is higher.
TOPSIS was used for the assessment of resource and environmental carrying capacity and its various directional carrying capacities, including the social and economic carrying capacity, the ecological environmental carrying capacity, and the geological environmental carrying capacity.

4 Results and analysis

The resource and environmental carrying capacities of Ganzi Prefecture were calculated based on the weighted TOPSIS method. The spatial distribution is shown in Fig. 2. The resource and environmental carrying capacity of Ganzi Prefecture presents a general geographical pattern with high values in the east and south, and low values in the west and north. Kangding, as the government-resident city of Ganzi Prefecture, clearly has a higher resource and environmental carrying capacity than the other cities in Ganzi Prefecture. In addition, the resource and environmental carrying capacities of some other cities, including Litang, Seda, Ganzi, Daofu, Jiulong, Xiangcheng, Daocheng and Shiqu, are at the upper-middle level compared with Kangding City. However, Baiyu, Luhuo, Luding, Batang, Yajiang, Xinlong, Derong, Dege, and Danba have relatively low resource and environmental carrying capacities, so they require a great deal of attention. The causes of the geographical differences in resource and environmental carrying capacity are diverse and complex. The factors related to social economy, ecological environment, and geological environment were further analyzed to discover the possible links between indicators with high rankings. The problems that may be present in the different cities were explored, and the corresponding improvement measures were discussed (Zeng and Xiao, 2018).
Fig. 2 Evaluation map of resource and environmental carrying capacity in Ganzi Prefecture

4.1 Analysis of the social and economic carrying capacity in Ganzi Prefecture

Social and economic carrying capacities can reflect the economic development and social stability of each city in a given period. It is also an important indicator of a city’s disaster reconstruction capability. Figure 3 shows the spatial distribution of the social and economic carrying capacities in Ganzi Prefecture. The map shows that the carrying capacities of cities in the northwestern and southeastern regions are generally higher than those of cities in the southwestern and northeastern regions.
Fig. 3 Map of the social and economic carrying capacity in Ganzi Prefecture
Through the analysis of various social and economic criterion indicators, this study found that cities whose social and economic carrying capacity assessments rank low are generally also low in terms of population index data. An objective economic law states that populations flow to areas with high economic levels and cities with high-quality public services (Aksoy and Ercanoglu, 2007; Zhang et al., 2020). However, since Ganzi Prefecture is a remote location, attracting a large number of people to Ganzi Prefecture is difficult. To improve its social and economic carrying capacity, Ganzi Prefecture would need to firstly improve the transportation and educational systems.
In terms of transportation facilities, the highways, railways, and airport are the keys because of Ganzi Prefecture’s geographical characteristics. As of 2021, the total mileage of highways in Ganzi Prefecture was 32860.43 km according to the 2021 Ganzi Statistical Yearbook and Sichuan Provincial Statistical Yearbook. Township and village roads account for 70.89%. However, no national or provincial roads in Derong were included in in the data mentioned above. In addition, the total mileage of expressways in Ganzi Prefecture is only 45 km, and it ranks lowest compared with the regions of the same level in Sichuan Province. Aba Tibetan and Qiang and Liangshan Yi Autonomous Prefectures performed slightly better than Ganzi Prefecture in terms of highway mileage, with values of 221 and 218 km, respectively. Their mileages are approximately four times that of Ganzi Prefecture. Therefore, the focus of transportation facilities in Ganzi Prefecture must shift to high-level and high-quality road construction. Transport systems play important roles in promoting economic and social development and solving unbalanced development.
In terms of railway construction, Ganzi Prefecture must actively promote the construction of the Sichuan-Tibet railway, which is a fast railway connecting Sichuan Province to the Tibet Autonomous Region. It runs east to west, starting from Chengdu, Sichuan Province in the east and ending in Lasa, Tibet Autonomous Region in the west. It is China’s second railway to Tibet and also one of the main lines of transportation in Southwest China. The Sichuan-Tibet Railway is of great significance to Ganzi Prefecture, as it will be the first railway in Ganzi Prefecture and an important channel for economic exchange between the Ganzi Tibetan region and the entire province when it is completed. In terms of airport construction, a high-level transportation network centered around the Golden Triangle Airport should be built, and the high-quality development of the region should be promoted. The prefecture has three 4C-level airports: Ganzi Gesar Airport, Kangding Airport, and Daocheng Yading Airport. It is the only city in China with three branch airports above an altitude of 4000 m. Therefore, creating corresponding tourist routes around the airports to promote tourism development should be considered. This would not only provide huge transportation support for the development of tourism in Ganzi Prefecture, but also attract new sources of investment for the relatively remote cities nearby, such as Derong. However, geographical constraints make it difficult for Ganzi State airports to provide landing conditions for large passenger aircraft.
As the largest city and prefecture in Sichuan Province, Ganzi Prefecture covers an area of approximately 153000 km2. This is ten times larger than the provincial capital city, Chengdu. However, as of 2021, there were only 354 primary schools and 49 middle schools in Ganzi Prefecture. The education level in Ganzi Prefecture is considered relatively low compared to the entire province. Educational resources are unevenly distributed throughout the state and are mainly concentrated in Kangding, Ganzi, Luding, and the surrounding areas. Three effective ways to improve the social and economic carrying capacity may be applied to education. The first involves balancing the development of education. Second, educational development should be prioritized. Finally, investments in education must be increased and the construction of educational facilities must be promoted. In addition, vigorously implementing the talent introduction policy will contribute to the rapid development of social endeavors in Ganzi Prefecture. The inability to attract and retain talent has always been a problem in Ganzi Prefecture, so Ganzi Prefecture should attempt to relax the occupational age limit for corresponding positions and improve the treatment of talent introduction. Additionally, the implementation of targeted training and recruitment may be beneficial.

4.2 Analysis of the ecological environmental carrying capacity in Ganzi Prefecture

The ecological environment is the sum of various natural forces and functions that affect human life and production. It is not only closely related to the sustainable development of human society and the economy, but is also an indispensable and important indicator for the resource and environmental carrying capacity of the region. The results of our analysis show that the regional distribution characteristics of the environmental and comprehensive carrying capacities are highly similar, as shown in Fig. 4. These similarities imply that the two may have a close relationship. Some previous studies have also pointed out that the ecological environment is a key component of resource and environmental carrying capacity (Wu et al., 2021).
Fig. 4 Comparison of the overall environment and ecological environment in Ganzi Prefecture. (a) Distribution of resource and environmental carrying capacity; (b) distribution of regional ecological environmental carrying capacity
As discussed above, the method used to construct the evaluation system in this study had strengthened some indicators related to the ecological environment based on the regional characteristics of Ganzi Prefecture. In addition, some accounting indicators of the carrying capacity of economically developed urban areas had been weakened. However, further research on the ecological environmental indicators suggests that the distribution of ecological carrying capacity in Ganzi Prefecture does not show obvious regularity in most of the strengthened indicators. This is particularly true in agriculture, forestry, animal husbandry, and fishing. A linear relationship was found between the values of the water resource indicators and the rankings. However, the weakened indicators of built-up area and green spaces exhibited strong linear distribution patterns with the rankings.
Considering the current developmental status of Ganzi Prefecture, the ecological environmental management in Ganzi Prefecture should focus on pollution, especially water pollution control. Ganzi Prefecture is extremely rich in water resources, including precipitation, mountain ice and snow, lake water, transit water, and groundwater. The total water resources in Ganzi Prefecture are approximately 140 billion m3. Ganzi Prefecture is also rich in non-ferrous and precious metal mineral resources. However, while the developed mining industry brings a large amount of economic income to Ganzi Prefecture, it also causes serious water, soil, and air pollution. After the implementation of long-term pollution control by the government, the current environmental quality of the Ganzi Prefecture is high. However, environmental damage continues to occur. For example, The Supreme People’s Court of the People’s Republic of China published a typical case of ecological protection on the Qinghai-Tibet Plateau in May 2023. A cement company in Ganzi Prefecture had illegally extracted 1196042 t of limestone without holding the proper mining license qualifications, causing severe vegetation and soil damage (Han, 2023). Strengthening the environmental protection of water sources in various counties and cities is necessary. Implementing operational water resource monitoring and air monitoring and punishing enterprises that do not meet emission standards and violate regulations are effective ways to achieve this target.

4.3 Analysis of the geological environmental carrying capacity in Ganzi Prefecture

The geological environment of Ganzi Prefecture is complex, and the geological environmental carrying capacity of Ganzi Prefecture shows obvious regional characteristics. The carrying capacity in the eastern region is significantly weaker than that in the western region, as shown in Fig. 5. This study collected 1561 disaster points, nearly half of which were concentrated near the Xianshuihe fracture zone in the east and near the Jinsha River fracture zone in the west. Small- and medium-sized mudslides and landslides are the main geological disasters in Ganzi Prefecture (Zhao et al., 2010). Strong control of active faults is the primary cause of geological disasters. The fracture is also forming a high mountain canyon landform with a large elevation difference in Ganzi Prefecture, creating optimal conditions for large- scale debris flows (Luo et al., 2020). The rock stratum near the active fault in Ganzi Prefecture is mainly sandstone and slate mixed with carbonatites and phyllites. The freeze-thaw effect in these high and cold mountainous areas further fractures the rock mass, which is conducive to loose accumulation layers. These conditions form a mudslide- and landslide-prone environment for Ganzi Prefecture (Liu, 2003). The main measures for improving the geological environment of Ganzi Prefecture include governance, avoidance, and monitoring.
Fig. 5 Map of the geological environmental carrying capacity in Ganzi Prefecture
Geological environments, such as fault zones, are difficult to change. However, the environment for the common geological disasters, such as landslides and mudslides, can be improved through ecological management in Ganzi Prefecture. Ganzi Prefecture is located at the junction of the western Sichuan Plateau and the Qinghai-Tibet Plateau. It not only has steep terrain, but also thin topsoil and a poor vegetation regeneration ability. Excessive mining of mineral resources and large-scale deforestation have created conditions that are conducive to geological disasters (Zhao et al., 2010). Therefore, implementation of Grain for Green, afforestation, and reasonable grazing are necessary conditions for allowing Ganzi Prefecture to improve its geological environment. These methods can be used to control the hidden danger points of geological hazards with a small scale and low degree of harm in stages. Monitoring and avoidance measures should be implemented for large-scale and highly hazardous disaster locations. Local relocation and road rerouting can be considered in the short-term. Establishing a group control system may be beneficial in residential areas that are difficult to relocate before effective prevention and control measures are taken in potential disaster areas. Long-term operational monitoring will help with the detection of disasters in a timely manner. This will help reduce casualties, even in the case of an emergency or disaster (Adhikari and Nath, 2016; Alcántara-Ayala and Garnica, 2013).

5 Discussion

As a major natural disaster, earthquakes cause huge economic losses and numerous casualties every year. Owing to limitations in science and technology, earthquake prediction remains a global problem. The prevention of earthquake disasters is the primary way to reduce the associated losses. Therefore, studying the resource and environmental carrying capacity of earthquake-prone areas is necessary and has practical significance. Earthquake-prone areas are often located at the junctions of earth plates, where geological activities are frequent and the geological environment is fragile. Earthquakes with higher magnitudes are more likely to induce secondary disasters, forming complex disaster chains and networks, and causing even greater losses (Yu et al., 2022). When studying the resource and environmental carrying capacity of earthquake-prone areas, the impact of the fragile geological environment on the carrying capacity must be fully considered. Based on the existing resource and environmental carrying capacity evaluation systems, exploring all possible geological environmental influencing factors is recommended. This study comprehensively considered the factors related to the social economy, ecological environment, and geological environment, and a resource and environmental carrying capacity evaluation framework suitable for earthquake-prone areas was developed. Possible post-disaster reconstruction strategies and future development planning for earthquake-prone areas in Ganzi Prefecture were discussed.
The carrying capacities of resources and the environment were evaluated for each city in Ganzi Prefecture to explore the stable progress of post-disaster reconstruction. This study selected relevant resource and environmental carrying capacity evaluation indicators that were in line with the actual conditions of each city in Ganzi Prefecture. A total of 23 evaluation indicators were selected from three aspects: social economy, ecological environment, and geological environment. Wang et al. (2018) selected 20 indicators from the three aspects of social economy, ecology, and geology to evaluate the geological carrying capacity of Du-Wen Road. Zhao et al. (2022) proposed that social economy, ecological environment, and geological environment are the main areas of geological research. The land, water, population, and geological disaster areas have received considerable attention in most studies, although the environments affected by earthquakes and secondary disasters are typically overlooked. In some studies, atmospheric and plant environments have been included in the evaluation system as well (Zhao et al., 2022).
This study adopted the TOPSIS method as the main evaluation method and used the AHP method to calculate the weight value of each evaluation index. TOPSIS, AHP, Fuzzy Comprehensive Evaluation, Coefficient of Variation, System Dynamics, Ecological Footprint, Virtual Water, and Virtual Energy are common methods for evaluating resource carrying capacity (Feng et al., 2017; Zhao et al., 2022). Compared with other methods, TOPSIS shows high flexibility and convenience. TOPSIS can handle the evaluation of multiple indicators and diverse units over a short period, and some studies have proven these advantages (Yu et al., 2018). However, TOPSIS requires a large amount of data and appropriate quantitative indicators, which is difficult to achieve in regions with poor data availability. Some studies have pointed out that the TOPSIS methods suffers from the rank reversal phenomenon (Ciardiello and Genovese, 2023).
The research results show that the relative advantages and disadvantages of the carrying capacities of resources and the environment in Ganzi Prefecture have certain regional distribution characteristics. Zhou et al. (2023) evaluated the geological disaster resistance capacities of various regions in Ganzi Prefecture. Their research results showed that the disaster resistance capacity of the southeastern region of Ganzi Prefecture is generally higher than that of the northwestern region, which is consistent with the results of the present study.
Mature crisis response plans are currently an important method for disaster prevention and reduction, and a lack of scientific response measures for disasters may lead to further losses. For example, on March 11, 2011, Japan experienced a 9.0 magnitude earthquake which triggered a huge tsunami disaster. Due to the government's lagging crisis response capacity, the disaster ultimately led to the nuclear leakage at the Fukushima nuclear power plant (Ma, 2021). On May 22, 2021, a 7.4 magnitude earthquake occurred in Qinghai, China. Due to the excellent response measures, only a few civilians were injured in that earthquake (The Xinhua News Agency, 2021).
When conditions permit, the geological environment of the surrounding areas should be considered when evaluating the resource and environmental carrying capacity of earthquake-prone areas. Earthquakes usually occur in fault zones and at the boundaries of various continents and oceanic plates. The epicenter of the Luding 6.8 Magnitude Earthquake was located at the junction of three fault zones. However, there are also exceptions, such as the Turkey 7.8 Magnitude Earthquake. The epicenter of the Turkish earthquake was located near a seismic blank area of nearly 300 km in the East Anatolia fault zone. There are no large-scale earthquake records for the past 100 years in that area, but the surrounding area has experienced frequent geological activity in recent years, which may have been one of many causes of the Turkey 7.8 Magnitude Earthquake.

6 Conclusions

This study carried out a reasonable evaluation of the resource and environmental carrying capacity of Ganzi Prefecture. The results showed that the resource carrying capacity in Ganzi Prefecture is generally high in the southeast and low in the northwest. This result effectively reflects the current situation of the resource and environmental carrying capacity in Ganzi Prefecture, and proves the reliability of the evaluation system. The distribution pattern of the carrying capacity in earthquake-prone regions revealed by this evaluation system will help the corresponding regions formulate targeted post-disaster reconstruction plans, as well as future development plans for disaster prevention and mitigation. Such plans should be helpful in preventing geological disasters and reducing possible future losses. This research has reference value for similar earthquake-prone areas worldwide, especially in earthquake-prone plateau areas. However, owing to the complexity of resource and environmental carrying capacity and the differences in geological structures in various earthquake-prone areas, further study of the mechanization of the resource and environmental carrying capacity in earthquake-prone areas is required. The corresponding methods and technologies must be optimized for analyzing the corresponding mechanisms and improving the future versatility of this evaluation system.
[1]
Abdel-Basset M, Mohamed M, Sangaiah A K. 2017. Neutrosophic AHP-Delphi group decision making model based on trapezoidal neutrosophic numbers. Journal of Ambient Intelligence and Humanized Computing, 9(5): 1427-1443.

DOI

[2]
Adhikari M D, Nath S K. 2016. Site-specific next generation ground motion prediction models for Darjeeling-sikkim Himalaya using strong motion seismometry. The Journal of Indian Geophysical Union, 20(2): 151-170.

[3]
Alcántara-Ayala I, Garnica R J. 2013. Landslide monitoring and warning systems in Mexico. In: Sassa K, Rouhban B, BriceñoS, et al. Berlin, Germany: Springer:(eds). Landslides: Global risk preparedness. 299-314.

[4]
Aksoy H, Ercanoglu M. 2007. Fuzzified kinematic analysis of discontinuity-controlled rock slope instabilities. Engineering Geology, 89(3-4): 206-219.

DOI

[5]
Chai J, Ngai E W T. 2021. Decision-making techniques in supplier selection: Recent accomplishments and what lies ahead. Expert Systems with Application. 140: 112903. DOI: 10.1016/j.eswa.2019.112903.

[6]
Ciardiello F, Genovese A. 2023. A comparison between TOPSIS and SAW methods. Annals of Operations Research, 325: 967-994.

DOI

[7]
Dang C L, Peng M C. 1988. Preliminary study on land bearing capacity in Yimen County, Yunnan Province. Ecological Economy, (6): 37-44. (in Chinese)

[8]
EM-DAT. 2023. Earthquake records in China from 1950 to 2022. https://www.emdat.be. Viewed on 2023-08-30.

[9]
Fan X M, Wang X, Dai L X. 2022. Study on the characteristics and spatial distribution of geological disasters induced by the S6.8 Luding Earthquake. Journal of Engineering Geology, 30(5): 1504-1516. (in Chinese)

[10]
Feng Z M, Yang Y Z, Yan H M, et al. 2017. Research on Carrying capacity of resources in the past century: from theory to practice. Resources Science, 39(3): 379-395. (in Chinese)

[11]
Garze Prefecture Bureau of Statistics. 2021. Statistical Yearbook of Ganzi Prefecture. http://tjj.gzz.gov.cn/ndsj/article/369501. Viewed on 2022-12-01 in Chinese)

[12]
Han X G. 2023. China’s supreme people’s court releases typical cases of ecological protection on the Qinghai-Tibet Plateau. https://www.court.gov.cn/zixun-xiangqing-398782.html. Viewed on 2023-08-30 (in Chinese)

[13]
Hsu W L, Shen X J, Xu H. et al. 2021. Integrated evaluations of resource and environment carrying capacity of the Huaihe River Ecological and Economic Belt in China. Land, 10(11): 1-21.

DOI

[14]
Liu Y J. 2003. Theoretical study on fluidization of large-scale high-speed rock landslide. Chinese Journal of Rock Mechanics and Engineering, 22(1): 170. (in Chinese)

[15]
Luo L G, Pei X J, Huang R Q. 2020. Study on the probability of earthquake landslides in strong earthquake mountainous areas—Taking Jiuzhaigou Valley Scenic and Historic Interest Area National Geopark as an example. Journal of Rock Mechanics and Engineering, 39(10): 2079-2093. (in Chinese)

[16]
Ma Z A. 2021. Youth scholars roundtable, on the 10th anniversary of Japan’s 3.11 Earthquake, how many lessons should we learn. Dazhong Daily. https://dzrb.dzng.com/articleContent/2733_850305.html. Viewed on 2023-08-30. (in Chinese)

[17]
Qi J, Zhang Y, Zhang J, et al. 2022. Research on the evaluation of geological environment carrying capacity based on the AHP-CRITIC empowerment method. Land, 11(8): 1196. DOI: 10.3390/land11081196.

[18]
Saaty T L. 1990. How to make a decision: The analytic hierarchy process. European Journal of Operational Research, 48(1): 9-26.

DOI

[19]
Song D M, Zang L, Liu C X, et al. 2016. Evaluation of geologic bearing capacity of coastal zones—Taking coastal area of Laizhou Bay as an example, Ocean & Coastal Management, 134: 129-139.

[20]
The Xinhua News Agency. 2021. Qinghai Maduo 7.4 magnitude earthquake rescue demonstrates “people first”. https://baijiahao.baidu.com/s?id=1700787707467057078&wfr=spider&for=pc. Viewed on 2023- 08-30 (in Chinese)

[21]
UN News. 2008. UNHCR will donate an additional 4000 tents to earthquake stricken areas in China. https://news.un.org/zh/story/2008/05/95682. Viewed on 2023-08-30.

[22]
UN News. 2010. Humanitarian needs of Haiti’s quake survivors still immense—UN and partners. https://news.un.org/en/story/2010/07/344522. Viewed on 2023-08-30.

[23]
UN News. 2023. Children sleep in streets, too afraid to go home after quake disaster. https://news.un.org/en/story/2023/02/1133482. Viewed on 2023-08-30.

[24]
Wang L, Lu X Y, Hu Y H, et al. 2018. Evaluation of the geological and ecological environment carrying capacity along the Duwen Highway. Surveying and Mapping Science, 43(2): 51-57, 69. (in Chinese)

[25]
Wang Z, He X, Zhang C, et al. 2020. Evaluation of geological and ecological bearing capacity and spatial pattern along Du-Wen Road based on the Analytic Hierarchy Process (AHP) and the Technique for Order of Preference by Similarity to an Ideal Solution (TOPSIS) method. International Journal of Geo-Information, 9(4): 237. DOI: 10.3390/ijgi9040237.

[26]
Wang Z, Wang Y, Wang L, et al. 2019. Research on the comprehensive evaluation system of eco-geological environmental carrying capacity based on the analytic hierarchy process. Cluster Comput, 22(S3): 5347-5356.

DOI

[27]
Wu M W, Wu J Q, Zang C F. 2021. A comprehensive evaluation of the eco-carrying capacity and green economy in the Guangdong-Hong Kong-Macao Greater Bay Area, China. Journal of Cleaner Production. 281(1): 124945. DOI: 10.1016/j.jclepro.2020.124945.

[28]
Xie Z T. 2019. Evaluation of geological environment carrying capacity and disaster prevention countermeasures of typical cities and towns in high-incidence areas of geological disasters in the Bailongjiang River Basin. Diss., Lanzhou, China: Lanzhou University. (in Chinese)

[29]
Xu S P, Hu L Y. 2020. Analysis of geological disaster prevention and mitigation strategies based on the evaluation of geological environment carrying capacity. China Metal Bulletin, (6): 281-282. (in Chinese)

[30]
Yu C Y. 2021. Research on risk zoning of typical geological hazards and comprehensive evaluation of geological environment carrying capacity in Helong City. Diss., Changchun, China: Jilin University. (in Chinese)

[31]
Yu G R, Zhang X M, Zhao D S, et al. 2022. Discussion on the scientific concept of regional resource and environmental carrying capacity and its ecological basis. Journal of Applied Ecology, 33(3): 577-590.

[32]
Yu L P, Yang W H, Duan Y L, et al. 2018. Applied mathematics for engineering problems in biomechanics and robotics. Mathematical Problems in Engineering. DOI: 10.1155/2018/5456064.

[33]
Zeng S, Xiao Y. 2018. A method based on TOPSIS and distance measures for hesitant fuzzy multiple attribute decision making. Technological and Economic Development of Economy, 24(3): 969-983.

DOI

[34]
Zhang H Y, Song Y Q, Zhang L, 2020. Pollution control in urban China: A multi-level analysis on household and industrial pollution. Science of the Total Environment, 749: 141478. DOI: 10.1016/j.scitotenv.2020.141478.

[35]
Zhang M, Liu Y M, Wu J, et al. 2018. Index system of urban resource and environment carrying capacity based on ecological civilization. Environmental Impact Assessment Review. 68(1): 90-97.

DOI

[36]
Zhao Y B, He Z W, Ni Z Y, et al. 2010. Study on the quality of ecological geological environment in the east of Ganzi Prefecture, Sichuan Province. Environmental Science Research, 23(8): 1033-1038. (in Chinese)

[37]
Zhao Y B, Ni Z Y, Ouyang Y, et al. 2022. Research progress of ecological geology carrying capacity. Sedimentation and Tethys Geology, 42(4): 529-541. (in Chinese)

[38]
Zhou J Y, Chang S S, Li Z G. 2021. Research progress on urban carrying capacity at home and abroad. Land and Resources Information, (6): 31-38. (in Chinese)

[39]
Zhou Y, Li Y L, Zhang L Y, et al. 2023. Spatial-temporal characteristics of geological disaster resilience in poverty and disaster-prone areas in China: A case study of Ganzi Prefecture. Environmental Science and Pollution Research International, 30: 83401-83420.

DOI PMID

[40]
Zytoon M A. 2020. A decision support model for prioritization of regulated safety inspections using integrated Delphi, AHP and Double-Hierarchical TOPSIS approach. IEEE Access, 8: 83444-83464.

DOI

Outlines

/