
Journal of Resources and Ecology >
Ecosystem Service Functions of a Typical Karst Urban Basin based on Land Use Change
Received date: 2023-04-14
Accepted date: 2023-07-30
Online published: 2023-12-27
Supported by
The Youth Talent Growth Project of Guizhou Provincial Department of Education(Qian Jiao He KY [2022] 202)
The Guizhou Provincial Basic Research Program (Natural Science)([2020]1Y157)
The Guizhou Provincial Program on Commercialization of Scientific and Technological Achievements([2022]010)
The Guizhou Provincial Science and Technology Projects(ZK[2023]-464)
The Scientific Research Projects in Higher Education Institutions of Guizhou Provincial Department of Education (Youth Project)(2022-351)
The Water Conservancy Science and Technology Funding Projects in Guizhou Province(KT202223)
The Water Conservancy Science and Technology Funding Projects in Guizhou Province(KT202316)
The Water Conservancy Science and Technology Funding Projects in Guizhou Province(KT202323)
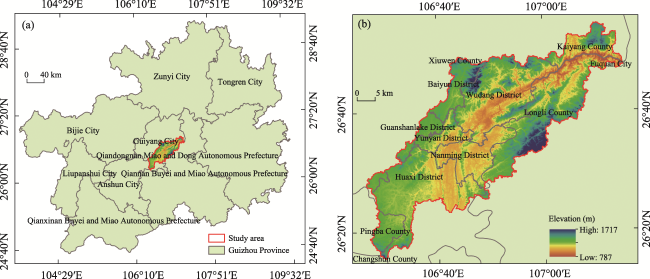
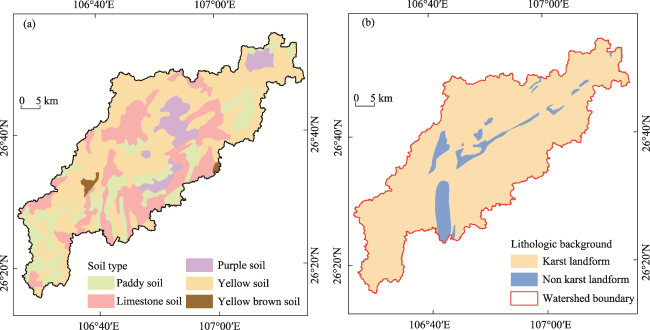
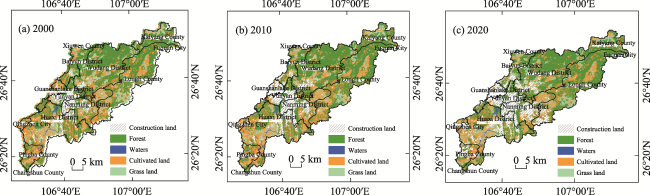
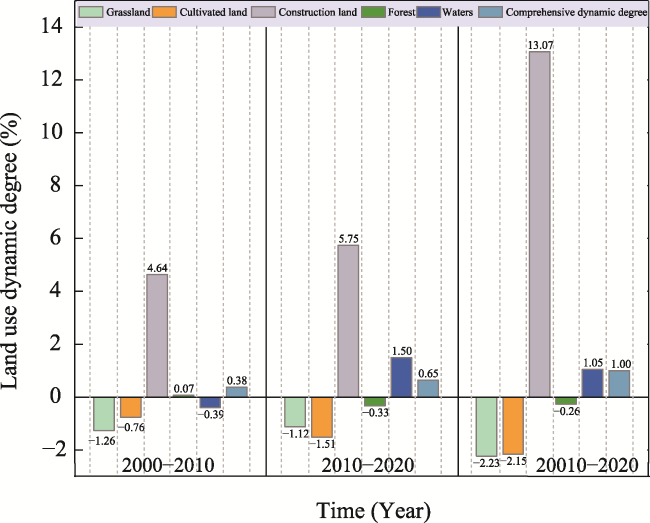
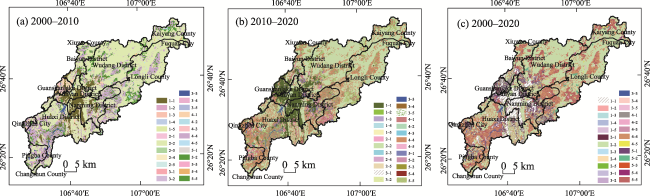
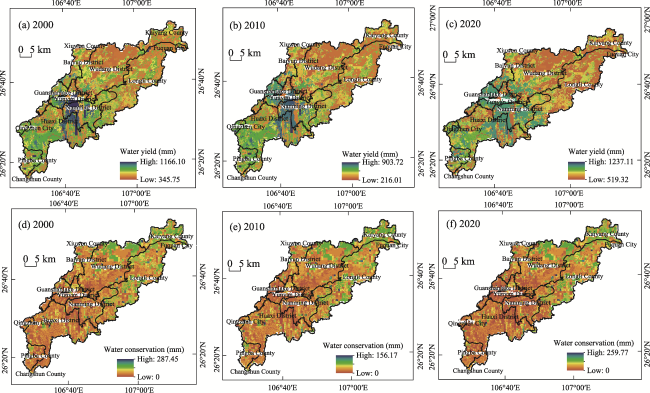
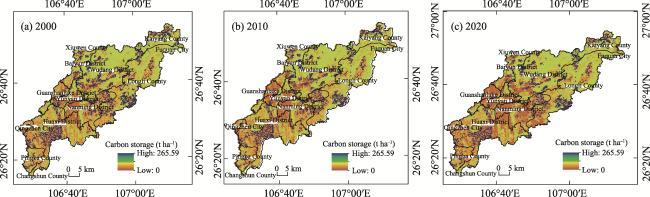
Revealing the mechanism by which land use influences ecosystem service function in karst urban watersheds is of great significance for social and economic development and ecological environmental protection. In this study, the Nanming River Basin, a typical karst basin in Guizhou Province, was used as an example. The spatiotemporal dynamic changes in land use in the basin during three periods from 2000 to 2020 were analyzed using ArcGIS, and the ecosystem service functions of the different land use types in the basin were evaluated using an integrated valuation of ecosystem services and tradeoffs (InVEST) model. This analysis led to three outcomes. (1) Forest, cultivated land, and grassland make up most of the land uses. The land use change was mostly dependent on the growth of construction land, which expanded by 13.07%. (2) The watershed's water conservation function was significantly boosted during the study period. In contrast, the carbon stock function became slightly impaired, and the physical quality of both was regionally distributed as high in the northeast and low in the southwest. (3) The contributions of forest to total water conservation and carbon stock of the watershed are always the greatest, exceeding 57%, and the conversions of forest to construction land and cultivated land to forest are the two primary types of land use change in which the ecosystem service function was impaired and strengthened, respectively. The results of this study can provide important data support and scientific reference for land use structure optimization, soil and water resource exploitation, and sustainable ecosystem management in ecologically fragile areas.
Key words: karst; urban basin; land use; InVEST model; ecosystem service functions
LI Yue , GENG Huacai , WU Luhua , LUO Guangjie , CHEN Fei . Ecosystem Service Functions of a Typical Karst Urban Basin based on Land Use Change[J]. Journal of Resources and Ecology, 2024 , 15(1) : 1 -14 . DOI: 10.5814/j.issn.1674-764x.2024.01.001
Table 1 Data requirements and processing of the annual water production module of the Invest model |
| Basic data | Data sources | Data description | Data processing tools | Data processing method |
|---|---|---|---|---|
| DEM data | Geospatial Data Cloud Platform (http://www.gscloud/) | SRTMDEMUTM 30 m resolution data product | ArcGIS 10.8 hydrological analysis tools | Fill, analyze the flow direction and flow accumulation, build a river network |
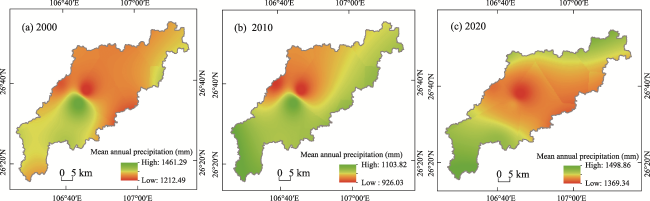
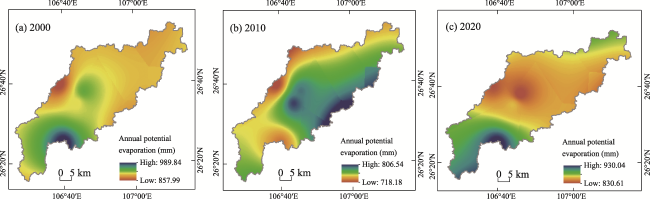
| Meteorological data | China Meteorological Network (http://data.cam.cn) China's surface climate data dataset | Resolution of 1 km after interpolation Daily maximum/minimum temperature Average daily temperature Precipitation | ArcGIS 10.8 interpolation analysis tool | Precipitation data from 13 meteorological stations, inverse distance interpolation to obtain precipitation and potential evapotranspiration raster data (Figs. 3, 4) |
| Soil data | Chinese soil dataset from Harmonized World Soil Database (HWSD) (https://www.iiasa.ac.at/Research/LUC/External-World-soil-database/HTML/) | Resolution of 1 km REF_DEPTH T_SILT T_SAND T_CLAY T_OC | ArcGIS 10.8 raster calculator tool | Use the empirical formula (Gupta and Larson, 1979) to calculate the available water content of the plants and the maximum burial depth of the soil roots |
| Remote sensing images | Geospatial Data Cloud Platform (http://www.gscloud/) | Two Landsat TM images acquired in 2000 and 2010 and Landsat 8 images acquired in 2020 | ENVI5.3 | Preprocessing such as radiometric calibration, atmospheric correction, geometric correction, cropping, and stitching |
Table 2 Carbon density figures of the different land use types in the Nanming River Basin (Unit: t ha-1) |
| Land use type | Aboveground carbon density | Underground carbon density | Soil carbon density | Dead organic matter carbon density | Data source |
|---|---|---|---|---|---|
| Grassland | 0.82 | 0.87 | 89.20 | 1.00 | Yang and Wu, 2020 |
| Forest | 20.36 | 67.50 | 170.00 | 7.80 | Yang and Wu, 2020 |
| Cultivated land | 38.90 | 7.30 | 89.18 | 0 | Li et al., 2020a |
| Construction land | 0 | 0 | 110.69 | 0 | Li et al., 2020a |
| Waters | 0 | 0 | 0 | 0 | Huang, 2020 |
Table 3 Changes in the water conservation values of the different land use types in the Nanming River Basin from 2000 to 2020 (Unit: 105 m3) |
| Land use type | Water conservation | Change in water conservation | ||||
|---|---|---|---|---|---|---|
| 2000 | 2010 | 2020 | 2000-2010 | 2010-2020 | 2000-2020 | |
| Grassland | 1.71 | 0.95 | 1.62 | -0.76 | 0.67 | -0.09 |
| Cultivated land | 2.46 | 1.42 | 2.38 | -1.04 | 0.96 | -0.08 |
| Construction land | 0.41 | 0.82 | 0.92 | 0.41 | 0.10 | 0.51 |
| Forest | 6.02 | 3.94 | 7.51 | -2.08 | 3.57 | 1.49 |
| Waters | 0.022 | 0.020 | 0.028 | -0.002 | 0.008 | 0.006 |
Table 4 Changes in carbon stocks for the different land use types in the Nanming River Basin from 2000 to 2020 (×105 t) |
| Land use type | Carbon stock | Change in carbon stock | ||||
|---|---|---|---|---|---|---|
| 2000 | 2010 | 2020 | 2000-2010 | 2010-2020 | 2000-2020 | |
| Grassland | 31.3 | 27.33 | 24.26 | -3.97 | -3.07 | -6.87 |
| Cultivated land | 88.03 | 80.78 | 68.31 | -7.25 | -12.47 | -19.72 |
| Construction land | 20.06 | 29.41 | 46.63 | 9.35 | 17.22 | 26.57 |
| Forest | 259.42 | 262.4 | 253.81 | 2.98 | -8.59 | -5.61 |
| Waters | 0 | 0 | 0 | 0 | 0 | 0 |
| [1] |
|
| [2] |
|
| [3] |
|
| [4] |
|
| [5] |
|
| [6] |
|
| [7] |
|
| [8] |
|
| [9] |
|
| [10] |
|
| [11] |
|
| [12] |
|
| [13] |
|
| [14] |
|
| [15] |
|
| [16] |
|
| [17] |
|
| [18] |
|
| [19] |
|
| [20] |
|
| [21] |
|
| [22] |
|
| [23] |
|
| [24] |
|
| [25] |
|
| [26] |
|
| [27] |
|
| [28] |
|
| [29] |
|
| [30] |
|
| [31] |
|
| [32] |
|
| [33] |
|
| [34] |
|
| [35] |
|
| [36] |
|
| [37] |
|
| [38] |
|
| [39] |
|
| [40] |
|
| [41] |
|
| [42] |
|
| [43] |
|
| [44] |
|
| [45] |
|
| [46] |
|
| [47] |
|
| [48] |
|
| [49] |
|
| [50] |
|
| [51] |
|
| [52] |
|
| [53] |
|
| [54] |
|
| [55] |
|
| [56] |
|
| [57] |
|
| [58] |
|
| [59] |
|
| [60] |
|
| [61] |
|
| [62] |
|
| [63] |
|
/
| 〈 |
|
〉 |