Land Use and Land Resources

The Effect of Upgrading the Dietary Structure of Residents on Non-grain Production of Cultivated Land

  • CHEN Qianru , 1, 2, * ,
  • WU Manyu 1, 2 ,
  • ZENG Hongchen 1, 2 ,
  • LUO Shilong 1, 2
Expand
  • 1. School of Applied Economics (School of Digital Economics), Jiangxi University of Finance and Economics, Nanchang 330013, China
  • 2. Institution of Ecological Civilization, Jiangxi University of Finance and Economics, Nanchang 330013, China
* CHEN Qianru, E-mail:

Received date: 2023-06-20

  Accepted date: 2023-08-15

  Online published: 2023-10-23

Supported by

The National Natural Science Foundation of China(42261050)

The National Natural Science Foundation of China(42371285)

The China Postdoctoral Science Foundation(2023M731428)

The Science and Technology Research Project of Jiangxi Provincial Department of Education(GJJ2200545)

The Social Science Foundation of Jiangxi Province(23GL51D)

Abstract

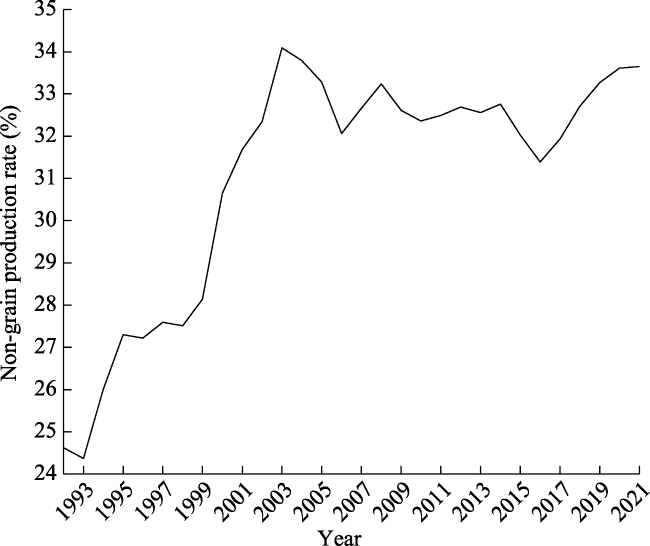
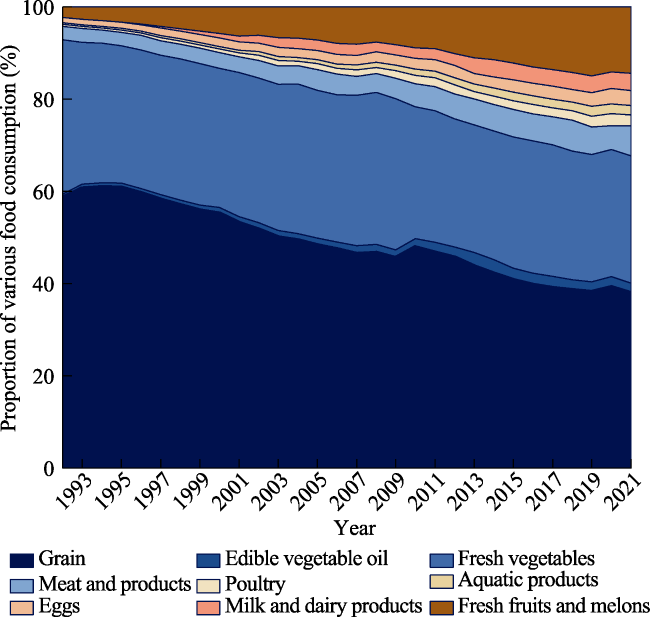
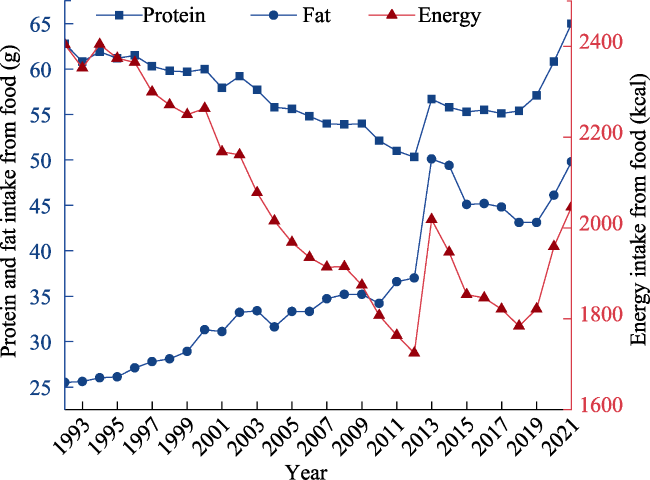
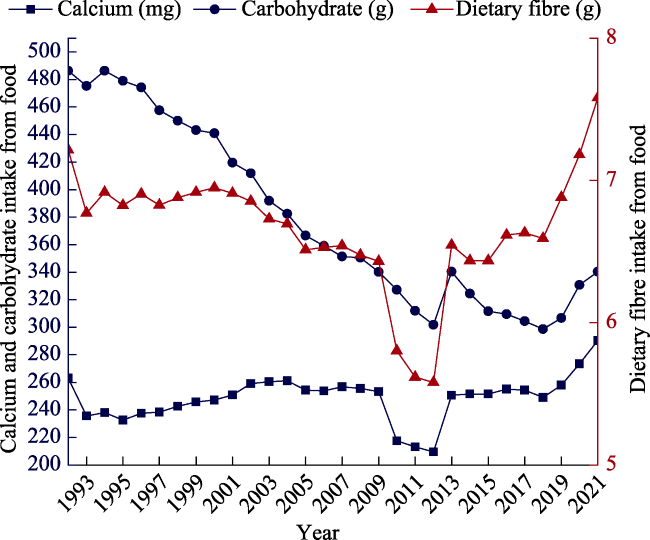
The impact of dietary structure adjustments among residents on the utilization of arable land has attracted academic attention. This study used the time series data for the dietary structure of residents from 1992 to 2021 in China to explore the dynamic impact mechanism of dietary structure upgrading on non-grain production by using VAR model, and analyzed the direction and degree of impact by using impulse response diagram and variance decomposition. This analysis indicated five key features of this system. (1) The average value of the non-grain production rate was 31.02% during the period of 1992-2021, and it showed a fluctuating upward trend. (2) The proportion of plant food consumption by the residents was decreasing and the proportion of animal food was increasing, and the structure of food consumption was shifting from singular to diversified. (3) The intake levels of protein, fat, dietary fibre, and calcium showed fluctuating upward trends, and the intakes of energy and carbohydrate showed a fluctuating downward trends, and the change in the dietary nutrient intake level of residents was consistent with the trend of change in the per capita food consumption structure. (4) On the whole, protein, fat and calcium intake had positive effects on non-grain production, indicating that increases in animal food consumption would aggravate the non-grain production. (5) Overall, energy, protein, and calcium intakes had greater impacts on non-grain production. The results of this study can provide scientific support for the non-grain governance strategy of arable land and the decisions regarding arable land protection from the concept of “an all-encompassing approach to food”. These results also have positive significance for optimizing the mode of arable land use, improving the efficiency of arable land use and ensuring food security under the background of dietary structure adjustments and upgrading.

Cite this article

CHEN Qianru , WU Manyu , ZENG Hongchen , LUO Shilong . The Effect of Upgrading the Dietary Structure of Residents on Non-grain Production of Cultivated Land[J]. Journal of Resources and Ecology, 2023 , 14(6) : 1350 -1360 . DOI: 10.5814/j.issn.1674-764x.2023.06.022

1 Introduction

Since the reform and opening up in 1978, China’s social and economic level has developed rapidly, and the improvement in resident income has brought about adjustments in the food consumption structure (Xin et al., 2015). The food consumption structure of Chinese residents has gradually changed from plant food consumption of “grains and vegetables” to animal food consumption of “meat, poultry, eggs and milk” (Wang et al., 2023). The change in the food consumption structure on the consumption side will affect grain production and arable land use at the supply side through the supply and demand mechanism. Some studies have shown that, to a certain extent, the non-grain production on the supply side is a response to the upgrading of food consumption and the nutritional structure of the population on the demand side (Chen and Xie, 2022). In response to the increasing growth in non-grain production, the General Office of the State Council of China issued “the Opinions on Preventing Non-grain Production and Stabilising Grain Production” in 2020, which proposed strict prevention and control. In 2023, the Opinions of the Central Committee of the Communist Party of China and the State Council on Doing a Good Job in the Key Work of Comprehensively Promoting Rural Revitalization emphasised the importance of strengthening the protection and use control of arable land, establishing the concept of an all-encompassing approach to food(① The concept of “an all-encompassing approach to food” refers to the concept of grasping the changing trend of residents’ food structure, meeting residents’ increasingly consumption demand for diversified food, developing food resources in an all-round and multi-channel way, and building a diversified food supply system.), and accelerating the construction of a diversified food supply system. Therefore, it is necessary to explore the impact mechanism by which the upgrading of the dietary structure of residents influences non-grain production, in order to provide a basis for controlling the use of arable land from the concept of an all-encompassing approach to food.
At present, many scholars have examined the relationship between the food structure of residents on the consumption side and the utilisation of arable land on the supply side (Franco et al., 2022; Frehner et al., 2022; Ma et al., 2022), including the relationship between people and food and changes in the carrying capacity of land resources (Wang et al., 2019a), the impact of changes in the residents’ dietary structure on arable land resources (Yu and Du, 2022), the environmental effects of changes in the food consumption structure measured using the footprint of arable land (Yan et al., 2022), and other topics. Gao et al. (2017) assessed the potential of arable land conservation under the food consumption structure of residents by establishing a correlation mechanism between the food consumption structure of rural residents and the demand for arable land, and found that animal food consumes three times more arable land resources than plant food at the same dietary nutritional level (Gerbens-Leenes and Nonhebel, 2005). Increasing animal food consumption will lead to increased environmental pressure on agricultural resources (Dong et al., 2019). Zhu et al. (2023) explored the demand for arable land resources and the transformation of China’s agricultural cropping structure under the evolution of dietary patterns in China. Studies have found that the changes in food consumption structure brought about by urbanization are the main driving force behind the changes in China’s agricultural planting structure (Liang et al., 2008). Most current studies use food types to characterize dietary structure. Due to differences in crop varieties in different regions (Wang et al., 2019b) and the diversification of food consumption structures (Zhai et al., 2006), it may not be accurate to use the standard food types to characterize dietary structure in national-scale studies. Therefore, this study introduced dietary nutrients as the dietary structure indicators. The Vector Auto Regression Model (VAR model) is suitable for studying the mechanisms of dynamic structural changes among variables, which was introduced by Christopher Sims into economics research (Liu and Gao, 2016). This study used the VAR model to investigate the impact mechanism by which the dietary consumption structure of residents influences non-grain production based on the time series data of resident dietary structure from 1992 to 2021. The results of this study have positive significance for expanding the management and control of arable land use from the concept of an all-encompassing approach to food, and can provide a scientific basis for the adjustment of the dietary structure of residents, the governance of non-grain production, and food security strategies.

2 Research methodology, selection of indicators and data sources

2.1 Research methodology

The Vector Auto Regression Model (VAR model), was first proposed by American econometrician Christopher Sims in 1980, and it is one of the most commonly used statistical models in economics. The VAR model can be constructed by taking each endogenous variable in the system as a function of the lag values of all endogenous variables in the system, in order to analyze the interactions between multiple variables. The VAR model is one of the most operable models for dealing with the analysis and prediction of multiple related economic indicators, and it can be used to estimate the dynamic relationships of joint endogenous variables without any prior constraints.
The general form of a VAR model is as follows:
${{Y}_{t}}={{\alpha }_{1}}{{Y}_{t-1}}+{{\alpha }_{2}}{{Y}_{t-2}}+\cdots +{{\alpha }_{p}}{{Y}_{t-p}}+\varepsilon $
where Yt, Yt‒1, …, Ytp are the vectors of k-dimensional endogenous variables, and the seven variables of non-grain production, energy, protein, fat, calcium, dietary fibre and carbohydrate were adopted in this study as the endogenous variables Yt of the model; α1, α2, ···, αp are the coefficient matrix; ε is the random error term; t (t=1, 2, ···, 30) represents the years; and p is the lag order.

2.2 Selection of indicators

Currently, the definition and standard of non-grain production is not uniform in academic circles. For example, Luo et al. (2018) measured the non-grain production by the proportion of the sown area of non-grain crops after the transfer of arable land to the total area of arable land transferred. Chen et al. (2016) measured the non-grain production by the proportion of grain income to total income. Zhang et al. (2014) suggested that the proportion of family farms planting cash crops can be used to reflect the level of non-grain production. Zhang et al. (2021b) divided the non-grain production into the non-grain production of the cultivation structure and the non-grain production of the agricultural industrial structure. In this study, the proportion of the area of non-grain crops to the total sown area of crops was used to measure the level of non-grain production of the cultivation structure; and the proportion of the area of restored land to the total area of arable land was used to reflect the level of non-grain agricultural industrial structure. Considering data availability and research needs, this study selected “the sown area of cash crop accounts for the total sown area of crops” to characterise the degree of non-grain production in each year during 1992-2021.
Most previous studies used food types, such as grains, fresh vegetables, meat and products and poultry, as the indicators of dietary structure (He et al., 2019; Yan et al., 2022). However, there are some limitations in characterizing the dietary structure of residents only by such general food types. On the one hand, there are differences in natural conditions between regions (Wang et al., 2019b). For example, the water and heat conditions in the north are less favorable than in the south. Therefore, the yields of vegetables and melons and fruit cultivation are low, but this region is suitable for the growth of pasture and the development of animal husbandry, so the material food consumption of the residents is dominated by beef and mutton, whereas the southern region is the opposite, so characterizing dietary structure in this way cannot fully reflect the real situation. On the other hand, with the continuous improvement of the quality of life among residents, the structure of their food consumption is becoming more diversified, and the food structure dominated by grains has gradually been expanded to include melons, fruit and vegetables, meat, poultry, eggs and milk, and other types of foods (Zhai et al., 2006). Therefore, it is no longer possible to objectively reflect changes in the dietary structure of the residents based solely on the types of food consumption, so it is more reasonable to use the dietary nutrients contained in the food consumed by the residents to reflect the changes in the dietary structure of the residents.
The human body requires a variety of nutrients to maintain normal physiological functions and healthy development. Among them, energy, protein, fat, dietary fibre, calcium and carbohydrate are considered to be the six dietary nutrients that are essential for human health (Lin, 2006). Based on this list, this study selected six dietary nutrients: energy, protein, fat, dietary fibre, calcium, and carbohydrate from nine major food groups (Han et al., 2020): grain, edible vegetable oil, fresh vegetables, meat and products (pig, cow, and sheep), poultry, aquatic products, eggs, milk and dairy products, and fresh fruits and melons, as the variables of dietary structure, and used them to explore the mechanism by which the upgrading of residents’ dietary structure influences the non-grain production of arable land. The contents of dietary nutrients in each food group are shown in Table 1, and the selection of variables and their meanings are shown in Table 2.
Table 1 Dietary nutrient content of various foods
Primary classification Secondary classification Energy (kcal) Protein (g) Fat (g) Carbohydrate (g) Dietary fibre (g) Calcium (mg)
Plant-based food Grain 346 7.9 0.9 77.2 0.6 8
Edible vegetable oil 899 0 99.9 0 0 9
Fresh vegetables 20 1.6 0.2 3.4 0.9 57
Fresh fruits and melons 53 0.4 0.2 13.7 1.7 4
Animal products Meat and products 210 17.9 15.1 0.7 0 9
Poultry 145 20.3 6.7 0.9 0 13
Aquatic products 103 16.6 3.3 1.6 0 58
Eggs 139 13.1 8.6 2.4 0 56
Milk and dairy products 65 3.3 3.6 4.9 0 107

Note: Data were obtained from Chinese Food Composition Table (6th Edition). The dietary nutrient contents of each food group in the table are expressed per 100 g of edible portion.

Table 2 Selection of variables and their meanings
Variable Implication Mean Std. Dev.
Non-grain production Proportion of area sown with cash crops to total area sown with crops (%) 31.02 2.89
Energy Dietary energy produced through human metabolism (kcal) 2046.854 218.138
Protein Dietary protein produced through human metabolism (g) 57.3707 3.6079
Fat Dietary fat produced through human metabolism (g) 35.736 7.8627
Dietary fibre Dietary fibre produced through human metabolism (g) 6.6593 4.2396
Calcium Dietary calcium produced through human metabolism (mg) 248.6817 16.5572
Carbohydrate Dietary carbohydrate produced through human metabolism (g) 379.1593 65.6865

2.3 Data sources

The data for the sown area of cash crops and the total sown area of crops, for calculating the indicator of non-grain production, came mainly from the China Statistical Yearbook (1993‒2022). Data for the per capita urban and rural food consumption in the nine categories of grain, edible vegetable oil, fresh vegetables, meat and products (pig, cow, and sheep), poultry, aquatic products, eggs, milk and dairy products, and fresh fruits and melons, for calculating the dietary structure of the residents, came mainly from the China Statistical Yearbook (1993‒2022) and the China Rural Statistical Yearbook (1993‒2014). Among the years, the values for the per capita consumption of various types of food in China before 2013 were calculated using the total per capita consumption of various types of food in rural areas and urban areas. In addition, the data concerning food consumption in this study are uniformly accounted for using raw grains; noting that the total urban food consumption before 2013 in the Statistical Yearbook was accounted for using processed grains, which was converted to raw grains at a proportion of 0.75 in this study with reference to the existing research (Tang and Li, 2012; Xin et al., 2015; Yu and Du, 2022). The meat consumption data in the statistical yearbook are for the body weight containing bone, which were converted according to the net meat coefficients of 0.76, 0.75, 0.55, and 0.95 for meat and products, poultry, aquatic products, and eggs, respectively (Huang, 2020). For some of the missing data, this study used linear interpolation to obtain the values. The data on dietary nutritional indicators contained in the various types of food were obtained from the Chinese Food Composition Table (6th edition), and the data on the dietary structures of urban and rural residents were obtained by using the total consumption and food composition data for various types of food.

3 Results

3.1 Evolutionary trend of non-grain production in China

The current situation of non-grain production in China is shown in Fig. 1. During the 30 years from 1992 to 2021, the proportion of non-grain production in China grew from 24.62% in 1992 to 33.65% in 2021, and showed a fluctuating upward trend with the annual growth. During the period of 1992‒1999, the level of non-grain production mainly showed a growing trend, and the growth rate was faster. This was related to the large influx of agricultural labour into urban industry and commerce during that period. Between 2000 and 2003, there was a jump in the level of non-grain production. In 2000, the market-oriented reform of grain purchasing and marketing was implemented, and the policy of “fixing farm output quotas for each household” for grain purchasing and pricing was abolished, so farmers gradually tended to plant cash crops with higher returns, and the level of non-grain production in that year increased by 2.5% over the previous year. In 2003, an agricultural subsidy policy was introduced to provide subsidies for farmers planting cash crops and special agricultural products, which greatly improved the farmers’ enthusiasm for planting non-grain crops, and the level of non-grain production in that year increased by 1.74% over the previous year. Between 2004 and 2021, the level of non-grain production has fluctuated upwards, which was related to the continuing decline in the comparative returns to grain cultivation, the outflow of rural labour and the diversification of farmers’ livelihoods.
Fig. 1 Changes in the non-grain production rate from 1992 to 2021

3.2 Evolutionary trend in the structure of food consumption by the residents

The per capita food consumption structure of Chinese residents changed significantly during the study period, with the overall development from a singular to a diversified structure. As shown in Fig. 2, the per capita food consumption of Chinese residents has transformed from a singular consumption dominated by grain and fresh vegetables to a balanced food consumption structure dominated by “grain, vegetables, meat and fruits”. During the period of 1992‒2021, grain and vegetable food consumption continued to decline, with the proportion of grain consumption dropping from 58.19% to 37.52%, and the proportion of fresh vegetables falling from 33.46% to 27.56%. The consumption of animal food increased steadily. Among the different components, the proportion of meat and products consumption rose from 2.87% to 6.49%, and the consumption of poultry, aquatic products, eggs and milk and dairy products rose from 0.49%, 0.32%, 1.17% and 0% to 2.39%, 2.03%, 3.25% and 3.74%, respectively. In addition, the proportion of fresh fruit and melon consumption continued to rise, with an increase of up to 12.15%. Existing studies show that the consumption of animal source food will increase with the increase of the residents’ income, and the residents’ dietary demand shows a reduced demand for cereals and an increased demand for meat (Xin, 2021). Before 1995, due to the limited economic development, the food source of residents was relatively singular, the consumption of food was based mainly on grains and fresh vegetables, and the average per capita consumption of food such as edible vegetable oils, poultry, aquatic products, and milk and dairy products was almost zero. In recent years, the structural adjustment of agricultural cultivation, the improvement of agricultural production methods, and the continuous improvement of agricultural technology in agriculture, forestry, animal husbandry and fisheries have broadened the range of food choices available to the residents. With the improvements in education and medical standards, as well as the rise of various industries such as fast food, and snacks, the food consumption concepts of residents have gradually changed, with greater emphasis on balanced nutrition and physical health. As a result, the food consumption of residents is no longer limited to basic food crops such as rice, wheat and corn, but has expanded to include fresh organic foods, including fruits, meat and milk. Overall, the diversification of Chinese residents’ food consumption has given rise to an adjustment and upgrading of their dietary structure, and this trend will further affect changes in the use of arable land.
Fig. 2 Per capita food consumption structure of residents, 1992‒2021

3.3 Evolutionary trend in the dietary structure of the residents

The changes in the per capita daily dietary structure of the population from 1992 to 2021 are shown in Fig. 3 and Fig. 4. The changes in various types of dietary nutrients are relatively large, and the overall trends of changes are obvious. Protein, fat, dietary fibre and calcium intake levels generally show fluctuating upward trends, while energy and carbohydrate generally show fluctuating downward trends. The intake levels of various dietary nutrients fluctuated significantly after 2008, and increased by leaps and bounds since around 2012. These changes were related to the development of the catering industry, the increase in the frequency of residents eating out, take-out ordering and changes in the eating and consumption habits. Especially the 2011 China Rural Compulsory Education Student Nutrition Improvement Plan and the 2012 Nutrition Improvement Project for Children in Poor Areas have played an important role in increasing the nutritional intake of rural children and improving the overall nutritional status of residents.
Fig. 3 Changes in per capita daily consumption of protein, fat, and energy among Chinese residents during 1992‒2021
Fig. 4 Changes in per capita daily consumption of calcium, calbohydrate, and dietary fibre among Chinese residents during 1992‒2021
The intake changes in dietary nutrients contained in food are generally consistent with the changing trend of the per capita food consumption structure. The level of dietary nutrient intake of residents is closely related to the contents of the various dietary nutrients in food. As shown in Table 1, the fat contents of grains, fresh vegetables, and fresh fruits and melons in plant-based foods are extremely low, while the energy and carbohydrate contents in grains are high, but in animal-based foods the fat content is high, and the carbohydrate and dietary fibre contents are low. Comparing Figs. 2, 3 and 4, as the proportion of animal food consumption, such as meat, poultry and others, in the food consumption structure increased, the intake levels of protein, fat and calcium of residents generally increased; and as the proportion of plant food consumption such as fresh vegetables and grains decreased, the carbohydrate intake levels declined overall. The intake changes in dietary nutrients contained in food are generally consistent with the changes in the food consumption structure.

3.4 Impact of changes in the dietary structure of the residents on non-grain production

3.4.1 ADF test

In order to make the model results more accurate and effectively avoid the problem of heteroskedasticity, this study used the natural logarithm values of all variables for the analysis. At the same time, the VAR model is a stationary time series analysis, so in order to prevent the phenomenon of pseudo- regression, it is necessary to carry out the ADF unit root test on all variables before establishing the VAR model. In order to make the model more rigorous, this study carried out the ADF unit root test at the 5% critical value level, and the results are shown in Table 3. Since lnnon-grain production, lnenergy, lnprotein, lndietary fibre, lncarbohydrate, lnfat and lncalcium are non-stationary time series variables, the first-order differences of all the variables were taken and then the ADF unit root test was carried out, and all the variables are stationary time series variables and none of them have a unit root.
Table 3 ADF unit root test
Variable ADF statistic 5% threshold P-value Test results
lnnon-grain production ‒2.502 ‒3.000 0.1150 Non-stationary
lnenergy ‒1.573 ‒1.708 0.0642 Non-stationary
lnprotein ‒1.083 ‒1.721 0.1456 Non-stationary
lnfat ‒1.190 ‒1.721 0.1236 Non-stationary
lndietary fibre ‒1.261 ‒1.708 0.1095 Non-stationary
lncalcium ‒1.473 ‒1.740 0.9205 Non-stationary
lncarbohydrate ‒0.715 ‒1.721 0.2411 Non-stationary
∆lnnon-grain production ‒3.597 ‒2.994 0.0058 Stationary
∆lnenergy ‒2.281 ‒1.725 0.0168 Stationary
∆lnprotein ‒1.882 ‒1.717 0.0365 Stationary
∆lnfat ‒2.902 ‒1.725 0.0044 Stationary
∆lndietary fibre ‒5.070 ‒3.588 0.0002 Stationary
∆lncalcium ‒3.988 ‒1.711 0.0003 Stationary
∆lncarbohydrate ‒3.332 ‒1.725 0.0017 Stationary

Note: ∆lnnon-grain production, ∆lnenergy, ∆lnprotein, ∆lnfat, ∆lndietary fibre, ∆lncalcium, and ∆lncarbohydrate are variables after taking first-order difference.

3.4.2 Determining the optimal lag order

In order to establish the VAR model, this study selected five information criteria, LL, LR, AIC, HQIC and SBIC, in order to determine the optimal lag order. Among these criteria, LL denotes the log-likelihood function; LR denotes the likelihood ratio test, where the joint significance of the coefficients of the last order is tested by the likelihood ratio test; AIC denotes the minimization information criterion; and HQIC is known as Hannan-Quinn information criterion, which is an improvement of the AIC criterion. HQIC, SBIC and AIC are the three most commonly used judgement criteria for determining the optimal lag order, and when these three criteria cannot be judged accurately, the LL and LR criteria are often used to assist in the judgement. In this study, the LR, AIC and HQIC information criteria tended to choose order 2 (Table 4), so the optimal lag order chosen in this study is a lag order of order 2 to establish the VAR (2) model.
Table 4 Selecting the optimal lag order
Lag LL LR AIC HQIC SBIC
0 519.781 - ‒37.9838 ‒37.8839 ‒37.6478*
1 561.252 82.941 ‒37.426 ‒36.6269 ‒34.7384
2 653.595 184.69* ‒40.6367* ‒39.1382* ‒35.5973

Note: Lag represents the order of lag; LL stands for logarithmic Likelihood function; LR stands for likelihood ratio test; AIC stands for minimum information criterion; HQIC stands for Hannan-Quinn information criterion, and SBIC stands for Bayesian information criterion. * represents the optimal lag time selected according to each evaluation criterion.

3.4.3 Cointegration tests

Since all the variables are single-integrated of the same order (first order), the Johansen cointegration test can be performed. In Table 5, comparing the values of the trace statistics with the 5% critical values for the seven variables of non-grain production, energy, fat, dietary fibre, protein, calcium and carbohydrates shows that the original hypothesis of “up to 3 cointegration” was rejected and the original hypothesis of “up to 4 cointegration” was accepted, so there are 4 cointegration variables and there are 4 cointegration relationships. This result indicates that there is a long-term stable equilibrium relationship between non-grain production and the other variables, which can pass the cointegration test.
Table 5 Johansen cointegration test results
Original assumption Eigenvalue Trace statistic 5% threshold
None - 265.1409 136.61
At most 1 0.96073 177.7311 104.94
At most 2 0.90643 113.7673 77.74
At most 3 0.87490 57.6442 54.64
At most 4 0.58962 33.5963* 34.55

Note: None represents the original hypothesis, and there is no cointegration relationship. * means accepting the original hypothesis at the significance level of 5%.

3.4.4 Stationarity test

The AR root test is mainly used to judge the stationarity of the VAR model. Figure 5 shows the distribution of the AR roots of the VAR (2) model. The results show that all eigenvalues are less than 1, and all points in Fig. 5 are in the unit circle, which indicates that the VAR model has good stability and its model results have a strong degree of confidence.
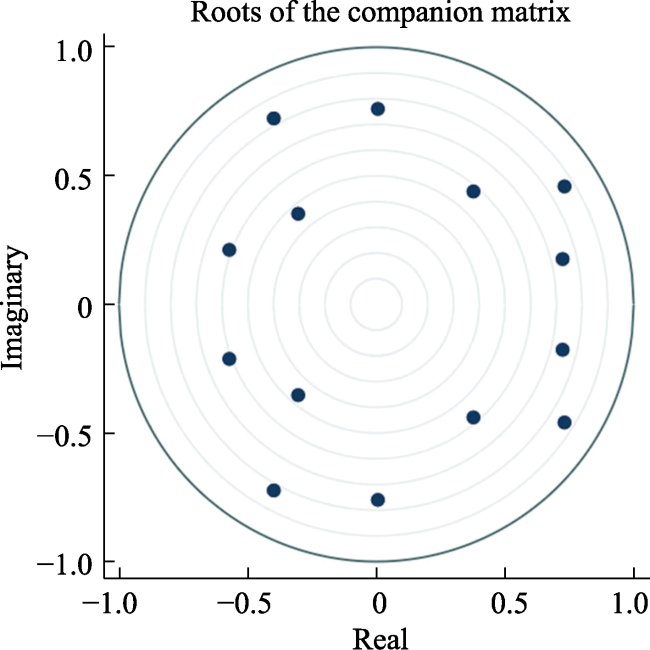
Fig. 5 AR stationarity test

3.4.5 Impulse response analysis

The impulse response diagram can directly reflect the dynamic changes in the responses of the explained variables to the system over time when the model is impacted. In order to comprehensively reflect the response relationships between non-grain production and the six dietary nutrients, this study selected 15 periods to carry out the impulse response analysis, and the results of the impulse response are shown in Fig. 6.
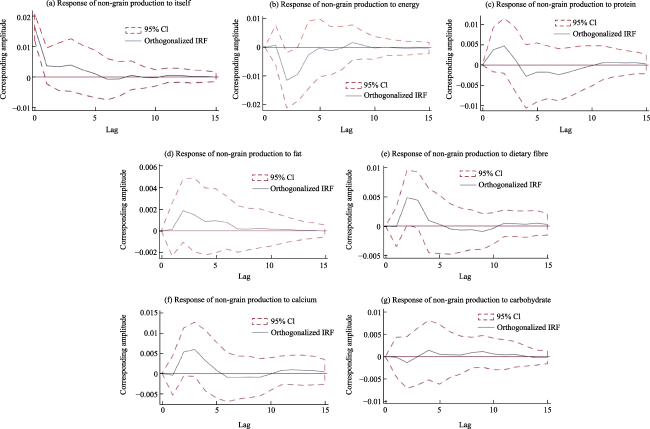
Fig. 6 Impulse responses of non-grain production to dietary nutrients

Note: In each graph, the horizontal coordinate is the number of lag periods, the vertical coordinate is the size of the response value, the solid line is the change trend of the response function, and the middle range of the dashed lines is the confidence interval. CI means confidence interval; IRF means impulse response function.

(1) Analysis of the impulse response of non-grain production to itself. The impulse response of non-grain production to itself was positive in the long term and negative in the short term, reaching its maximum value in the first period and then gradually tending to be flat, with the degree of influence gradually decreasing with the increase of the lag period. In the period 1 to 5, the impulse response of non-grain production to itself was positive, and after a positive-negative response change, it finally gradually tended toward zero after the 8th period. This initial obvious positive response shock may be due to the herd effect of non-grain production in rural communities, coupled with the drive of comparative returns, where farmers will consider taking similar non-grain actions. As the number of periods increases, farmers have a more rational and objective evaluation of non-grain production, and this rational thinking enables the farmers to make decisions independently without external influences, so the level of non-grain production gradually tends to stabilise.
(2) Analysis of the impulse response of non-grain production to dietary nutrients. 1) The impulse response of non-grain production to energy reached a negative maximum near the 2nd period, and then gradually disappeared after the 5th period. 2) The impulse response of non-grain production to protein fluctuated within the range of (from ‒0.005 to 0.005) before the 8th period, and the impulse response gradually slowed down after the 8th stage. 3) The impulse response of non-grain production to fat was mainly positive. The response fluctuated the most in the 2nd period, and gradually returned to 0 before and after the 7th period, which indicated that fat intake had a positive effect on non-grain production. 4) The impulse response of non-grain production to dietary fibre was mainly positive. It gradually tended to be flat after the 5th period, and finally converged to 0. 5) The impulse response of non-grain production to calcium reached its maximum value in the 3rd period, and then gradually decreased and tended to 0. 6) The impulse response of non-grain production to carbohydrate was relatively flat, and the response gradually disappeared after the 10th period. Overall, the impacts of protein, fat, dietary fibre and calcium on non-grain production were mainly positive. On one hand, dietary fibre mainly comes from fresh fruits and melons, which rises sharply in consumption and sown area during the study period, thus intensifying non-grain production; on the other hand, nutrients such as calcium, protein and fat usually come from the consumption of land-intensive animal food. Compared with plant food, the production of these foods requires more arable land resources. With the increase of animal food consumption, the degree of non-grain production is intensified.

3.4.6 Variance decomposition

Variance decomposition is used to reveal the relative proportions of the shocks for each variable by decomposing the variance of the different shock variables, so that the degrees of influence and contributions of the different variables can be ranked and compared. According to the results of variance decomposition in Table 6, from a quantitative point of view, the variance contribution rate of non-grain production was 100% in the 1st period and 42.11% in the 15th period, which indicates that the unreasonable land-use pattern itself will aggravate the degree of non-grain production. In period 2, the order of dietary nutrients based on their degree of variance contribution is: protein>energy>calcium>fat>carbohydrate and dietary fibre. After about period 5, the influence weights of energy, protein, fat, dietary fibre, calcium and carbohydrate stabilized at about 31%, 8%, 1%, 6%, 10% and 1%, respectively. From a trend perspective, the trend of change in each variable is relatively obvious in the period of 1 to 5, the contribution rate of non-grain production showed a decreasing trend in general, and the contribution degrees of dietary nutrients fluctuate and rise with an increase in the number of periods, and they gradually tend to stabilise after about 7 periods. This pattern shows that as the driving factor of non-grain production shifts from the initial self-causal driving factor to the other-causal driving factors, and the influence of upgrading the residents' dietary structure on the land use pattern of farm households gradually increases. The non-grain production itself has a large inertia, so it will be very difficult to deal with the non-grain problem when the non-grain production level is high. Overall, energy, protein, calcium intake have a relatively strong impact on non-grain production.
.
Table 6 Results of variance decomposition
Lag Non-grain production Energy Protein Fat Dietary fibre Calcium Carbohydrate
1 1 0 0 0 0 0 0
2 94.89 0.19 4.83 0.007 0.005 0.08 0.005
3 56.60 25.44 7.12 0.68 4.46 5.33 0.37
4 45.38 32.43 5.72 0.84 6.19 9.16 0.28
5 44.01 31.89 6.54 0.91 6.03 10.08 0.55
6 43.78 31.63 6.91 1.02 6.00 10.09 0.58
7 43.43 31.54 7.26 1.09 5.97 10.11 0.60
8 43.02 31.22 7.95 1.09 5.96 10.15 0.61
9 42.62 31.25 8.25 1.08 5.95 10.16 0.70
10 42.37 31.14 8.29 1.09 6.03 10.22 0.87
11 42.34 31.11 8.28 1.09 6.04 10.22 0.91
12 42.30 31.05 8.31 1.09 6.06 10.27 0.93
13 42.23 30.98 8.34 1.09 6.06 10.34 0.96
14 42.17 30.95 8.37 1.09 6.07 10.40 0.96
15 42.11 30.90 8.40 1.08 6.09 10.45 0.96

4 Discussion

Based on VAR model, this study analyzed the influences of upgrading the dietary structure of residents on non-grain production, which has reference significance for the control of cultivated land use and non-grain regulation from the concept of an all-encompassing approach to food. In this study, six kinds of dietary nutrients were used to characterize the dietary structure of residents. In future studies, more extensive lists of nutrients can be further selected to make the research conclusions more convincing. In addition, this study used data at the national level to carry out the research, without considering the specific conditions of each province and city, so the policy recommendations put forward may not be fully adaptable to the actual conditions of each region. Therefore, future studies can be carried out based on the actual dietary structures and the non-grain production of cultivated land in varied regions, in order to make the policy recommendations more geographically targeted. The current demand for cultivated land for grain is gradually approaching the upper limit of cultivated land resources (Zhu et al., 2023), so the sustainable use of cultivated land is facing a crisis (Ke, 2023). This discussion on the impact of upgrading the dietary structure of residents on non-grain production is of reference significance for expanding food sources and optimizing the allocation of arable land resources. Studies in this field can contribute to a win-win situation for diet and the environment (Scherer et al., 2019; Zhang et al., 2021a), which will contribute to the coupling and coordinated development of “diet-food security-arable land use” (Zhu et al., 2023).

5 Conclusions and policy recommendations

5.1 Conclusions

This study used the VAR model and time series data of residents' dietary structure from 1992 to 2021 to explore the mechanism of influence of the residents’ dietary structure upgrading on non-grain production, using the dietary structure variables of energy, protein, fat, dietary fibre, calcium, and carbohydrate contained in nine main foods such as grains, fresh vegetables, meat and productions, poultry, eggs, and fresh fruits and melons, and other foods. The main conclusions are as follows.
(1) From 1992 to 2021, the ratio of non-grain production to arable land showed a fluctuating upward trend, with an average value of 31.02%. During this period, the per capita food consumption has shifted from a singular consumption based on grains and fresh vegetables to a balanced food consumption based on “grains, vegetables, meat and fruits”. The dietary nutrient intake levels of residents varied greatly. The intake levels of protein, fat, dietary fibre and calcium fluctuated and increased, while the intake levels of energy and carbohydrates fluctuated and decreased. The intake changes in dietary nutrients contained in food were generally consistent with the trends of changes in the per capita food consumption structure.
(2) The impacts of protein, fat and calcium intake on the non-grain production are mainly positive, which means that land-intensive animal food consumption has a positive promoting effect on non-grain production. In addition, the non-grain production itself has a relatively large inertia, so non-grain is affected by its own scale, and in the case of a high level of non-grain production, the governance of the non-grain problem will be very difficult.
(3) According to the variance decomposition results, non-grain production in the first period was affected by its own fluctuation shocks, and then the degree of influence gradually decreased, while the influences of various types of dietary nutrients increased year by year. On the whole, the intake of energy, protein and calcium have a great impact on non-grain production.

5.2 Policy recommendations

(1) From the concept of an all-encompassing approach to food, according to the dietary structure needs of residents at the consumption side, the agricultural planting structure adjustment and arable land use control at the supply side should be carried out reasonably. Under the premise of ensuring food cultivation, widely promote sustainable agricultural production methods such as organic agriculture and ecological agriculture through policy guidance, and encourage farmers to appropriately grow special agricultural products that can meet market demand.
(2) A nutrition-oriented food production system and a sustainable food consumption structure for arable land should be established in accordance with the dietary habits of the residents and local agricultural production conditions. At the same time, it’s essential to promote the overall transformation of the agricultural production chain and dietary system, and reduce the resource and environmental effects of the food supply.
[1]
Chen Q, Kong X Z, Li S F, et al. 2016. Impact analysis of farm size on grain production—Based on rural household survey in China’s 13 major grain producing areas. Hebei Academic Journal, 36(3): 122-128. (in Chinese)

[2]
Chen Q R, Xie H L. 2022. The causes, challenges, and countermeasures of “non grain conversion” of cultivated land. Land Science Dynamics, (2): 6-9. (in Chinese)

[3]
Dong J J, Zhao Y, Wang C Y, et al. 2019. Land demands for food consumption in Beijing during 1980-2016. Resources Science, 41(7): 1350-1358. (in Chinese)

DOI

[4]
Franco C C, Rebolledo-Leiva R, González-García S, et al. 2022. Addressing the food, nutrition and environmental nexus: The role of socio-economic status in the nutritional and environmental sustainability dimensions of dietary patterns in Chile. Journal of Cleaner Production, 379(1): 134723. DOI: 10.1016/j.jclepro.2022.134723.

[5]
Frehner A, Cardinaals R P M, de Boer I J M, et al. 2022. The compatibility of circularity and national dietary recommendations for animal products in five European countries: A modelling analysis on nutritional feasibility, climate impact, and land use. The Lancet Planetary Health, 6(6): e475-e483.

DOI

[6]
Gao L W, Xu Z R, Cheng S K, et al. 2017. Arable land requirements related food consumption pattern: A case study in Lhasa, Xigaze and Shannan region of rural Tibet. Journal of Natural Resources, 32(1): 12-25. (in Chinese)

[7]
Gerbens-Leenes W, Nonhebel S. 2005. Food and land use: The influence of consumption patterns on the use of agricultural resources. Appetite, 45(1): 24-31.

PMID

[8]
Han J Y, Qu J S, Xu L, et al. 2020. Study on the dynamic impact mechanism of upgrading food consumption structure on agricultural carbon emissions. Chinese Journal of Agricultural Resources and Regional Planning, 41(6): 110-119. (in Chinese)

[9]
He G H, Zhao Y, Wang L Z, et al. 2019. China’s food security challenge: Effects of food habit changes on requirements for arable land and water. Journal of Cleaner Production, 229: 739-750.

DOI

[10]
Huang G R. 2020. Study on sustainable self-sufficiency of cultivated land and water resources for rational diet in China. Diss., Beijing, China: Peking University. (in Chinese)

[11]
Ke X L. 2023. Innovative exploration of cultivated land use transformation research—Review of sustainable intensification of cultivated land use: Theoretical exploration and multi-scale demonstration. China Land Science, 37(3): 126-128. (in Chinese)

[12]
Liang S M, Meng Z, Bai S. 2008. Study on the change of agricultural planting structure in China based on village level survey. Issues in Agricultural Economy, 29(S1): 26-31. (in Chinese)

[13]
Lin X M. 2006. Human nutrition. Beijing, China: Peking University Medical Press. (in Chinese)

[14]
Liu H L, Gao F. 2016. The risk of agricultual land transfer in rural chinamanifestation, cause and its generation mechanism. Chinese Journal of Agricultural Resources and Regional Planning, 37(1): 99-105, 130. (in Chinese)

[15]
Luo B L, Jiang X P, Li S P, et al. 2018. Will the transfer of agricultural land lead to “non-grain” planting structure. Academic Journal of Jianghai, (2): 94-101, 238. (in Chinese)

[16]
Ma E P, Ye W Y, Liao L W, et al. 2022. Human-land coupling enlightenment and driving forces of urban food system evolution: A case study of Beijing food system. Journal of Natural Resources, 37(10): 2617-2635. (in Chinese)

DOI

[17]
Scherer L, Behrens P, Tukker A. 2019. Opportunity for a dietary win- win-win in nutrition, environment, and animal welfare. One Earth, 1(3): 349-360.

DOI

[18]
Tang H J, Li Z M. 2012. Study on per capita grain demand based on Chinese reasonable dietary pattern. Scientia Agricultura Sinica, 45(11): 2315-2327. (in Chinese)

[19]
Wang R J, Wu L R, Yan F. 2019a. Variation characteristics of land resources carrying capacity in Ordos fieldspathic sandstone area based on man grain relationship. Bulletin of Soil and Water Conservation, 39(6): 142-148, 154. (in Chinese)

[20]
Wang W, Yan H M, Yang Y Z, et al. 2019b. Evaluation of land resources carrying capacity of Tibetan countiesbased on dietary nutritional demand. Journal of Natural Resources, 34(5): 921-933. (in Chinese)

DOI

[21]
Wang Z W, Chen H Y, Zhu X H. 2023. Regional differences and health effects of dietary patternin Chinese residents. Scientia Geographica Sinica, in press. DOI: 10.13249/j.cnki.sgs.2022.08.000000. (in Chinese)

[22]
Xin L J. 2021. Dietary structure upgrade of China’s residents international trade and food security. Journal of Natural Resources, 36(6): 1469-1480. (in Chinese)

DOI

[23]
Xin L J, Wang J Y, Wang L X. 2015. Prospect of per capita grain demand driven by dietary structure change in China. Resources Science, 37(7): 1347-1356. (in Chinese)

[24]
Yan D H, Wu S H, Tang Y S, et al. 2022. Arable land and water footprints for food consumption in China: From the perspective of urban and rural dietary change. Science of the Total Environment, 838: 155749. DOI: 10.1016/j.scitotenv.2022.155749.

[25]
Yu H R, Du P F. 2022. Impact of urban and rural dietary pattern changes on cultivated land: Based on food consumption data of urban and rural residents in china from 1981 to 2019. China Land Science, 36(8): 98-108. (in Chinese)

[26]
Zhai F Y, Wang H J, Wang Z H, et al. 2006. Trend of dietary and nutritional status among Chinese residents and policy suggestions. Food and Nutrition in China, (5): 4-6. (in Chinese)

[27]
Zhang C L, Qiang W L, Niu S W, et al. 2021a. Options of Chinese dietary pattern based on multi-objective optimization. Resources Science, 43(6): 1140-1152. (in Chinese)

[28]
Zhang H Z, Song W, Zhang W X, et al. 2021b. Analysis of spatial differentiation characteristics and influencing factors of non-grain cultivated land in Shandong Province. China Land Science, 35(10): 94-103. (in Chinese)

[29]
Zhang Q, Qu X T, Wei C. 2014. A study of “non-grain production”of family farms in the background of grain security. Southeast Academic Research, (3): 94-100, 247. (in Chinese)

[30]
Zhu Y Y, Wang Z W, Zhu X H. 2023. New reflections on food security and land use strategies based on the evolution of Chinese dietary patterns. Land Use Policy, 126: 06520. DOI: 10.1016/j.landusepol.2022.106520.

Outlines

/