Tourism Industry and Sustainable Development

Tourism Carbon Emission Forecasting, the Decoupling Effect and Its Driving Factors in the Yangtze River Economic Belt under the “Double Carbon” Target

  • HE Yan , 1, 2 ,
  • WANG Liguo , 1, 2, * ,
  • ZHU Hai 1, 2 ,
  • SONG Wei 1, 2 ,
  • ZHAN Xinyue 1, 2
Expand
  • 1. Rural Tourism Development Research Center, School of Land Resources and Environment, Jiangxi Agricultural University, Nanchang 330045, China
  • 2. Nanchang Rural Tourism Development Research Center, Nanchang 330045, China
* WANG Liguo, E-mail:

HE Yan, E-mail:

Received date: 2022-08-11

  Accepted date: 2023-01-30

  Online published: 2023-10-23

Supported by

The Humanities and Social Sciences of Ministry of Education Planning Fund(21YJAZH085)

The National Natural Science Foundation of China(42261038)

Abstract

By establishing an extended STIRPAT model, different scenarios were set up to predict the future tourism carbon emissions of the Yangtze River Economic Belt. The Tapio decoupling model and LMDI decomposition method were combined to analyze the decoupling effect and factors driving tourism carbon emissions in the historical and future periods of the Yangtze River Economic Belt. The results show that from 2000 to 2019, the carbon emissions of tourism in the Yangtze River Economic Belt exhibited a sustained growth trend and then a downward trend, and the overall spatial pattern was ‘low in the central region and high in the east and west’. In the different scenarios, the carbon emissions of tourism in the Yangtze River Economic Belt in the future show a trend of increasing at first and then decreasing, with peaks in different periods. In the historical period, the decoupling state of carbon emissions in the Yangtze River Economic Belt was mainly weak decoupling. Under the benchmark scenario, the decoupling of carbon emissions in the future tourism industry will not reach a strong decoupling state, while under the medium and low-carbon scenarios, strong decoupling will be achieved in different periods. Carbon emission intensity is the main factor in promoting the decoupling of tourism carbon emission in the historical period, while carbon emission intensity and investment efficiency are the main factors driving decoupling in the future. Accordingly, low-carbon development strategies are proposed for tourism in the Yangtze River Economic Belt.

Cite this article

HE Yan , WANG Liguo , ZHU Hai , SONG Wei , ZHAN Xinyue . Tourism Carbon Emission Forecasting, the Decoupling Effect and Its Driving Factors in the Yangtze River Economic Belt under the “Double Carbon” Target[J]. Journal of Resources and Ecology, 2023 , 14(6) : 1329 -1343 . DOI: 10.5814/j.issn.1674-764x.2023.06.020

1 Introduction

With the rapid development of the world economy, the use of fossil energy continues to increase, and the emission of CO2 continues to rise, resulting in global warming. In the process of economic development, reducing greenhouse gas emissions and reasonably coordinating the relationship between economic growth and energy consumption are essential measures for achieving sustainable economic development. In September 2020, China formally put forward the “double carbon” goal of achieving both the carbon peak before 2030 and carbon neutrality before 2060, and issued a series of policies and measures at the national and local levels to promote the development of a low carbon economy. With the vigorous development of tourism, modern tourism no longer adheres to the traditional concept of a “smokeless industry” (Tang et al., 2014). According to the statistics of the World Tourism Organization, global tourism carbon emissions have accounted for 5%-14% of all human carbon emissions (UNWTO-UNEP-WMO, 2008; Jin, 2021). China is an important international tourist destination and source country, and the development of its tourism industry is very rapid. The six elements of food, housing, transportation, tourism, shopping, and entertainment involve many fields, and the resulting carbon dioxide emissions cannot be ignored. Clarifying the relationship between tourism growth and carbon dioxide emissions is particularly important for the low-carbon development of tourism (Zha et al., 2022a).
As an essential national development strategy area, the Yangtze River Economic Belt is rich in natural and artificial tourism resources, a large-scale tourism industry, and rapid tourism development, so it plays an important supporting role in China’s tourism economy. However, the growth of the tourism economy is bound to be accompanied by a continuous increase in energy consumption, thereby intensifying energy carbon emissions and negatively impacting the environmental resources and the sustainable development of tourism in the Yangtze River Economic Belt. The Yangtze River Economic Belt is a leading demonstration zone of national ecological civilization construction, and its high-quality and sustainable economic development are crucial. Alleviating the contradiction between tourism development and carbon dioxide emissions is an important part of realizing the low-carbon development and sustainable development of tourism in the Yangtze River Economic Belt, and it is also one of the critical driving forces in promoting China’s early realization of the “double carbon” goal. Therefore, in order to achieve the low-carbon sustainable development of tourism in the Yangtze River Economic Belt it is of great practical and theoretical significance to clarify the decoupling relationship and the driving factors between tourism growth and carbon emissions in the historical and future periods through an analysis of the statistics and predictions of carbon emissions in the Yangtze River Economic Belt.

2 Literature review

In recent years, the development of low-carbon tourism has become a major focus of academic attention, and tourism carbon emissions are the key research content that cannot be ignored in the development of low-carbon tourism. Since the ‘double carbon’ “double carbon” goal was put forward, scholars have been paying more attention to the issues of tourism carbon emissions. The development of tourism inevitably produces some carbon emissions, so the continuous increase of the tourism economy and the joint promotion of reducing carbon emissions are facing significant challenges, which have also become the focus of academic attention.
The current research by domestic and foreign scholars on tourism carbon emissions mainly focuses on calculating tourism carbon emissions, predicting the factors that influence carbon emissions, and the decoupling effect. The existing research mainly measures the carbon emissions of tourism from the perspectives of the whole country (Wu and Shi, 2011; Meng et al., 2016), different regions (Xie and Zhao, 2012; Han and Wu, 2016), scenic spots (Yao et al., 2017), or different provinces and cities (Liu et al., 2011; Wu et al., 2015), as well as for the overall tourism industry (Meng et al., 2016), and tourism transportation (Huang et al., 2017; Jamnongchob et al., 2017). The calculation of carbon emissions is also the basis for predicting the carbon emissions of tourism in the future. Scholars mostly use ‘bottom-up’ (Kuo and Chen, 2009; Shi and Wu, 2011; Yao and Chen, 2016; Sun, 2020) or ‘top-down’ (Surugiu et al., 2012; Huang et al., 2021) methods to calculate the carbon emissions of tourism. The “bottom-up” approach is based on life cycle theory and is mostly used to measure carbon emissions from different consumption areas such as “food, accommodation, transportation, tourism, shopping and entertainment” in the tourism industry on a smaller spatial scale. The “top-down” approach is based on input-output theory and is mainly used in the production perspective of tourism, using the stripping factor method to separate tourism carbon emissions from the total carbon emissions on a larger scale, such as at the national and regional levels.
In the context of the “double carbon” goal, the research on the carbon peak and carbon neutralization of tourism cannot be separated from the prediction of carbon emissions. The existing research has produced relatively few predictions for the carbon emissions of tourism. For example, Tóffano et al. (2020) used scenario analysis to predict the carbon footprint of tourism accommodation in the 2030 FIFA World Cup. Dubois and Ceron (2006) used scenario analysis to predict the carbon emissions of tourism in France, and they analyzed the factors affecting carbon emissions by building a computer model of family tourism and leisure travel. Tang et al. (2021) predicted China’s future tourism carbon emissions from different scenarios using the Kaya identity. Li and Wang (2016) used the grey prediction model to predict the carbon emissions of tourism in Guangdong Province in the subsequent five years, and analyzed the future trends of the carbon emissions of tourism.
The driving effect of tourism economic growth on carbon emissions has also been a subject of heated discussion in academia. Scholars at home and abroad have analyzed various factors that affect tourism carbon emissions through different methods. Common research methods include the LMDI decomposition method (Robaina-Alves et al., 2016), STIRPAT model (Tang and Li, 2019), Kaya identity (Tang et al., 2017), IPAT model (Liu and Yue, 2021), panel data econometric estimation model (Zha et al., 2017), spatial econometric model (Guo et al., 2022), and various others. Decoupling theory was first proposed by the OECD, and Tapio applied it to analyze the relationship between the transportation economy and carbon emissions (Tapio, 2005). Since then, scholars have increasingly used the decoupling model to analyze the decoupling effect of carbon emissions.
In recent years, academics have engaged in rich discussions on decoupling tourism carbon emissions. Zhao and Zhu (2013) took Hunan as the research object and used a decoupling model to analyze the decoupling state of tourism carbon emissions and tourism development for the first time. Tang et al. (2014) used a decoupling model to analyze the decoupling relationship between China’s overall tourism economy and carbon emissions. Wang et al. (2018) used the Tapio index model to analyze the decoupling relationship between the tourism economy and carbon emissions in Xinjiang Province. Based on the analysis of the decoupling relationship between tourism carbon emissions and the tourism economy, scholars can further study the factors driving the decoupling relationship. For example, Zha et al. (2022b) used the Tapio index model and LMDI decomposition method to measure the decoupling relationship and driving factors between tourism growth and carbon emissions in Chengdu, and introduced the IAA method to analyze the interactions between the driving factors. Weng et al. (2021) used the decoupling model to analyze the decoupling effect of tourism carbon emissions in 30 provinces of China, combined it with the LMDI method to analyze the factors affecting the decoupling effect, and concluded that the scale of tourists and technical level had the most significant impacts. Zha et al. (2022a) combined the LMDI decomposition method with the Tapio decoupling model to analyze the relationship between tourism growth and carbon emissions in Chengdu and its driving factors, and used the VAR model to analyze the dynamic interactions between the decoupling indicators.
In summary, domestic and foreign scholars have generated relatively rich estimates of tourism carbon emissions, and have also explored the decoupling effect of tourism carbon emissions and its driving factors. However, the scale of tourism investment has been neglected in the exploration of driving factors. Furthermore, the prediction of future carbon emissions in a certain region, specifically for the tourism industry in the Yangtze River Economic Belt, is still relatively lacking. The prediction of future tourism carbon emissions in this Belt is of certain significance for promoting the realization of China’s “double carbon” goal. Therefore, in this study, the ‘top-down’ method was used to calculate the carbon emissions of the tourism in the Yangtze River Economic Belt from 2000 to 2019, an extended STIRPAT model and ridge regression model was constructed, and the carbon emissions of the tourism industry in the Yangtze River Economic Belt from 2020 to 2060 were predicted based on scenario analysis. Using the Tapio decoupling index model and combining it with the LMDI decomposition method, the decoupling relationship between the tourism economy and the tourism carbon emissions and its driving factors in the historical period (2000-2019) of the Yangtze River Economic Belt and the future period were analyzed under different situations and development strategies are put forward.

3 Data sources and research methods

3.1 Data sources

Nine provinces and two municipalities in the Yangtze River Economic Belt were selected as the research objects. Considering the availability of data, 2000-2019 was chosen for the study interval. The energy-related data came from “China Energy Statistics Yearbook 2001-2020”; the socio-economic data were derived from the statistical yearbooks of 11 provinces (municipalities) in the Yangtze River Economic Belt and the statistical bulletins on national economic and social development. The reference basis of the carbon emission predictions came from the “the 14th Five-Year Plan” for the different industries in each province.

3.2 Calculation of tourism carbon emissions

According to the energy classification standard of IPCC, 15 kinds of energy terminal consumption were selected, such as raw coal, crude oil, diesel, natural gas, heat, electricity, and others. Using the tourism development coefficient of each province and city, the stripping coefficient method (Han and Wu, 2016) was used to strip the tourism energy consumption of the 11 provinces (municipalities) from the energy consumption of the related industries in the tertiary industry.
The formula for that calculation is:
${{E}_{it}}={{E}_{i}}\times {{R}_{t}}$
where Eit represents the total energy consumption of tourism; i represents tourism-related industries such as transportation, warehousing and postal services, wholesale and retail, accommodation and catering; Ei represents end-use consumption of energy type i in tourism-related industries such as transportation, storage, postal services, wholesale and retail trade, and accommodation and food services; Rt represents the t-year tourism development coefficient, referring to Huang et al. (2019). The energy consumption of category z in the tourism industry was stripped from the tertiary industry z energy end-use consumption Eiz by calculating the share of total tourism revenue in the gross tertiary sector.
Based on the calculation of tourism energy consumption, the tourism carbon emissions were then calculated as:
${{C}_{t}}=\sum\limits_{i=1}^{n}{{{E}_{it}}{{f}_{z}}k}$
$C=\sum{{{C}_{t}}}$
where Ct is carbon emissions from tourism in 11 provinces (municipalities) in year t; C is the total carbon emissions of tourism in the Yangtze River Economic Belt; fz is the conversion coefficient of type z energy standard coal; and k is the CO2 emission per unit of standard coal. Referring to existing research, the value of k is set to 2.45 (Chen and Zhu, 2009).

3.3 Carbon emission prediction of the tourism industry

3.3.1 STIRPAT model

The scalable random environmental impact assessment (STIRPAT) model was used to predict the future carbon emissions of tourism in the Yangtze River Economic Belt, with 2019 as the base year and 2020-2060 as the specific prediction period. Its expression is:
$I=a\times {{P}^{b}}\times {{A}^{c}}\times {{T}^{d}}\times e$
$\ln I=\ln a+b\ln P+c\ln A+d\ln T+\ln e$
where I represents tourism carbon emissions; P represents the number of tourists; A represents tourism income; T represents tourism carbon emission intensity; a represents a constant term; e represents the random error term; and b, c and d represent coefficients which mean that when P, A and T change by 1%, I changes by b%, c% and d%, respectively.
The STIRPAT model can introduce other influencing factors according to the research needs (Wang and Wang, 2017), and tourism investment plays a vital role in the development of tourism (Su and Sun, 2017). Therefore, the scale of tourism investment was introduced into STIRPAT model, and the expanded expression is:
$\ln I=\ln a+b\ln P+c\ln A+d\ln T+j\ln F+\ln e$
where F represents the tourism investment; and j represents the coefficient.
The ridge regression method was used to fit the extended STIRPAT model in order to avoid the problem of multiple collinearities between the various factors that affect the results, and to improve the reliability and accuracy of estimations of the unknown parameters. Ridge regression analysis was carried out based on formula (6), with lnI as the dependent variable, and lnP, lnA, lnT and lnF as independent variables. The specific coefficients and constants were obtained, which were then transformed into exponential function equations. In order to test the accuracy of the equation, the data of each variable from 2000 to 2019 were substituted into the exponential function equation. The error of carbon emissions calculated by the prediction model was small (see Table 1). Therefore, this model could predict the future carbon emissions of tourism in the Yangtze River Economic Belt.
Table 1 Prediction model of future tourism carbon emissions in the 11 provinces (municipalities) in the Yangtze River Economic Belt
Province Predictive model expression Relative
error rate (%)
Anhui $I={{e}^{3.060+0.484\times lnP+0.404\times lnA+0.918\times lnT+0.121\times lnF}}$ 2.36
Hubei $I={{e}^{2.313+0.276\times lnP+0.436\times lnA+0.780\times lnT+0.210\times lnF}}$ 3.17
Hunan $I={{e}^{2.033+0.273\times lnP+0.528\times lnA+0.895\times lnT+0.164\times lnF}}$ 4.07
Jiangxi $I={{e}^{2.437+0.371\times lnP+0.466\times lnA+0.810\times lnT+0.147\times lnF}}$ 4.40
Zhejiang $I={{e}^{3.473+0.460\times lnP+0.342\times lnA+0.735\times lnT+0.139\times lnF}}$ 2.16
Jiangsu $I={{e}^{2.975+0.450\times lnP+0.356\times lnA+0.867\times lnT+0.213\times lnF}}$ 2.18
Shanghai $I={{e}^{-0.020+0.062\times lnP+0.349\times lnA+0.680\times lnT+0.708\times lnF}}$ 1.90
Guizhou $I={{e}^{1.625+0.162\times lnP+0.533\times lnA+0.719\times lnT+0.222\times lnF}}$ 5.25
Sichuan $I={{e}^{2.066+0.291\times lnP+0.510\times lnA+0.613\times lnT+0.142\times lnF}}$ 4.05
Yunnan $I={{e}^{2.657+0.457\times lnP+0.414\times lnA+0.932\times lnT+0.176\times lnF}}$ 2.86
Chongqing $I={{e}^{1.825+0.282\times lnP+0.442\times lnA+0.825\times lnT+0.244\times lnF}}$ 3.22

Note: The meaning of the variable is consistent with Formulas (4) and (5).

3.3.2 Scenario approach

Scenario analysis is used to describe the possible scenarios in the future by speculation. The factors that affect the future development trend are the main reasons for the changes in the future scenarios, so the state of the influencing factors is the decisive factor in the development trend and direction of the future scenarios (Tian, 2008). To obtain the three different scenarios of benchmark, medium and low carbon for the tourism carbon emissions in this study, different future rates of change were set for the four factors of the number of tourists, tourism income, tourism investment in fixed assets and tourism carbon emission intensity. The rates of changes in these influencing factors were set based on the relevant policy content, relevant literature and general social development laws of the government of the whole country and the Yangtze River Economic Belt. The specific settings for each of the four are as follows.
(1) The rate of change in the number of tourists. The rate of change in the number of tourists for 2020-2025 was set according to the relevant planning contents for the number of tourists in the “14th Five-Year Plan” tourism planning of the provinces (municipalities). Taking Jiangsu Province as an example, the “Jiangsu Province ‘14th Five-Year’ Cultural and Tourism Development Plan” proposes that the number of tourists in Jiangsu Province will reach about 1.1 billion in 2025 and 884 million in 2019. Thus, the average annual rate of change in the number of tourists in Jiangsu Province from 2020 to 2025 was set at 4%. Similarly, the rates of change in the tourism populations in the 10 other provinces (municipalities) from 2020 to 2025 were also set (Table 2). The rates of change after 2025 mainly refer to Zhou (2018) in an article which forecasted China’s future population. In 2033, China’s population will grow to its peak (about 1.446 billion people), and by 2050 the national population will decline steadily to about 1.436 billion people. Thus, the annual average rate of change in the number of tourists in 2026-2033 was set at 0.18%, and the annual average rate of change in the number of tourists in 2034-2060 was set at -0.04%.
Table 2 Setting the rates of change in the numbers of tourists in the 11 provinces (municipalities) from 2020 to 2025
Province Rate of change (%)
Anhui 6.57
Hubei 5.00
Hunan 5.50
Jiangxi 4.00
Zhejiang 5.70
Jiangsu 4.00
Shanghai 6.57
Guizhou 10.00
Sichuan 6.57
Yunnan 3.00
Chongqing 6.57
(2) The rate of change in tourism income. Due to the uncertainty of changes in tourism income, the GM(1,1) grey prediction model was used to predict the rate of change in tourism income. The grey prediction model has higher accuracy than other prediction methods, and the existing research primarily uses this model for prediction research (Akay and Atak, 2007).
(3) The rate of change in fixed asset investments in tourism. In the process of tourism economic development, tourism investment also plays a vital role, and the role of tourism fixed asset investment in the development of tourism in the future will be indispensable (Su and Sun, 2017). In this study, its setting was based on the relevant contents of “the 14th Five-Year Plan” service industry planning of the provinces (municipalities). However, only Anhui, Hubei, and Henan provinces have the reference values for the rate of change in the tertiary industry’s fixed asset investment. Therefore, the average annual rate of the change in fixed asset investment in the overall tertiary industry of the relevant provinces of 9% was used as the average annual rate of change in the tourism fixed asset investment in each province (municipality) from 2020 to 2025. The rates of change in other years are shown in Table 3.
Table 3 Setting of the rates of change in the fixed asset investments in tourism in the Yangtze River Economic Belt from 2020 to 2060
Year Rate of change (%) Setting basis
2020-2025 9.0 According to the setting of the rate of change for the investment in fixed assets of the tertiary industry in the “14th Five-Year Plan” of the service industry in different provinces, such as Anhui, Hubei and Henan, the average value of 9% was taken as the annual average rate of change in the tourism fixed asset investment in 2020-2025
2026-2030 7.5
2031-2035 6.0
2036-2040 4.5
2041-2045 3.0
2046-2060 1.5
(4) Rate of change in the carbon emission intensity of tourism. There is no relevant parameter for the carbon emission intensity of tourism in “the 14th Five-Year Plan” of each province (municipality). However, “The Five-Year Plan and the Outline of Vision 2035” requires an 18% reduction in carbon dioxide emissions per unit of GDP within five years, which represents an average annual reduction of 3.6%. Tang et al. (2021) set the rates of change for the carbon emission intensity of China’s tourism industry in the benchmark scenario as -2.5%, energy saving scenario as -3.25%, and low-carbon scenario as -3.5%. Referring to these settings, the rates of change in the tourism carbon emission intensity in the Yangtze River Economic Belt were set in this study as -2.5% in the benchmark scenario, -3.5% in the medium scenario and -4.5% in the low-carbon scenario.

3.4 Decoupling model

3.4.1 Tapio decoupling model

Decoupling can be used to reflect the relationships between tourism economic growth and carbon emissions in different regions. The OECD and Tapio models are the two main models used to analyze the decoupling state. Of the two, the OECD model appears to have an apparent deviation in the results due to the different selections of base time period (Lu et al., 2020), while the Tapio model is more stable, its effect is small and it provides an elastic analysis (Weng et al., 2021). Therefore, the Tapio model was used in this study to analyze the decoupling relationship between tourism economic development and carbon emissions in the Yangtze River Economic Belt. The specific decoupling status classification and evaluation criteria are shown in Table 4. Its expression is:
${{D}_{C,G}}=\frac{\Delta C/C}{\Delta G/G}$
where DC,G represents the decoupling index of tourism carbon emissions, $\Delta C$ represents the change value of tourism carbon emissions, $\Delta G$ represents the change value of tourism income, C represents the total carbon emissions of the tourism industry, and G represents the total revenue of the tourism industry.
Table 4 Decoupling state classification and standards
Type C G DC,G Decoupled state
Negative decoupling <0 >0 0<DC,G <1 Weak negative decoupling (WND)
>0 <0 <0 Strong negative decoupling (SND)
>0 >0 >1 Expansionary negative decoupling (END)
Decoupling >0 >0 0<DC,G <1 Weak decoupling (WD)
<0 <0 >1 Recessive decoupling (RD)
<0 >0 <0 Strong decoupling (SD)

Note: %ΔCC/C; %ΔG=ΔG/G.

3.4.2 Decoupling exponential decomposition model

The Kaya identity was first proposed by the scholar Yoichi Kaya (1990). It is now mostly used to analyze the factors influencing carbon emissions, and can be extended according to research needs. According to the Kaya identity, formula (1) is extended to:
C = z C C C I z × I z P × P F × F
where C is the carbon emissions from tourism, Iz is the carbon emissions from $z$ types of energy in tourism, $P$ denotes the number of tourists, F denotes the amount of investment in tourism. Let ${{\alpha }_{z}}=\frac{C}{{{I}_{z}}}$ represents the carbon emission intensity of the tourism industry, ${{\beta }_{z}}=\frac{{{I}_{z}}}{P}$ repre-sents the tourist consumption level, $\gamma =\frac{P}{F}~$ represents the tourism investment efficiency, and $\delta =F$ represents the tourism investment scale. The changes in carbon emissions from tourism in the Yangtze River Economic Belt in the base period 0 and t can be decomposed into:
$\begin{align} & \Delta C={{C}_{t}}-{{C}_{0}}=\underset{\text{z}}{\mathop \sum }\,\alpha _{\text{z}}^{\text{t}}\times \beta _{z}^{t}\times {{\gamma }^{t}}\times {{\delta }^{t}}-\underset{\text{z}}{\mathop \sum }\,\alpha _{\text{z}}^{0}\times \beta _{z}^{0}\times {{\gamma }^{0}}\times {{\delta }^{0}} \\ & \ \ \ \ \ \ =\Delta {{C}_{\alpha }}+\Delta {{C}_{\beta }}+\Delta {{C}_{\gamma }}+\Delta {{C}_{\delta }} \\ \end{align}$
where Ct represents the tourism carbon emissions in the t period, C0 represents the tourism carbon emissions in the base period, $\alpha _{z}^{t}$ represents the carbon emission intensity of z-type energy in tourism industry in t period, $\alpha _{z}^{0}$ represents the carbon emission intensity of $z$-type energy in the base period of tourism, $\beta _{z}^{t}$ represents the tourist consumption level of $z$-type energy in tourism industry in period t, $\beta _{z}^{0}$ represents the tourist consumption level of z-type energy in the base period of tourism, γ t represents the efficiency of tourism investment in the t period, γ 0 represents the investment efficiency of tourism in the base period, δ t represents the scale of tourism investment in t period, δ 0 represents the scale of tourism investment in the base period, ΔCα represents the carbon emission intensity effect of tourism in the Yangtze River Economic Belt, ΔCβ represents the effect of tourist consumption level in the Yangtze River Economic Belt, ΔCγ represents the effect of tourism investment efficiency in the Yangtze River Economic Belt, and ΔCδ represents the scale effect of tourism investment in the Yangtze River Economic Belt.
The Logarithmic Mean Divisia Index (LMDI) decomposition method has been widely used in the study of carbon emission factors, and its operability and adaptability have obvious advantages compared with other factor decomposition methods. Therefore, this study used the LMDI method to decompose tourism carbon emissions, and the expression is:
$\begin{aligned} \Delta C_{\alpha} & =\sum_{z} \frac{C_{z}^{t}-C_{z}^{0}}{\ln \left(C_{z}^{t}\right)-\ln \left(C_{z}^{0}\right)} \ln \left(\frac{\alpha_{z}^{t}}{\alpha_{z}^{0}}\right) \\ \Delta C_{\beta} & =\sum_{z} \frac{C_{z}^{t}-C_{z}^{0}}{\ln \left(C_{z}^{t}\right)-\ln \left(C_{z}^{0}\right)} \ln \left(\frac{\beta_{z}^{t}}{\beta_{z}^{0}}\right) \\ \Delta C_{\gamma} & =\sum_{z} \frac{C_{z}^{t}-C_{z}^{0}}{\ln \left(C_{z}^{t}\right)-\ln \left(C_{z}^{0}\right)} \ln \left(\frac{\gamma^{t}}{\gamma^{0}}\right) \\ \Delta C_{\delta} & =\sum_{z} \frac{C_{z}^{t}-C_{z}^{0}}{\ln \left(C_{z}^{t}\right)-\ln \left(C_{z}^{0}\right)} \ln \left(\frac{\delta^{t}}{\delta^{0}}\right) \end{aligned}$
where $C_{z}^{t}$ represents to the $z$-type energy carbon emissions of the tourism industry in period $t$, and $C_{z}^{0}$ represents to the $z$-type energy carbon emissions of the tourism industry in the base period.
Based on these considerations, the Tapio model and LMDI decomposition method were combined to study the factors driving the tourism carbon emission decoupling effect. The above formula (7) is decomposed and expressed as follows:
$\begin{align} & {{D}_{C,G}}=\frac{\Delta C/C}{\Delta G/G}=\frac{\Delta C}{C}\times \frac{G}{\Delta G}=\Delta C\times \frac{G}{C\times \Delta G} \\ & \ \ \ \ \ \ \ =\left( \Delta {{C}_{\alpha }}+\Delta {{C}_{\beta }}+\Delta {{C}_{\gamma }}+\Delta {{C}_{\delta }} \right)\times \frac{G}{C\times \Delta G} \\ & \ \ \ \ \ \ \ =\frac{\Delta {{C}_{\alpha }}/C}{\Delta G/G}+\frac{\Delta {{C}_{\beta }}/C}{\Delta G/G}+\frac{\Delta {{C}_{\gamma }}/C}{\Delta G/G}+\frac{\Delta {{C}_{\delta }}/C}{\Delta G/G} \\ & \ \ \ \ \ \ \ ={{D}_{\alpha }}+{{D}_{\beta }}+{{D}_{\gamma }}+{{D}_{\delta }} \\ \end{align}$
where Dα represents the decoupling index of the carbon emission intensity effect of tourism, Dβ represents the decoupling index of the tourist consumption level effect, Dγ represents the decoupling index of the tourism investment efficiency effect, and Dδ represents the decoupling index of the tourism investment scale effect.

4 Empirical analysis

4.1 Calculation of carbon emissions from tourism in the Yangtze River Economic Belt

As shown in Fig. 1, the carbon emissions of tourism in the Yangtze River Economic Belt increased from 20.8032 million tons (Mt) in 2000 to 249.5454 Mt in 2019, for an average annual growth rate of 14.2%, which is a significant growth rate. Total tourism revenue increased from 341004 million yuan in 2000 to 10615881 million yuan in 2019, for an average annual growth rate of 20%. The total number of tourists increased from 516 million in 2000 to 8407 million in 2019, for an average annual growth rate of 16%. Per capita carbon emissions from tourism declined from 0.04 tons per person in 2000 to 0.03 tons per person in 2019, for an average annual growth rate of -1.4%; and the carbon emission intensity of tourism decreased from 0.61 in 2000 to 0.24 in 2019, for an average annual change rate of -4.8%. These data show that the continuous development of tourism is also accompanied by increasing carbon dioxide emissions, but the per capita tourism carbon emissions and carbon emission intensity are both declining. In the historical period, the Yangtze River Economic Belt generally showed a spatial pattern of ‘low in the middle and high in the east and west’. The carbon emissions of tourism in the western region were significantly higher than those in the central and eastern regions. Guizhou had the highest carbon emissions from tourism in the western region, and Shanghai had the highest carbon emissions from tourism in the eastern region. Guizhou is rich in tourism resources, and the implementation of the national ‘western development’ strategy led to the vigorous development of tourism, resulting in increased tourism carbon emissions. As China’s economic center city, Shanghai has a high level of tourism economic development and strong attraction of tourism resources, which leads to high tourism carbon emissions.
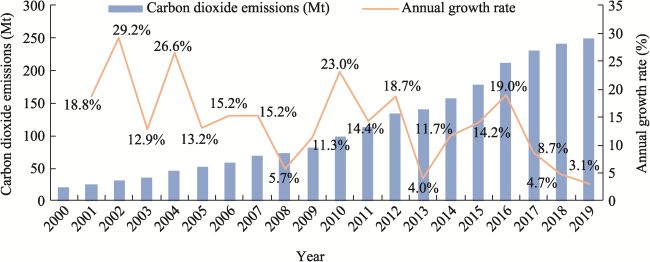
Fig. 1 Total carbon emissions and annual growth rate of tourism in the Yangtze River Economic Belt from 2000 to 2019
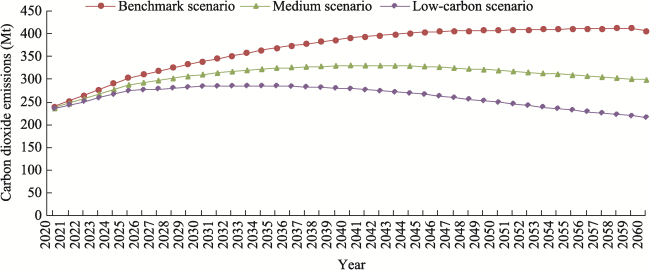
Fig. 2 Forecast of total carbon emissions from tourism in the Yangtze River Economic Belt in the future under the three scenarios
The annual growth rates of carbon emissions from tourism in the Yangtze River Economic Belt for each year from 2000 to 2019 show a continuous growth trend in the total carbon emissions from tourism. In 2008, the development of the tourism industry in the Yangtze River Economic Belt was affected by the economic crisis and the Wenchuan earthquake to a certain extent, with a growth rate of only 5.7% compared with the previous year, while the annual growth rate of the carbon emissions of the tourism industry has recovered since 2009. It can be said that 2013 was the beginning of the development of the Yangtze River Economic Belt. In September 2013, the Yangtze River Economic Belt officially became the fifth major strategic plan of the country, and the tourism industry has also been vigorously developed since then. According to the statistics, the carbon emissions of the tourism industry have been in a relatively stable growth period since 2013, but the annual growth rate has gradually decreased, which can reflect the excellent progress of energy conservation and emission reduction in the tourism industry to a certain extent.

4.2 Prediction of carbon emissions from tourism in the Yangtze River Economic Belt

According to the different settings of the carbon emission intensity rate of change in this study for the benchmark scenario (change rate -2.5%), medium scenario (change rate -3.5%) and low-carbon scenario (change rate -4.5%), the carbon emissions of tourism in the Yangtze River Economic Belt from 2020 to 2060 were forecasted, and the results for the three scenarios are shown in Fig. 2. 1) Under the benchmark scenario, the carbon emissions of the tourism industry in the Yangtze River Economic Belt will show a steady growth trend before 2059, and then decline after reaching a peak in 2059, which does not meet the requirements of China’s carbon peaking target before 2030. 2) In the medium scenario, the carbon emissions of the tourism industry in the Yangtze River Economic Belt will peak in 2040, and then show a gradual downward trend. The peak carbon emissions are lower than the benchmark scenario of 8.17826 Mt, and the growth rate of carbon emissions is lower than in the benchmark scenario. 3) Under the low-carbon scenario, the growth rate of tourism carbon emissions in the Yangtze River Economic Belt is the lowest, reaching a peak in 2035. The peak carbon emissions of 285.3342 Mt is lower than the benchmark scenario peak of 126.7954 Mt and lower than the medium scenario peak of 45.0129 Mt, and represents the greatest decline in carbon emissions from 2035.
This analysis shows that the development of tourism in the Yangtze River Economic Belt under the low-carbon scenario can achieve the best low-carbon development effect. If tourism is developed according to the benchmark scenario or the medium scenario, its development will seriously hinder the realization of China’s “double carbon” goal. However, under the low-carbon scenario, the emissions also failed to meet the country’s requirement of achieving a carbon peak by 2030. Therefore, the low-carbon process of tourism development in the Yangtze River Economic Belt still needs to be vigorously promoted. It is worth noting that due to the impact of COVID-19, the tourism industry in each province has been dramatically impacted, so the consumption demand of the tourism industry in the Yangtze River Economic Belt will inevitably be affected to a greater extent, which will lead to a decrease in carbon emissions from the tourism industry, and so the future carbon peak time of the tourism industry may be advanced. Tourism is a sensitive industry, and, there is substantial uncertainty about the impact of COVID-19 on the tourism industry in the Yangtze River Economic Belt in the post-epidemic era (Zha et al., 2021). However, China’s tourism market still has great potential, the Yangtze River Economic Belt has a strong tourism resource endowment, and the fundamentals of the Yangtze River Economic Belt tourism will not change in the long run, so tourism carbon emissions will continue to show a trend of sustained growth (Tang et al., 2021).

4.3 Analysis of the decoupling effect of tourism economic development and carbon emissions in the Yangtze River Economic Belt

4.3.1 Historical period (2000-2019)

The Tapio index model was used to measure the decoupling relationship between tourism economic development and carbon emissions in the Yangtze River Economic Belt in the historical period. The results (Table 5) show that in the historical period, the decoupling state of tourism carbon emissions and tourism economic development in the Yangtze River Economic Belt experienced two phases of expansionary negative decoupling and weak decoupling. The weak decoupling state lasted for a long time, indicating that the tourism economy in the Yangtze River Economic Belt had sustained growth for an extended period from 2000 to 2019, and its growth rate was faster than the growth rate of tourism carbon emissions. The decoupling state was mainly divided into two stages.
Table 5 Decoupling status of tourism economic development and carbon emissions in the Yangtze River Economic Belt in the individual years of the historical period
Period Decoupled state Period Decoupled state
2000-2001 END 2010-2011 WD
2001-2002 END 2011-2012 WD
2002-2003 END 2012-2013 WD
2003-2004 WD 2013-2014 WD
2004-2005 WD 2014-2015 WD
2005-2006 WD 2015-2016 WD
2006-2007 WD 2016-2017 WD
2007-2008 WD 2017-2018 WD
2008-2009 WD 2018-2019 WD
2009-2010 WD

Note: END, WD are defined in Table 4. The same below.

(1) From 2000 to 2003, there was a negative expansionary decoupling relationship between tourism carbon emissions and tourism economic growth in the Yangtze River Economic Belt. Both the tourism economy and carbon emissions were in a state of continuous growth, and the growth rate of carbon emissions was faster than that of the tourism economy. Tourism development was occurring at the cost of energy consumption, and the decoupling state was not ideal.
(2) From 2004 to 2019, there was a weak decoupling between tourism carbon emissions and tourism economic development in the Yangtze River Economic Belt at this stage, which was somewhat of an improvement compared with the previous stage. In 2004, the international economy had its fastest growing year in the past 30 years. With China’s accession to the WTO, China’s economy was vigorously developed while driving the growth of domestic tourism, and the tourism industry in the Yangtze River Economic Belt also entered a rapid growth phase. The promulgation of various energy saving and emission reduction measures in China has played a leading role in the green development of various industries. As a major strategic plan of the country, the protection of the ecological environment of the Yangtze River Economic Belt has become a major concern. The energy saving and emission reduction measures of tourism have been improving gradually, and the growth rate of carbon emissions is lower than that of tourism economic development.

4.3.2 Future period (2020-2060)

Based on the prediction data for tourism carbon emissions and tourism economic development in the Yangtze River Economic Belt under the different situations, the decoupling relationship between the two in the future was calculated. The results for the three scenarios are shown in Table 6.
Table 6 Decoupling status of tourism economic development and carbon emissions in the future Yangtze River Economic Belt under three scenario
Period The benchmark scenario The medium scenario The low-carbon scenario Period The benchmark scenario The medium
scenario
The low-carbon scenario
2019-2020 SND WND WND 2040-2041 WD SD SD
2020-2021 WD WD WD 2041-2042 WD SD SD
2021-2022 END WD WD 2042-2043 WD SD SD
2022-2023 END WD WD 2043-2044 WD SD SD
2023-2024 END WD WD 2044-2045 WD SD SD
2024-2025 END WD WD 2045-2046 WD SD SD
2025-2026 WD WD WD 2046-2047 WD SD SD
2026-2027 END WD WD 2047-2048 WD SD SD
2027-2028 END WD WD 2048-2049 WD SD SD
2028-2029 END WD WD 2049-2050 WD SD SD
2029-2030 END WD WD 2050-2051 WD SD SD
2030-2031 WD WD WD 2051-2052 WD SD SD
2031-2032 WD WD WD 2052-2053 WD SD SD
2032-2033 WD WD WD 2053-2054 WD SD SD
2033-2034 WD WD WD 2054-2055 WD SD SD
2034-2035 WD WD SD 2055-2056 WD SD SD
2035-2036 WD WD SD 2056-2057 WD SD SD
2036-2037 WD WD SD 2057-2058 WD SD SD
2037-2038 WD WD SD 2058-2059 WD SD SD
2038-2039 WD WD SD 2059-2060 WD SD SD
2039-2040 WD WD SD
(1) Under the benchmark scenario in the Yangtze River Economic Belt, the tourism carbon emissions will still be weakly decoupled from economic development in the future, failing to achieve a strong decoupling state. Moreover, from2019 to 2030, the decoupling state will be unstable, and there will be strong negative decoupling, weak decoupling and expansion negative decoupling, but mainly expansion negative decoupling, so the decoupling state is not ideal.
(2) In the medium scenario, the tourism economy and carbon emissions in the Yangtze River Economic Belt will mainly be weakly decoupled from 2019 to 2040, the growth rate of carbon emissions from tourism will decrease, and the growth of the tourism economy will be stable. The best state of strong decoupling will be achieved in 2041-2060, which will be an ideal period for the low-carbon transformation and development of tourism in the Yangtze River Economic Belt. However, there is still a large gap between this timing and China’s goal of achieving a carbon peak by 2030.
(3) Under the low-carbon scenario, the tourism economy and carbon emissions in the Yangtze River Economic Belt will be strongly decoupled from 2034 to 2060. This timing is close to China’s goal of peak carbon emissions by 2030, but greater efforts will still be needed to achieve this goal. Based on the low-carbon scenario setting, it will be necessary to reduce the setting of carbon emission intensity further, and the low-carbon development process of tourism in the Yangtze River Economic Belt needs to be advanced more rapidly and with higher quality.

4.4 Analysis of the factors driving the decoupling effect of tourism economic development and carbon emissions in the Yangtze River Economic Belt

The decoupling index model can only reflect the decoupling relationship between tourism economic growth and carbon emissions, but it cannot clarify the driving factors that form the decoupling relationship. Through a combination of the Tapio model and the LMDI decomposition method, the tourism carbon emission decoupling index of the Yangtze River Economic Belt can be decomposed into the carbon emission intensity effect, tourist consumption level effect, tourism investment efficiency effect and tourism investment scale effect. In this way, we can analyze the impacts of various factors on the decoupling of tourism carbon emissions in the Yangtze River Economic Belt in the historical period (see Fig. 3) and the future period under different scenarios (see Figs. 4, 5, and 6), and explore the factors driving the decoupling state.
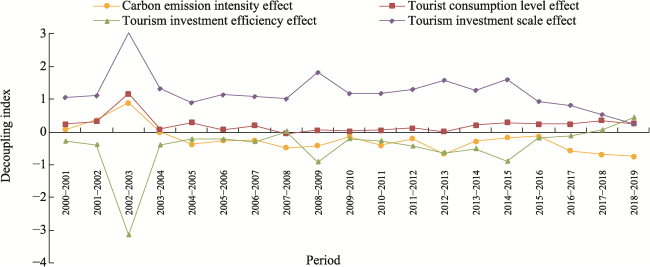
Fig. 3 Decoupling index of four carbon emission drivers in the Yangtze River Economic Belt from 2000 to 2019
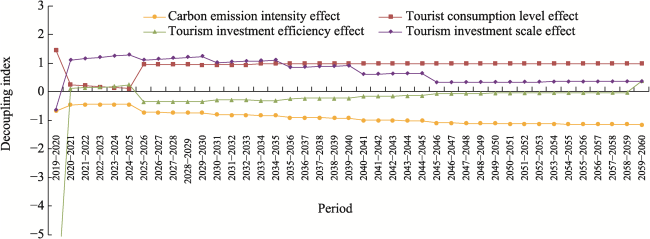
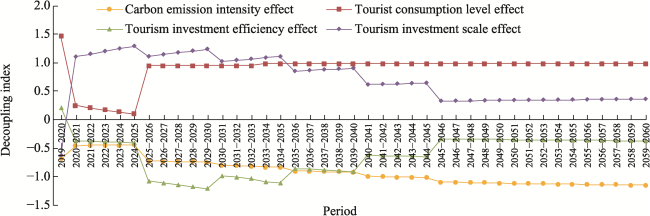
Fig. 4 Decoupling index of carbon emission drivers in the Yangtze River Economic Belt under the benchmark scenario
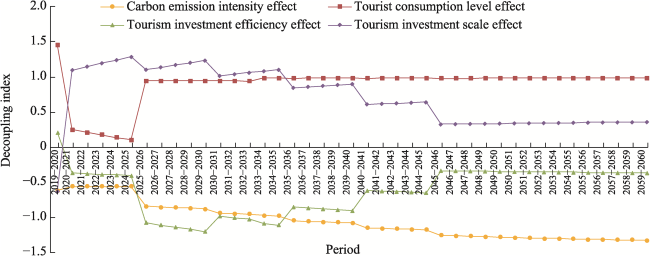
Fig. 5 Decoupling index of carbon emission drivers in the Yangtze River Economic Belt under the medium scenario
Fig. 6 Decoupling index of carbon emission drivers in the Yangtze River Economic Belt under the low-carbon scenario

4.4.1 Historical period (2000-2019)

The decoupling indices of carbon emission intensity effect, tourist consumption level effect and tourism investment scale effect increased significantly from 2000 to 2003, and all were positive (Fig. 3). This is the main reason for the expansion and negative decoupling of tourism carbon emissions during this period, which also reflects the continuous increase of carbon emissions that accompanies the growth of the tourism economy and the expansion of investment scale. During this period, the blind expansion of tourism investment in the region and the tourists’ poor environmental protection concept are the reasons for the unsatisfactory decoupling of the tourism industry. Reducing the carbon emission intensity to negative values from 2004 to 2019 was a critical factor in promoting the decoupling of carbon emissions from tourism in the Yangtze River Economic Belt. This change shows that during this period, the development of tourism in the Yangtze River Economic Belt no longer blindly pursued the expansion of scale, but more attention was being paid to energy conservation, emission reduction, and reduction of energy consumption while developing the tourism economy, and the tourists’ awareness of energy onservation and environmental protection was also gradually increasing. A decline in carbon emissions accompanied the economic growth of tourism, but there was still a large gap between the actual situation and the ideal state of strong decoupling, and the process of guiding the green and low-carbon development of tourism should be accelerated.

4.4.2 Future period (2020-2060)

The factors driving the decoupling state of future tourism carbon emissions and tourism economic development in the Yangtze River Economic Belt under different scenarios were calculated. The results are shown in Figs. 4-6.
(1) Under the benchmark scenario, the carbon emission intensity effect is negative and generally shows a downward trend (Fig. 4), so it is the main factor promoting the decoupling of tourism carbon emissions. The tourist consumption level effect and investment scale effect remain positive. Although there is a downward trend, the decline is slow, which has a certain inhibitory effect on the decoupling of tourism. The decoupling index of the tourism investment efficiency effect is generally on the rise. Most of the effects are negative in the early stage, but if the growth is too fast it can have a certain inhibitory effect. Although most of them are negative in the later stage, the impact is negligible. In the future development of tourism, more attention should be paid to the scientific rationalization of tourism investment, and rather than blindly expanding and reducing investment, the focus should be on the actual development of tourism to ensure the healthy development of tourism. Along with the development of tourism, we should continue to promote its low-carbon development, significantly reduce carbon emissions and energy consumption in the development of tourism, and actively guide the tourists’ own low-carbon travel awareness. Under the benchmark scenario, the future green and low-carbon development of tourism in the Yangtze River Economic Belt is far from meeting the country’s current requirements of achieving the “double carbon” goal.
(2) Under the medium and the low-carbon scenarios, the decoupling index changes of the four influencing factors are basically the same (Figs. 5 and 6). The visitor consumption level effects are the same in the medium and low-carbon scenarios as in the baseline scenario, both of which produce mainly suppressive effects, but the suppression is not significant in the early part of the study and starts to strengthen continuously in the middle and later part of the study. The possible reason for this trend is that tourist demand in the tourism industry in the early part of the future period remains at roughly the same level as in the historical period. However, with the continuous development of the social economy as well as the tourism industry, tourist demand continues to rise and the willingness to travel increases significantly compared to the early period, so if the low carbonization of tourist travel is not regulated, it may have a certain inhibiting effect on achieving the decoupling of carbon emissions from the tourism industry. The carbon emission intensity effect and the tourism investment efficiency effect are the key factors for promoting the formation of a strong decoupling state, and both remain negative. The effect of carbon emission intensity generally shows a downward trend, and the decline in carbon emission intensity in the low-carbon scenario is significantly higher than that in the medium scenario, which is also the main factor for achieving strong decoupling earlier than in the medium scenario. In addition, although the scale effect of tourism investment remains positive, it fluctuates greatly in the middle of the period and shows a ladder-like downward trend. This pattern may be due to the continuous development of tourism and the continuous expansion of the scale of tourism investment. It will reach a certain saturation, and then show a stage-like downward trend in the overall growth rate. By controlling the scale of tourism investment and ensuring the scientific and rational investment in tourism, it will also promote the strong decoupling of tourism as soon as possible.

5 Conclusions and countermeasures

5.1 Conclusions

By measuring the carbon emissions of tourism in the Yangtze River Economic Belt from 2000 to 2019, the extended STIRPAT model and scenario analysis were used in this study to predict the carbon emissions of tourism in the Yangtze River Economic Belt in the future period (2020-2060). In their research, Zha et al. (2022a) constructed a new model of tourism growth and a carbon emissions model, which combined the traditional Tapio decoupling model with the LMDI decomposition method to analyze the decoupling state of Chengdu’s tourism industry. The three factors of carbon emission intensity, tourism investment efficiency and investment scale were not included. Based on further research, the model used here includes four factors: carbon emission intensity, tourist consumption level, tourism investment efficiency and investment scale, to measure the decoupling of tourism economic development and carbon emissions in the Yangtze River Economic Belt in the historical and future periods, and to analyze its drivers, leading to four main conclusions.
(1) In the historical period, the carbon emissions of tourism in the Yangtze River Economic Belt increased year by year, with an average annual growth rate of 14.2%, and the growth rate was relatively fast, which is consistent with the existing research conclusions (Wang and Wang, 2021). On the other hand, tourism’s per capita carbon emission level shows a downward trend, with an average annual growth rate of -1.4%, but the rate of decline is relatively slow. The carbon emissions of tourism in the Yangtze River Economic Belt show a spatial pattern of ‘low in the middle and high in the east and west’, with high values in Guizhou and Shanghai. This is also consistent with the findings of the existing research, that the carbon emissions of tourism in the Yangtze River Economic Belt show a spatial pattern of “high in the east and west and low in the middle” (Hu et al., 2022a). This pattern may be due to the continuous advancement of the country’s ‘Western Development’ strategy and the high level of economic development in the eastern region itself, so these areas have many characteristic tourism resources, tourism is developing rapidly, and the resulting tourism carbon emissions are also growing.
(2) In the future period, the carbon emissions of tourism in the Yangtze River Economic Belt under the different scenarios will increase to a peak in a certain period and then begin to decline. Carbon emissions will peak in 2059 under the baseline scenario, in 2040 under the medium scenario, and in 2035 under the low-carbon scenario. Therefore, under different carbon intensity constraints, the carbon emissions of tourism in the Yangtze River economic belt can peak during different periods. The higher the carbon intensity constraint, the earlier the carbon emissions will peak. This is basically consistent with the prediction results of Chen et al. (2018) for the carbon peak of energy consumption in the Yangtze River Economic Belt. Although the carbon emissions of the tourism industry in the Yangtze River Economic Belt can peak in different periods under the three scenarios, none of them are able to achieve the peak target before 2030, so the low-carbon development process of the tourism industry needs to be promoted rapidly. As an important development strategy for China, tourism development in the Yangtze River Economic Belt will attract more and more attention. In the future, tourism development should insist on choosing a low-carbon development model and restrict the carbon emission intensity of tourism to a higher degree.
(3) During the historical period, the decoupling state between tourism economic development and carbon emissions in the Yangtze River Economic Belt shifted from expansionary negative decoupling to weak decoupling, which is consistent with the findings of existing research (Hu et al., 2022b). In the historical period, the decoupling state of tourism carbon emissions in the Yangtze River Economic Belt improved, but it still did not reach a strong decoupling state, indicating that the development of tourism cannot be separated from the dependence on energy consumption, and the process of low-carbonization in tourism development needs to be accelerated. In the future period, the prediction of the decoupling state of tourism carbon emissions indicates that under the benchmark scenario, it will still change from an expansionary negative decoupling to a weak decoupling, and the decoupling state is not ideal. Under the medium and low-carbon scenarios, the tourism industry can achieve strong decoupling in 2040-2041 and 2034-2035, respectively, and the decoupling status is significantly improved compared with the benchmark scenario. This also has a reference value for future low-carbon and sustainable tourism development in the Yangtze River Economic Belt. Therefore, in the future tourism development of the Yangtze River economic belt, we should improve the low-carbon level, reduce the use of high-carbon energy, and accelerate the realization of strong decoupling of carbon emissions from tourism.
(4) During the historical period, the carbon emission intensity, tourist consumption level, and tourism investment scale from 2000 to 2003 were all factors that hindered the decoupling of tourism in the Yangtze River Economic Belt, leading to the weak decoupling from carbon emissions. In the future period, the carbon emission intensity under the benchmark scenario is a key factor in promoting the decoupling of tourism carbon emissions, while the carbon emission intensity and tourism investment efficiency under the medium and low-carbon scenarios are the main factors that promote the strong decoupling between tourism carbon emissions and economic development. Carbon emission intensity is the most crucial factor in promoting the decoupling of tourism carbon emissions in the Yangtze River Economic Belt in the past and the future, which is consistent with the conclusions of existing research. Tourism investment plays a vital role in promoting the development of tourism (Su and Sun, 2017). In the future, it may also play an essential role in promoting the strong decoupling of tourism carbon emissions. Therefore, the relevant departments in the Yangtze River Economic Belt should pay attention to the scientific development of investment strategies according to the specific development needs of tourism in each province.

5.2 Countermeasures

Based on the above conclusions, four policy recommendations are put forward for the future low-carbon and sustainable development of tourism in the Yangtze River Economic Belt.
(1) To speed up the process of the low-carbon development of tourism in the Yangtze River Economic Belt, the government should provide relevant preferential policies and financial subsidies, pay attention to the development of clean energy, improve the energy structure and increase the use of clean energy in tourism, transportation, accommodation, scenic infrastructure, and other links.
(2) Scientific development of tourism resources and tourism investment. In future development, we should rationally develop tourism resources and reduce the dependence of tourism development on energy consumption according to the different tourism resource endowments of each province (municipality). Referring to the specific trend of changes in tourism carbon emissions in the historical period of the Yangtze River Economic Belt and the forecast trend of tourism carbon emissions in the future, the carbon emission intensity of tourism can be scientifically set. According to the actual development requirements of each province (municipality), we should make a scientific and rational investment in tourism, attach importance to the construction of ecological and environmental protection infrastructure, and ensure the sustainable development of tourism.
(3) The nine provinces and two municipalities in the Yangtze River Economic Belt should formulate long-term strategies for the low-carbon development of regional tourism according to their local conditions; comprehensively consider all aspects of tourism development such as food, housing, transportation, tourism, shopping, and entertainment; and strive to build the Yangtze River Economic Belt into a low-carbon tourism development zone, with a scientific approach leading the high-quality sustainable development of tourism.
(4) The provinces in the Yangtze River Economic Belt should work together from the supply side and the demand side to reduce the dependence of regional tourism economic development on carbon emissions. On the one hand, relevant departments should pay attention to introducing talents and environmental protection equipment, increasing technological investment, and reducing carbon emissions in the production of tourism products. They should actively develop low-carbon tourism products with high-cost performance, both ornamental and practical, and reduce the hindrance of the tourist consumption level to the decoupling of tourism carbon emissions. On the other hand, relevant departments should increase publicity and strengthen the awareness of low-carbon environmental protection of various tourism-related subjects. All kinds of scenic spots should take the initiative to guide tourists toward low-carbon tourism. Tourists should consciously establish the concept of environmental protection, actively choose green travel methods and low-carbon tourism products, and jointly help in the high-quality development of tourism in the Yangtze River Economic Belt.
[1]
Akay D, Atak M. 2007. Grey prediction with rolling mechanism for electricity demand forecasting of Turkey. Energy, 32(9): 1670-1675.

DOI

[2]
Chen F, Zhu D J. 2009. Theory of research on low-carbon city and Shanghai empirical analysis. Urban Studies, 16(10): 71-79. (in Chinese)

[3]
Chen Z J, Liu Y M, Liu X, et al. 2018. Research on carbon emission peak in Yangtze River economic zone with steady economic growth: Based on data of global night-time light. Journal of Natural Resources, 33(12): 2213-2222. (in Chinese)

DOI

[4]
Dubois G, Ceron J P. 2006. Tourism leisure greenhouse gas emissions forecasts for 2050: Factors for change in France. Journal of Sustainable Tourism, 14(2): 172-191.

DOI

[5]
Guo X Y, Mu X Q, Ming Q Z, et al. 2022. Carbon emission pattern of China’s tourism transportation and its influencing factors. Geography and Geo-Information Science, 38(2): 129-136. (in Chinese)

[6]
Han Y J, Wu P. 2016. The measurment and comparative study of carbon dioxide emissions from tourism industry of Beijing-Tianjin-Hebei. Human Geography, 31(4): 127-134. (in Chinese)

[7]
Hu C, Ding Z S, Mu X Q, et al. 2022a. The spatio-temporal evolution and driving factors of carbon dioxide emissions from tourism transportation in the Yangtze River Economic Belt. Journal of Nanjing Normal University (Natural Science Edition), 45(1): 40-48. (in Chinese)

[8]
Hu H M, Zuo W, Xu S Y. 2022b. Decoupling effect and driving factors of transportation energy carbon emission in Yangtze River Economic Belt. Resources and Environment in the Yangtze Basin, 31(4): 862-877. (in Chinese)

[9]
Huang G Q, Wang Z L, Shi P F, et al. 2021. Measurement and spatial heterogeneity of tourism carbon emission and its decoupling effects: A case study of the Yellow River Basin in China. China Soft Science, (4): 82-93. (in Chinese)

[10]
Huang H P, Qiao X Z, Zhang J. 2019. Analysis on spatial-temporal evolution of carbon emission of tourist industry in Yangtze River Economic Zone. Guizhou Social Sciences, (2): 143-152. (in Chinese)

[11]
Huang Z, Cao F, Jin C, et al. 2017. Carbon emission flow from self-driving Tours and its spatial relationship with scenic spots—A traffic-related big data method. Journal of Cleaner Production, 142: 946-955.

DOI

[12]
Jamnongchob A, Duangphakdee O, Hanpattanakit P. 2017. CO2 emission of tourist transportation in Suan Phueng Mountain, Thailand. Energy Procedia, 136: 438-443.

DOI

[13]
Jin Z. 2021. Carbon peak, carbon neutralization and high-quality transformation of tourism. Journal of Tourism, 36(9): 3-5. (in Chinese)

[14]
Kaya Y. 1990. Impact of carbon dioxide emission control on GNP growth: Interpretation of proposed scenarios IPCC energy and industry subgroup, response strategies working group. Paris, France: IPCC.

[15]
Kuo N W, Chen P H. 2009. Quantifying energy use, carbon dioxide emission, and other environmental loads from island tourism based on a life cycle assessment approach. Journal of Cleaner Production, 17(15): 1324-1330.

DOI

[16]
Li G M, Wang Y J. 2016. Study of regional carbon emission and its development trends of tourism industry based on the grey model. Ecological Economy, 32(5): 74-78. (in Chinese)

[17]
Liu J, Feng T T, Yang X. 2011. The energy requirements and carbon dioxide emissions of tourism industry of Western China: A case of Chengdu City. Renewable and Sustainable Energy Reviews, 15(6): 2887-2894.

DOI

[18]
Liu J, Yue M T. 2021. Carbon emissions of regional tourism industry and their influencing factors: A tourism mobility perspective. China Population, Resources and Environment, 31(7): 37-48. (in Chinese)

[19]
Lu L Y, Hu S L, He J L, et al. 2020. Relationship between green development and economic growth of Yangtze River Delta urban agglomeration: Based on the decoupling index analysis. Economic Geography, 40(7): 40-48. (in Chinese)

[20]
Meng W Q, Xu L Y, Hu B B, et al. 2016. Quantifying direct and indirect carbon dioxide emissions of the Chinese tourism industry. Journal of Cleaner Production, 126: 586-594.

DOI

[21]
Robaina-Alves M, Moutinho V, Costa R. 2016. Change in energy-related CO2 (carbon dioxide) emissions in Portuguese tourism: A decomposition analysis from 2000 to 2008. Journal of Cleaner Production, 111: 520-528.

DOI

[22]
Shi P H, Wu P. 2011. A rough estimation of energy consumption and CO2 emission in tourism sector of China. Acta Geographica Sinica, 66(2): 235-243. (in Chinese)

[23]
Su J J, Sun G N. 2017. Space evolution and difference of tourism investment and tourism economic development in China. Journal of Arid Land Resources and Environment, 31(1): 185-191. (in Chinese)

[24]
Sun Y Y. 2020. Estimation of CO2 emission and its effect decomposition in tourism sector of Shanghai City. Areal Research and Development, 39(1): 122-126. (in Chinese)

[25]
Surugiu C, Surugiu M R, Breda Z, et al. 2012. An input-output approach of CO2 emissions in tourism sector in post-communist Romania. Procedia Economics and Finance, 3: 987-992.

DOI

[26]
Tang C C, Zha J P, Zhang J K, et al. 2021. The goal of China’s tourism industry carbon peak and neutrality (dual-carbon) in the context of high-quality development: Evaluation and prediction, major challenges, and approach. Journal of Chinese Ecotourism, 11(4): 471-497. (in Chinese)

[27]
Tang C C, Zhong L S, Ng P. 2017. Factors that influence the tourism industry’s carbon emissions: A tourism area life cycle model perspective. Energy Policy, 109: 704-718.

DOI

[28]
Tang Z, Li X H. 2019. Analysis of the influencing factors of tourism-related CO2 emissions based on STIRPAT model in Heilongjiang Province. Ecological Economy, 35(8): 141-145. (in Chinese)

DOI

[29]
Tang Z, Shang J, Shi C B, et al. 2014. Decoupling indicators of CO2 emissions from the tourism industry in China: 1990-2012. Ecological Indicators, 46: 390-397.

DOI

[30]
Tapio P. 2005. Towards theory of decoupling: Degrees of decoupling in the EU and the case of road traffic in Finland between 1970 and 2001. Transport Policy, 12(2): 137-151.

DOI

[31]
Tian G M. 2008. Analysis of Scenario. Shanxi Library Journal, (3): 7-9, 12. (in Chinese)

[32]
Tóffano P R P, Filimonau V, Ribeiro G M. 2020. Projecting the carbon footprint of tourist accommodation at the 2030 FIFA World Cup. Cleaner and Responsible Consumption, 1: 100004. DOI:10.1016/j.clrc.2020.100004.

[33]
UNWTO-UNEP-WMO World Tourism Organization-United Nations Environment Programme-World Meteorological Organization. 2008. Climate change and tourism: Responding to global challenges. Madrid, Spain: UNWTO.

[34]
Wang F, Wang C J. 2017. Examining the driving factors of energy related carbon emissions using the extended STIRPAT model based on IPAT identity in Xinjiang. Arid Land Geography, 40(2): 441-452. (in Chinese)

[35]
Wang Q, Li J Y, He Z L. 2018. The study of measurement and calculation of carbon emission and decoupling relationship of tourism industry in Xinjiang. Ecological Economy, 34(1): 25-30. (in Chinese)

[36]
Wang Z Y, Wang Z F. 2021. Spatial-temporal evolution and influencing factors of tourism industry efficiency under the constraints of carbon emission in the Yangtze River Economic Zone. Resources and Environment in the Yangtze Basin, 30(2): 280-289. (in Chinese)

[37]
Weng G M, Li C H, Pan Y, et al. 2021. Decoupling effect and influencing factors of carbon emissions in China’s tourism industry. Geography and Geo-Information Science, 37(2): 114-120. (in Chinese)

[38]
Wu P, Han Y J, Tian M. 2015. The measurement and comparative study of carbon dioxide emissions from tourism in typical provinces in China. Acta Ecologica Sinica, 35(6): 184-190.

DOI

[39]
Wu P, Shi P H. 2011. An estimation of energy consumption and CO2 emissions in tourism sector of China. Journal of Geographical Sciences, 21(4): 733-745.

DOI

[40]
Xie Y F, Zhao Y. 2012. Measuring carbon dioxide emissions from energy consumption by tourism in Yangtze River Delta. Geographical Research, 31(3): 429-438. (in Chinese)

DOI

[41]
Yao B, Hu D, Dai X F, et al. 2017. The analysis on the characteristics and causation of carbon emissions from tourism in the Lushan Global Geopark. Journal of Jiangxi Normal University (Natural Science Edition), 41(3): 326-330. (in Chinese)

[42]
Yao Z G, Chen T. 2016. The empirical research on tourism carbon emission based on the carbon footprint model: A case study of Hainan Province. Economic Management, 38(2): 151-159. (in Chinese)

[43]
Zha J P, Dai J Q, Liu K J, et al. 2022a. Decoupling relationship between tourism growth and carbon emissions and the associated driving factors: A novel analytic framework. Tourism Tribune, 37(4): 13-24. (in Chinese)

[44]
Zha J P, Dai J Q, Ma S Q, et al. 2021. How to decouple tourism growth from carbon emissions? A case study of Chengdu, China. Tourism Management Perspectives, 39: 100849. DOI:10.1016/j.tmp.2021.100849.

[45]
Zha J P, Shu H Y, Li Y Y, et al. 2017. A research on tourism industrial carbon emissions and its influential factors in China: Evidences from Chinese provincial panel data (2005-2015). Tourism Science, 31(5): 1-16. (in Chinese)

[46]
Zha J P, Tan T, Ma S Q, et al. 2022b. Exploring tourist opinion expression on COVID-19 and policy response to the pandemic’s occurrence through a content analysis of an online petition platform. Current Issues in Tourism, 25(2): 261-286.

DOI

[47]
Zhao X C, Zhu X. 2013. A rough estimation of CO2 emission and analysis of decoupling effects in tourism sector of Hunan. World Regional Studies, 22(1): 166-175, 129. (in Chinese)

[48]
Zhou W. 2018. Forecast of China’s population trend in the next 30 years under comprehensive two-child policy. Statistics & Decision, 34(21): 109-112. (in Chinese)

Outlines

/