Plant Ecology

Contribution of Urban Trees to Offset Carbon Dioxide Emissions from the Transportation Sector in the Ring Road Area of Kathmandu Valley, Central Himalaya

  • JOSHI Nabin Raj , 1 ,
  • JOSHI Rajeev , 2, * ,
  • MISHRA Jay Raj 3
Expand
  • 1. Asia Network for Sustainable Agriculture and Bioresources, Kathmandu 44600, Nepal
  • 2. College of Natural Resource Management, Faculty of Forestry, Agriculture and Forestry University, Udayapur, Koshi 56310, Nepal
  • 3. Api Eco Consultancy and Research Pvt. Ltd (AECAR), Kathmandu 44600, Nepal
* JOSHI Rajeev, E-mail:

JOSHI Nabin Raj, E-mail:

Received date: 2022-08-06

  Accepted date: 2023-02-10

  Online published: 2023-10-23

Abstract

Urban trees are valuable resources for urban areas as they have the capacity to reduce ambient temperatures, mitigate urban heat island effects and reduce runoff of rainwater playing an important role in mitigating the impacts of climate change by reducing atmospheric carbon dioxide (CO2). It also helps to reduce aerial suspended particulate matter, add visual appeal to the urban landscape sequestrating a significant amount of carbon from ambient atmospheric CO2. Carbon storage by urban trees in the ring road area of the Kathmandu Valley was quantified to assess the magnitude and role of urban forests in relation to mitigate the impact of global climate change. A total of 40 sample plots were placed randomly for the detailed carbon assessment. Aboveground and belowground carbon pools were considered in the detailed assessment. Furthermore, quality assurance (QA) and quality control (QC) were maintained through regular monitoring and capacity building of the field crews while collecting the bio-physical data. The assessment recorded a total of 33 different species of plants in the avenue’s plantation sites in ring road. The mean seedling, sapling, and tree density was found to be 2149585 and 185 per hectare. The mean carbon stock per hectare in the avenue plantation of the ring road area was 24.03 tC ha-1 and the existing total carbon stock was 7785.72 tC in 2021. Likewise, the total baseline carbon dioxide equivalent (tCO2e) in the avenue plantation was found to be 28573.60 tCO2e. The carbon dioxide emission from the transport sector in the ring road area in a full movement scenario was 312888.00 tCO2e per annum, while the net emissions was 42547 tCO2e. There was a deficit of carbon dioxide in terms of stock by avenue plantations of 14000.8 tCO2e. This study indicates that the existing urban forest plantation is unable to sequestrate or offset the carbon dioxide that is emitted through the transportation sector. Consequently, open spaces like riverbanks and any other public lands, in which urban forests could be developed has to be planned for the green infrastructure and plantation of the multipurpose trees. The distinct values of forests in and around urban areas have to be recognized in the specific policies and plans for the sustainable management of urban and peri-urban forests to meet the adverse impact of global climate change. In addition, this study provides insights for decision-makers to better understand the role of urban forests and make sustainable management plans for urban forests in the cities like in Kathmandu Valley.

Cite this article

JOSHI Nabin Raj , JOSHI Rajeev , MISHRA Jay Raj . Contribution of Urban Trees to Offset Carbon Dioxide Emissions from the Transportation Sector in the Ring Road Area of Kathmandu Valley, Central Himalaya[J]. Journal of Resources and Ecology, 2023 , 14(6) : 1272 -1281 . DOI: 10.5814/j.issn.1674-764x.2023.06.015

1 Introduction

Trees, including other green vegetation, sequester about 80% of all aboveground and 40% of all belowground terrestrial organic carbon, making forest ecosystems fundamental to maintaining the global carbon balance and combating climate change (IPCC, 2006). Forest carbon sequestration is a degree that can be taken up to alleviate climate change (Were et al., 2019). Carbon sequestration is the removal of carbon-dioxide or carbon (CO2) from the atmosphere by storing it in the biosphere (Patil and Kumar, 2017). About two-thirds of terrestrial carbon is stored in standing trees, forest soil, understory plants, leaf and in forest debris (Sedjo, 2005). Forests and wooded vegetation areas are considered as natural carbon sinks. This means trees sequester carbon by capturing atmospheric CO2 in the growth of wood biomass through the process of photosynthesis, thereby increasing the soil organic carbon (SOC) (Brown and Pearce, 1994). But the amount of carbon sequestered in forests differs according to spatial and temporal factors such as forest age, stand structure, type, size, associated vegetation, and ecological zonation, management regimes, among other things (Roberge et al., 2016). Forest management regime and applied associated silvicultural operations are key elements of forest carbon dynamics (Urbano and Keeton, 2017). The forest vegetation, along with associated soil types is a viable sink and is making substantial contributions to capture atmospheric carbon, thus combating the impacts of climate change (Fawzy et al., 2020). To measure the amount of carbon stored, temporal stocks of carbon within various forest strata need to be addressed (Sharma et al., 2013).
Reducing emissions from deforestation and forest degradation (REDD+) along with conservation and sustainable management of forests in developing countries is evolving as an operative tool to combat and acclimatize to the effects of global climate change (Angelsen, 2008; FAO, 2011). The fourth assessment report of the Intergovernmental Panel on Climate Change (IPCC) has projected that the forest sector subsidizes 17.4% of all greenhouse gases from human induced sources; most of this can be attributed to deforestation and forest degradation (IPCC, 2006). Stern (2006) witnessed that controlling deforestation and forest degradation is an economical way to diminish greenhouse gas emissions. Based on the strong scientific evidences, the Conferences of the Parties to the United Nations Framework Convention on Climate Change (UNFCCC COPs) after the 13th session (COP 13) in Bali, Indonesia have delineated durable cooperative action and called for enhanced national and international actions for operationalizing REDD+ to shrink greenhouse emission and assess climate change adaptation and mitigation in least developed countries (Christoff, 2016). The possibility that deforestation, chronic disturbances, and topography will result in forest biomass that is significantly different from the average values suggests that linking specific locations of disturbance and topography with geographically specific estimates of biomass would improve estimates of carbon fluxes. Air pollution and other associated greenhouse gas emissions due to the diverse anthropogenic activities has been a key concern at present in the mega cities, such as Kathmandu (Mishra and Kulshrestha, 2021). In order to keep the rise in global temperature well below 2 ℃, the Paris Agreement recognizes the urgent need for an effective and proactive response to the issue of climate change. With trees serving as both a source and a sink of carbon dioxide, anthropogenic greenhouse gas emissions can be partially mitigated.
Roadside plantations are at an early phase and gradually increasing in Nepal. If this can be included in the Kyoto Protocol and other climate change adaptation and mitigation initiatives like REDD+, it will have great potential for development as a climate change project and can generate millions of dollars annually by charging industrialized countries for the carbon they sequester in the plant biomass and soils (Shrestha and Dhakal, 2019). However, earning such financial incentives is not easy. Community forestry, roadside plantations and private forests should have scientific data on how much carbon they stock and its systematic financial valuation (Barua et al., 2020). Thus, for assessment of potential carbon stock and sequestration, the estimation and valuation of carbon content in forests, trees, or any type of management regime is important. The transportation sector is one of the chief energy-overwhelming sectors and also a main global greenhouse gas emitting sector (Bajracharya and Bajracharya, 2013). The consumption of fuel has been increasing tremendously in the past few decades particularly in the Kathmandu Valley, due to the hasty modernization and increasing populations that have been causing various emissions into our surroundings, creating various environmental threats. The principal emissions from vehicles are greenhouse gases, i.e., CO2, N2O, and CH4 (18). The major gas emitted through vehicles is carbon dioxide, which is directly associated with the volume of fuel consumed and the type of fuel used (Petrol & Diesel) (Quiros et al., 2017). This study has focused on the CO2 emissions of ring road transportation in the Kathmandu Valley (KV).
In this context, an assessment of the carbon stock and carbon sequestration potential of roadside avenue plantation in Kathmandu Metropolitan City’s (KMC) ring road areas appears critical to know how much carbon is absorbed by the different species, aged and sized trees and how much carbon is emitted per unit area by vehicles/automobiles. So that there would be an idea of how much carbon is emitted and how much is being sequestered by the roadside trees. This might have huge implications to the policymakers to plan better and clean cities through generating ideas of whether the available trees are sufficient for balancing, neutralizing, or offsetting the carbon emitted by the transportation sector. The main objective of this research is to assess carbon stocks and carbon sequestration potential of the avenue plantations in the ring road areas of the Kathmandu Metropolitan City (KMC).

2 Materials and methods

2.1 Study area

This study was carried out in the avenue plantations of the ring road area, which lies in the Kathmandu and Lalitpur districts of the Kathmandu Valley. The total length of the Ring Road is 27 km. It has a right of way of 62 m (with 31 m on either side of the center line). The Ring Road connects major places like Kalanki, Swyambhunath, Balaju, Gongobu, Shamakhushi, Maharajganj, Sukedhara, Gaushala, Tinkune, Koteshwor, Balkumari, Gwarko, Satdobato and Balkhu (Fig. 1).
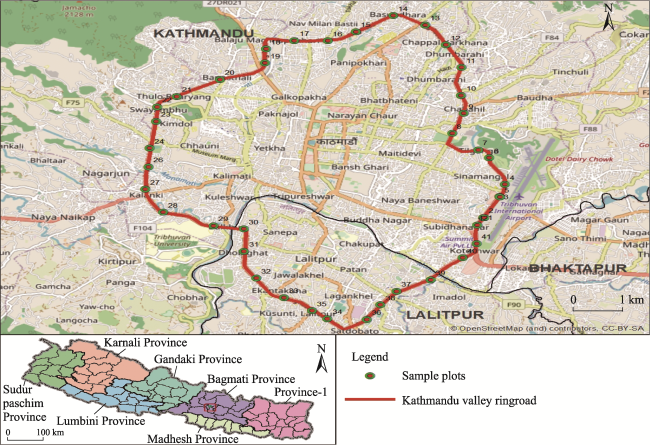
Fig. 1 Map of the study site

2.2 Methodology

Globally, various ecological studies have been piloted to evaluate carbon stocks based on the carbon density of soil and vegetation (Yu et al., 2007). The findings of these studies are not identical and have wide dissimilarities and uncertainties, possibly due to the aggregation of spatial and temporal heterogeneity and adaptation of diverse methodologies. The IPCC (2000) projected an average carbon stock of 86 t ha-1 in the vegetation of the world’s forests for the mid-1990s. The resultant carbon in biomass and dead wood in forests reported in FRA (2005) amounts to 82 t ha-1 for the year 1990 and 81 t ha-1 for the year 2005. In addition, the following secondary sources were reviewed thoroughly: Forest Act, 2076, Emission Reduction Program Documents (ERPD), Nepal’s MRV document, Forest Reference Level Documents 2000-2010 of Nepal, REDD+ strategy for Nepal, TAL and CHAL carbon reports, DoTM, 2019, CBS-Environment Statistics of Nepal 2019, AFOLU guidelines-2006, IPCC Guidelines for National Greenhouse Gas Inventories, and State of Nepal’s Forests, Ministry of Forests and Soil Conservation (2015).

2.3 Sampling design and intensity

The study team has reviewed and identified the total roadside plantation area first and developed a map through consultation with the local concerned stakeholders and local government staffs. Based on the review and discussions, the road side plantation area map has been divided proportionately into blocks and sections, and the total area has been calculated. Sampling was done following the standard forest inventory guideline, 2004 of the Government of Nepal. The study team chose a sampling intensity of 0.5% to 0.10% in the potential planted areas. The nested sample plot technique suggested by Ravindranath and Ostwald (2008) was used in the sampling strategy because of its simplicity. The random sampling method was adopted for this study, where the sample plots were established in both left and right alignment, each at a 500-1000 m distance alternatively. A total of 42 sample plots were determined to capture the variance of different bio-physical attributes (Fig. 1).

2.4 Design of nested circular plots

The concentric nested circular plots were used for the tree biomass and carbon assessment. This design also minimizes edge effects, which usually occur in rectangular plots. A circular plot of 500 m2 with a 12.62 m radius was used to determine the measurement of trees that had 5.1 cm in diameter, while an additional nested plot of 100 m2, with a 5.64 m radius, was established for sapling measurement, with a diameter of 0.1-5.0 cm. In the case of the smaller diameter class trees, the collar diameter and height were recorded.

2.5 Carbon estimation of tree, sapling and herbs & grasses

The methodology used to determine the above-ground tree biomass (AGTB) was adapted from those of Chave et al (2005). We adopted an algorithm suggested by Chave et al. (2005) for moist forest types because precise algometric equations to predict AGTB are not available for Nepal. This equation, which was tested under several climatic conditions, incorporates three predictive factors (wood specific density, tree height, and DBH). The above ground sapling biomass (AGSB), was calculated using Nepal specific biomass equations, developed by Tamrakar (2000). The root and shoot ratio of 1:5 was used to estimate below ground biomass (BGB) or root biomass of the trees as given by MacDicken (1997). The herbs and grasses biomass were obtained from a relationship of total fresh weight taken from each nested sub-plots. Plot areas, biomass fraction (ratio of the dry to fresh weight) were used for estimating the herbs and grasses biomass. About 100 g of well mixed sample for herbs and grasses from each plot was sent to laboratory, the constant weight was obtained by the oven drying method to determine the dry weight of the sample.

2.6 Data compilation, entry and analysis

After field measurement, all the data sheets were indexed and entered into the excel sheet. R-statistical software (R Development Core Team, 2009) and MS-excel 2007 were used for the data analysis. All the biomass and carbon pools were added to get the total biomass and carbon in a particular plot and finally converted into per hectare using the equations as provided in the Table 1. The biomass value was converted into carbon and carbon dioxide using the fraction of 0.47 by IPCC (2006) and 3.67 by Pearson et al. (2007).
Table 1 Methods adopted for the estimation of forest carbon
Measured carbon pool Equations Description of the equation References
Above ground tree
biomass (AGTB)
$AGTB=0.0509\times \rho \times \ {{D}^{2}}\times H$ $\rho $: wood specific gravity (kg m-3), D: tree DBH, H: tree height (m) Chave et al. (2005)
Below ground biomass (BGB) BGB=AGTB×20% The total below ground biomass is equivalent to 20% of the above ground biomass (t ha-1) MacDicken (1997)
Above ground sapling biomass (AGSB) ln(AGSB)=a+b lnD a: intercept of allometric relationship for sapling, b: slope allometric relationship for saplings, D: over bark at DBH Tamrakar (2000)
Herbs & grasses (HG) $HG=\frac{{{w}_{\text{field}}}}{A}\times \frac{{{w}_{\text{subsample},\text{dry}}}}{{{w}_{\text{subsample},\text{wet}}}}\times 10$ wfield: weight of the fresh field sample of HG, destructively sampled within an area of size A (kg);
A: size of the area in which HG were collected (m2);
wsubsample, dry,: weight of the oven-dry sub-sample of HG taken to the laboratory to determine moisture content (g); and wsubsample, wet: weight of the fresh sub-sample of HG taken to the laboratory to determine moisture content (g)
Subedi et al. (2010)
Total biomass (TB) TB=AGTB+BGB+AGSB+HG Sum of all measured carbon pools i.e trees, below ground, saplings and herbs & grasses Subedi et al. (2010)

2.7 Estimation of carbon dioxide emission from vehicles

The detailed information of the vehicle data was gathered from the Department of Transport Management (DTM), Nepal signifies only the cumulative number of vehicles since their first registration and, therefore, do not represent the actual vehicle fleet existing and plying on the road each year. Each year, a huge number of vehicles are clashed and the actual vehicle fleet plying on the road were determined by subtracting the scrapped vehicles from the annually registered vehicle numbers. However, data for the annual arguing rate does not exist in Nepal. Therefore, public vehicles older than 20 years old are not included, which are not allowed to run in the Kathmandu Valley.
The choice of approaches rest upon the various factors, such as the availability of data and the importance of the source category. Since there are no country-specific carbon-dioxide emission factors for CO2 emission assessment in Nepal, the default values provided by the IPCC (2006) guidelines were used either in the calculation of the net calorific value or in the CO2 emission studies or in the carbon oxidation fractions. Methodologies for estimating national inventories of anthropogenic emissions by sources and removals by sinks of greenhouse gases are given in the IPCC (2006) Guidelines for National Greenhouse Gas Inventories. The Tier 1 approach, as per IPCC Guidelines for National Greenhouse Gas Inventories, 2006, was used for calculating CO2 emissions.
E=$\underset{i}{\mathop \sum }\,Fuel\text{(}i\text{)}\times EF\text{(}i\text{)}$
where, E= CO2 emissions by road transport; Fuel(i) = Total fuel consumed by vehicles by type; EF(i) = Emissions Factor; and i = Types of fuel (petrol or diesel). Similarly, for energy demand and emission per mode of transports can be calculated using the Equation (1).
ED = N×F
where, ED = Energy demand; N = Number of existing vehicles; and F = Average fuel economy (L km-1). Finally, the total emission from a vehicle is a function of energy consumed by it, therefore given by Equation (2).
EmissionCO2e = ED×E
where, EmissionCO2e = Emission from a vehicle; ED = Energy demand; and E = Emission by road transport.

3 Results and discussion

3.1 Vegetation parameters in ring road

Out of 42 sample plots measured in the ring road area, all plot falls under the man-made plantations. The study recorded a total of 33 different species were identified with 9 different plant species of seedlings, 13 different plant 11 different species of trees. Jacaranda (Jacaranda oveliafolia), Kalki (Callistemon citrinus), Kapur (Cinnamomum camphora), Kaiyo (Grevillea robusta) and Morpankhi (Thuja orientalis) are the dominant tree species in the project area. While plotting the scattered plot between tree height and diameter, a strong positive correlation was observed with multiple R2 (0.6667) and adjusted R2 (0.6628), respectively (Fig. 2).
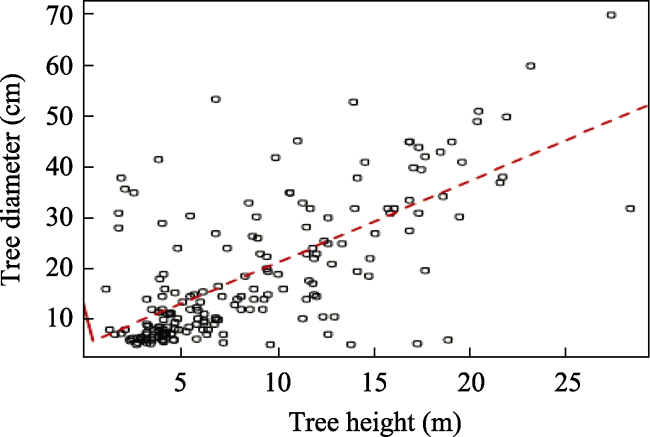
Fig. 2 Scattered plot between tree diameter and height
Based on the carbon assessment of the avenue’s plantations in the ring road area of the Kathmandu Valley, the mean density was calculated. The mean seedlings, saplings, and tree density were found to be 2149, 585, and 194 plants per hectare, respectively (Table 2).
Table 2 Seedling, sapling, tree density in the ring road area of Kathmandu Valley
S.N. Variables Seedling density
(plant ha-1)
Sapling density
(plant ha-1)
Tree density
(plant ha-1)
1 Mean 2149 585 194
2 Std. Deviation 1962 536 165

3.2 Biomass, carbon and carbon dioxide in the avenue plantation

The forest carbon assessment in the avenue plantation area of the ring road area has estimated that the mean tree biomass, carbon and carbon-dioxide in the above and below ground pool was found to be 49.0 t ha-1, 22.98 tC ha-1 and 84.3 tCO2e, while the box and whisker plot plotted using R-statistical software for tree carbon (Fig. 3) expressed that there is a huge potential for enhancing carbon up to 200 tC ha-1 in the future with better silvicultural and management practices. The mean sapling biomass, carbon and carbon-dioxide stock was found to be 1.75 t ha-1, 0.82 tC ha-1 and 3.02 tCO2e, respectively. The box and whisker for sapling carbon (Fig. 3) expressed that the sapling carbon could reached up to 2.4 tC ha-1 in the future. Finally, the mean herb & grasses biomass, carbon and carbon dioxide was found to be 0.48 t ha-1, 0.22 tC ha-1 and 0.8 tCO2e, respectively. The box and whisker plot plotted for herbs and grasses carbon (Fig 3) expressed that maintaining the grass and herbs cover in the ring road could capture up to 1.0 tC ha-1 in the future.
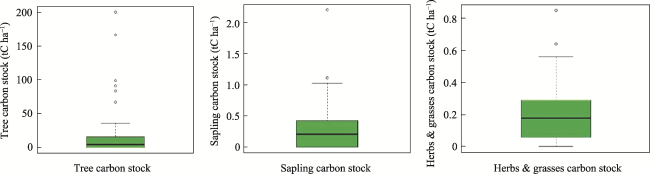
Fig. 3 Box and whisker plot for tree, saplings and herbs & grasses carbon stock
The average carbon and carbon dioxide equivalent in the Avenue plantation in all above and below ground pools was found to be 24.03 tC ha-1 and the total carbon dioxide equivalent was found to be 88.18 tCO2e (Table 3). The mean carbon stock per hectare in the avenue plantation of the ring road area was found to be 24.03 tC ha-1 and the total carbon stock was found to be 7785.72 tC on a yearly basis. Likewise, the total baseline carbon dioxide equivalent in the avenue plantation in Ring Road was found to be 28573.60 tCO2e.
Table 3 Total and mean carbon in all the pools in the plantation site
S.N. Plot Tree carbon stock (tC ha-1) Sapling carbon stock (tC ha-1) Herb carbon stock (tC ha-1) Total carbon stock (tC ha-1) Total (tCO2e)
1 Mean 22.98 0.82 0.22 24.03 88.18
2 Std. Deviation 2.21 0.10 0.20 4.52 65.90

Note: In last two columns, one is total carbon stock and another value is carbon dioxide equivalent.

The forest resources assessment of Nepal has estimated that the total carbon stock in Nepal’s forest is about 1054.97 million tonne’s with a mean carbon stock value of 176.95 tC ha-1 (DFRS, 2015). Likewise, the various studies in different physiographic regions and landscapes of Nepal have shown different facts and figures, such as the mean forest carbon stock of Chitwan Annapurna Landscapes (CHAL) was 197.80 tC ha-1 (Subedi et al., 2015). The forest carbon stock for the seven Central Himalayan forests of the Hindu Kush Himalayan region was between 166.8 and 440 tC ha-1 (Rana et al., 1989). Whereas the mean forest carbon stock in the central Himalayan forests of India ranged between 250 and 300 tC ha-1 (Singh, 1992), while the mean forest carbon stock in the world’s tropical forests was 285.82 tC ha-1 (Malhi and Grace, 2000). The forest carbon stock was estimated for Terai forests 124.14 tC ha-1 and Churia forests 116.94 tC ha-1 (FRA, 2015), the forest carbon stock in the middle hill region in ICIMOD Knowledge park, Godavari was 269.22 tC ha-1 (Karki et al., 2016), the forest carbon stock in the community managed forests of Nepal Himalayas was between 162.5 tC ha-1 and 300 tC ha-1 (Joshi et al., 2013) and the forest carbon stock in the Terai Arc Landscape of Nepal was 237.74 tC ha-1 (Nepal WWF, 2013).
The mean urban forests carbon density ranges between 33.22 tC ha-1 in Shenyang and 30.25 tC ha-1 in Hangzhou with highest 43.70 tC ha-1 in Beijing City of the China (Liu and Li, 2012) these value can be comparable with the present study as the mean carbon density in the ring road of Kathmandu Valley with 24.03 tC ha-1. The total carbon stock in the urban trees in Oakland city of United States was between 350 and 750 million tonne’s (Nowak, 1993). Similarly, in Chicago, the carbon assessment has estimated national carbon storage by urban trees between 600 and 900 million tonne’s (Nowak, 1994). The three cities of Korea including Chuncheon, Kangleung and Seoul the mean carbon storage by woody plants ranged from 0.47 to 0.72kg C m2 for urban lands (Jo, 2002). The above-ground carbon density for all vegetation in treed areas in Leicester, England was 28.1-28.9 kg C m2 (Davies et al., 2011) and estimates for total carbon within human settlements (23-42 kg C m2) (Churkina et al., 2010).
Compared to these above figures, the mean forest carbon stock in the avenue plantations in the ring road area of the Kathmandu Valley is extremely lower than in other forest types and urban periphery at this stage. However, forest carbon stock can be enhanced to that optimal level if the avenue plantation area is managed in a sustainable manner with appropriate silvicultural operation and treatment.

3.3 Carbon dioxide emissions from the vehicle

All the vehicles moving around the ring-road area do not travel throughout the 27 km. Thus, we assumed and asked the key informants through a key informant survey, and based on that, we estimated that only 1% of vehicles (all types of motorcycles, scotty, cars, vans, buses, mini-trucks, and heavy trucks) travelled throughout the ring-road, i.e., a 27-km distance. Likewise, 2% of the vehicles (all types of motorbikes, scooters, cars, vans, buses, mini-trucks, and heavy trucks) travelled half way around the ring-road. A total of 3% of vehicles (motorbikes, scooter/mope, cars, vans) and 5% (buses, mini-trucks, and heavy trucks) travelled throughout the one third of the ring-road. Also, a total of 5% of vehicles (motorbikes, scooter/moped, cars, vans, and 10% of buses, mini-trucks, and heavy trucks) moved one fourth of the ring road. Thus, the net emissions due to these vehicles on the ring road per year are approximately 42547.40 tCO2e, with monthly carbon-dioxide emissions of 3548 tCO2e, daily carbon-dioxide emissions of 118.26 tCO2e, and hourly carbon-dioxide emissions of 4.93 tCO2e (Table 4).
Table 4 Total CO2 emissions in ring-roads per unit time
Vehicle type Total tCO2e emissions
in ring-road (per year)
by all vehicle type
Total tCO2e emissions
full way vehicle
movement1
Total tCO2e emissions
of half way vehicle
movement2
Total tCO2e emissions
of one third way vehicle movement3
Total tCO2e emissions
one fourth way vehicle movement4
Motorbike 123987 1240 2480 3720 6199
Scooter/Moped 50076 501 1002 1502 2504
Car 22280 223 446 668 1114
Van 9732 195 195 292 487
Bus 8361 167 167 418 836
Mini-truck 49891 998 998 2495 4989
Heavy truck 48561 486 971 2428 4856
Total 312888 3809 6258 11523 20985
Grand total emissions (tCO2e yr-1)
in ring-road (1+2+3+4)
42574.40
Per month 3547.86
Per day 118.26
Per hour 4.93
Per minute 0.08
The present study estimated a total of 312888 tCO2e carbon-dioxide emissions from vehicle movement (in a full movement scenario) in the ring road area of the Kathmandu Valley. A study conducted by Paudel et al. (2021) on the comparison of vehicular fuel consumption and CO2 emissions before and during the COVID-19 pandemic in the Kathmandu Valley (Kathmandu, Lalitpur, and Bhaktapur) has found that road transport produced 914352 tCO2e carbon-dioxide emissions from the transportation sector for the fiscal year 2019-2020 by consuming 292260 m3 of fuel (diesel and petrol). This study’s carbon dioxide equivalent emissions value can be compared with the study conducted by Poudel et al. (2021), as the value of the emissions falls within a similar range, as their study estimated a total of 914352 tCO2e for three districts, and our study showed that 312888 tCO2e for the ring road area only, particularly covering the maximum parts of the ring road within the Kathmandu District.

3.4 Current CO2 removal and emission level in the ring road area

Based on the inventory of above and below ground carbon pools (trees, saplings, and herbs), the baseline mean carbon stock per hectare in the avenue plantation of the ring road area was found to be 24.03 tC ha-1 and the total carbon stock in the above and below ground parts of the avenue plantations was found to be 7785.72 tC. Likewise, the total baseline carbon dioxide equivalent in the avenue plantation on the ring road was found to be 28573.60 tCO2e.
On the other hand, based on the sampling of the total number of vehicle movements in the ring road area per unit time (per minute, per day, per month and per year), the total carbon-dioxide emission has been estimated at a total of 312888 tCO2e (metric tonne’s of carbon-dioxide equivalent. The net carbon dioxide emissions due to these vehicles in the ring road per year was found to be 42574.40 tCO2e (Table 4). Thus, from Table 5, it can be interpreted that the total carbon-dioxide emissions due to the vehicles (transportation sector) is higher than that of the total carbon-dioxide stock by the avenues plantation in the ring road area of the Kathmandu Valley. The avenue plantation is not able to balance or cut the total carbon dioxide emissions due to the large number of vehicles emitting higher carbon dioxide. There was a deficit of carbon dioxide in terms of stock by avenue plantations of 14000.8 tCO2e. This means that the existing plantation along the ring road cannot sequester or offset the carbon dioxide emitted by vehicles or modes of transportation in the Kathmandu Valley.
Table 5 Carbon removals and emission scenario in Kathmandu Valley
Carbon removal (tCO2e) by avenues plantations in ring road Carbon emissions (tCO2e) by vehicles in ring road
Total carbon stock
(tC yr-1)
Total carbon-dioxide equivalent
(tCO2e yr-1)
Total emission by vehicles
(tCO2e monthly)
Total emission by vehicles
(tCO2e yr-1)
7785.72 28573.60 3547.83 42574.40
Carbon surplus/deficit Total tCO2e emissions by transport sector (E)-Total tCO2e sequestration by urban trees (R) (E-R)
42574.40-28573.60
14000.80 tCO2e

4 Conclusions and recommendation

This present study, undoubtedly reflects the significance of urban forests with reference to regulating ecosystem functions and services (controlling air pollution, carbon sequestration, and regulating the local climate) especially urban forest can play an important role in mitigating the impacts of climate change by reducing concentration of atmospheric CO2 in urban areas. Trees in the urban sprawls of least developed countries like Nepal are already suffered to higher temperatures, carbon and GHGs concentrations in urban areas. For the evaluation of the existing and potential function of urban forests in lowering atmospheric CO2, quantification of carbon storage and sequestration by urban forests is essential. Supporting biodiversity inclusive decision-making should be of major concern for urban planners and researchers to understand the associated synergies between increasing carbon sinks that can help in reducing urban climatic vulnerabilities. In this study, it was found that all the plants were sensitive to air pollutants and thus are effective indicators of air pollution alongside the major roads of the Kathmandu Valley. But, the existing plantation on the ring road is not able to sequestrate or offset the carbon dioxide that is emitted through the transportation sector. Thus, the existing forests around the Kathmandu Valley should be managed in sustainable manner, open spaces like riverbanks, river corridors and any other public lands could be brought under urban forests promoting green infrastructure and planting multipurpose trees. Nevertheless, several efforts have been made to promote urban and peri-urban forests (UPF) in Nepal. The city areas like Kathmandu have not been able to attain the predictable consequences in UPF development because cities have been built chaotically and in a piecemeal approach rather than through planned and holistic approaches. Our findings also showed that distinct urban forest types with different species compositions and age structures had different C storage and sequestration rates. These findings can be used to evaluate the existing and potential contribution of urban forests in the Kathmandu Valley’s reduction in atmospheric CO2. Additionally, they include information that will help decision-makers and the general public better comprehend how urban forests contribute to the reduction of atmospheric CO2 and develop better management strategies for urban forests in the cities like Kathmandu in Nepal.
With promptly emergent prices of land in urban areas, private interests have played a major role in city planning and spaces for trees have been rarely considered. Secondly, the open spaces, like riverbanks, religious places, guthis, and other public lands, in which urban forests could be developed have been encroached for gray infrastructure. Third, the distinct values of forests in and around urban areas have been hardly recognized; i.e., no specific policies and plans have been put in place for the management of urban and peri-urban forests. These have ensued in what we see and feel while living in highly crowded and polluted cities like Kathmandu today. In order to initiate the green and clean climate smart city and to participate in the REDD+ initiatives through urban forestry model in Nepal, the present study might be the baseline for forest carbon, carbon stock and emissions from the transportation sector the ring road area of Kathmandu Valley. The following recommendations are suggested to be followed and carried out by the concerned stakeholders and institutions: 1) Address permanency and safeguard of the urban plantations; 2) Promote plantations of multipurpose tree species; 3) Conduct periodic monitoring, reporting, and documentation of the carbon measurement in the avenue plantations; 4) Promote electric vehicles; 5) Carry out Silviculture activities in urban forests areas periodically.

Acknowledgement

This research was financially supported by the Kathmandu Metropolitian City’s Planning Commissions under the Mayors Research Fellowship Program 2020/21. The authors would like to thank and express their sincere gratitude to Saroj Basnet, Kirti Kusum Joshi, Arun Sharma Poudel, and Ajay Chandra Lal for providing valuable guidance and mentoring throughout the research study. Likewise, the authors would like to thank Harish Bahadur Chand, Dinesh Bhandari, Padam Raj Joshi, Takendra Shah, and Bimala Nidal for their support during the field data and information collection and mapping. Thanks are extended to Mr. Ugan Manandhar, Dr. Mani Nepal, Mr. Laxmi Dutta Bhatta, Mr. Raja Ram Aryal and Mr. Amul Acharya for their valuable insights and cooperation in obtaining information for this research. Any errors in this article are the sole responsibility of the authors.
[1]
Angelsen A. 2008. Moving ahead with REDD: Issues, options and implications. Bogor, Indonesia: Center for International Forestry Research (CIFOR).

[2]
Bajracharya I, Bajracharya T R. 2013. Scenario analysis of road transport energy consumption and greenhouse gas emission in Nepal. Proceedings of IOE Graduate Conference, Kathmandu, Nepal.

[3]
Barua S K, Boscolo M, Animon I. 2020. Valuing forest-based ecosystem services in Bangladesh: Implications for research and policies. Ecological Services, 42: 101069. DOI: 10.1016/j.ecoser.2020.101069.

[4]
Brown K, Pearce D. 1994. The economic value of non-market benefits of tropical forests: Carbon storage. The Economics of Project Appraisal and the Environment, (1): 102-123.

[5]
Chave J, Andalo C, Brown S, et al. 2005. Tree allometry and improved estimation of carbon stocks and balance in tropical forests. Oecologia, 145(1): 87-99.

DOI PMID

[6]
Christoff P. 2016. The promissory note: COP 21 and the Paris climate agreement. Environmental Politics, 25(5): 765-787.

DOI

[7]
Churkina G, Brown D G, Keoleian G. 2010. Carbon stored in human settlements: The conterminous United States. Global Change Biology, 16(1): 135-143.

DOI

[8]
Davies Z G, Edmondson J L, Heinemeyer A, et al. 2011. Mapping an urban ecosystem service: Quantifying above-ground carbon storage at a city-wide scale. Journal of Applied Ecology, 48(5): 1125-1134.

DOI

[9]
DFRS. 2015. Forest resource assessment (FRA). Kathmandu, Nepal: Department of Forest Research and Survey (DFRS).

[10]
FAO. 2011. State of the world’s forests. Rome, Italy: FAO.

[11]
Fawzy S, Osman A I, Doran J, et al. 2020. Strategies for mitigation of climate change: A review. Environmental Chemistry Letters, 18(6): 2069-2094.

DOI

[12]
FRA. 2005. The global forest resource assessment. http://www.fao.org/forestry/fra. Viewed on 2022-07-20.

[13]
FRA. 2015. State of Nepal’s forests. Kathmandu, Nepal: Forest Resource Assessment (FRA).

[14]
IPCC. 2000. Land use, land-use change and forestry. Geneva, Switzerland: Intergovernmental Panel on Climate Change.

[15]
IPCC. 2006. Good practice guidance for national greenhouse gas inventories. Geneva, Switzerland: Intergovernmental Panel on Climate Change.

[16]
Jo H. 2002. Impacts of urban greenspace on offsetting carbon emissions for middle Korea. Journal of Environmental Management, 64(2): 115-126.

DOI

[17]
Joshi N R, Gauli K, Subedi B P. 2013. Forest carbon assessment in community managed forest in the Nepal Himalayas: Strengthening local communities to monitor carbon stocks under REDD+ initiatives. Kathmandu, Nepal: ICIMOD.

[18]
Karki S, Joshi N R, Udas E, et al. 2016. Assessment of forest carbon stock and carbon sequestration rates at the ICIMOD knowledge park in Godavari, Nepal. Kathmandu, Nepal: ICIMOD.

[19]
Liu C, Li X. 2012. Carbon storage and sequestration by urban forests in Shenyang, China. Urban Forestry & Urban Greening, 11(2): 121-128.

[20]
MacDicken K G. 1997. A guide to monitoring carbon storage in forestry and agroforestry projects. Arlington, USA: Winrock International.

[21]
Malhi Y, Grace J. 2000. Tropical forests and atmospheric carbon dioxide. Trends in Ecology & Evolution, 15(8): 332-337.

DOI

[22]
Mishra M, Kulshrestha U C. 2021. A brief review on changes in air pollution scenario over south Asia during COVID-19 lockdown. Aerosol and Air Quality Research, 21(4): 200541. DOI: 10.4209/aaqr.200541.

[23]
Nepal WWF. 2013. Chitwan annapurna landscape (CHAL): A rapid assessment. Kathmandu, Nepal: World Wildlife Fund of Nepal.

[24]
Nowak D J. 1993. Atmospheric carbon reduction by urban trees. Journal of Environmental Management, 37(3): 207-217.

DOI

[25]
Nowak D J. 1994. Atmospheric carbon dioxide reduction by Chicago’s urban forest. In: McPherson E G, Nowak D J, Rowntree R A (eds.). Chicago’s urban forest ecosystem: USDA forest service general technical report NE-186. Chicago, USA: US Department of Agriculture, Forest Service.

[26]
Patil P, Kumar A K. 2017. Biological carbon sequestration through fruit crops (perennial crops-natural “sponges” for absorbing carbon dioxide from atmosphere). Plant Archives, 17(2): 1041-1046.

[27]
Paudel P, Sapkota S, Gyanwali K, et al. 2021. Comparison of vehicular fuel consumption and CO2 emission before and during the Covid-19 pandemic in Kathmandu Valley. Journal of Innovations in Engineering Education, 4(1): 10-17.

[28]
Pearson T R. 2007. Measurement guidelines for the sequestration of forest carbon. Washington DC, USA: US Department of Agriculture, Forest Service, Northern Research Station.

[29]
Quiros D C, Smith J, Thiruvengadam A, et al. 2017. Greenhouse gas emissions from heavy-duty natural gas, hybrid, and conventional diesel on-road trucks during freight transport. Atmospheric Environment, 168: 36-45.

DOI

[30]
R Development Core Team. 2009. R: A language and environment for statistical computing. Vienna, Austria: R Foundation for Statistical Computing.

[31]
Rana B S, Singh R P, Singh S P. 1989. Carbon and energy dynamics of seven central Himalayan forests. Tropical Ecology, 30(2): 253-264.

[32]
Ravindranath N H, Ostwald M. 2008. Methods for estimating above-ground biomass. Dordrecht, Netherlands: Springer.

[33]
Roberge J M, Laudon H, Björkman C, et al. 2016. Socio-ecological implications of modifying rotation lengths in forestry. AMBIO, 45(2): 109-123.

DOI

[34]
Sedjo R A. 2005. Macroeconomics and forest sustainability in the developing world. https://ageconsearch.umn.edu/record/10458.

[35]
Sharma L K, Nathawat M S, Sinha S. 2013. Top-down and bottom-up inventory approach for above ground forest biomass and carbon monitoring in REDD framework using multi-resolution satellite data. Environmental Monitoring and Assessment, 185(10): 8621-8637.

DOI PMID

[36]
Shrestha S, Dhakal S. 2019. An assessment of potential synergies and trade-offs between climate mitigation and adaptation policies of Nepal. Journal of Environmental Management, 235: 535-545.

DOI PMID

[37]
Singh J S. 1992. Forests of Himalaya: Structure, functioning and impact of man. Nainital, India: CGyanodaya Prakashan.

[38]
Stern N. 2006. Stern review: The economics of climate change. HM Treasury, UK: Cambridge University Press.

[39]
Subedi B P, Gauli K, Joshi N R, et al. 2015. Forest carbon assessment in Chitwan-annapurna landscape. Kathmandu, Nepal: WWF Nepal Hariyo.

[40]
Subedi B P, Pandey S S, Pandey A, et al. 2010. Forest carbon stock measurement: Guidelines for measuring carbon stocks in community-managed forests. Kathmandu, Nepal: ANSAB, FECOFUN and ICIMOD.

[41]
Tamrakar P R. 2000. Biomass and volume tables with species. Kathmandu, Nepal: Ministry of Forest and Soil Conservation, Nepal.

[42]
Urbano A R, Keeton W S. 2017. Carbon dynamics and structural development in recovering secondary forests of the northeastern US. Forest Ecology and Management, 392: 21-35.

[43]
Were D, Kansiime F, Fetahi T, et al. 2019. Carbon sequestration by wetlands: A critical review of enhancement measures for climate change mitigation. Earth Systems and Environment, 3(2): 327-340.

DOI

[44]
Yu D S, Shi X Z, Wang H J, et al. 2007. Regional patterns of soil organic carbon stocks in China. Journal of Environmental Management, 85(3): 680-689.

PMID

Outlines

/