
Journal of Resources and Ecology >
A Wind Tunnel Study of the Shelter Effect of Different Vegetation Patterns of Caragana korshinskii
#The authors have the same contribution to the article.
|
DANISH Bhutto, E-mail: danishbhuttotju@gmail.com; |
|
LI Wanying, E-mail: 929981653@qq.com |
Received date: 2022-06-05
Accepted date: 2023-02-20
Online published: 2023-10-23
Supported by
The Project of Intergovernmental International Cooperation in Science and Technology Innovation(2019YFE0116500)
The National Natural Science Foundation of China(31870706)
Windbreaks are important measures for reducing wind erosion in arid and semi-arid areas. A series of experiments were conducted in a wind tunnel to assess the effectiveness of different vegetation patterns (uniform, random, and cluster) of simulated Caragana korshinskii stands on wind speed. The uniform pattern provided a better shelter effect and was optimal at a density of 50%. The protected area and the wind reduction ratio increased and the downwind minimum wind speed decreased with an increase in the number of rows and a reduction in the belt’s spacing. The locations of minimum wind speed (Xmin) were similar in arrangements with single-, two- and three-row belts. At the leeward distance close to vegetation (≤5 H, where H is the height of the plants), the efficiencies of vegetation patterns with high densities were greater than those of multiple-row belts and similar to those of multiple-belt shelterbelts; but at the leeward distance >5 H, the relationship was reversed. The single-row belt was the least effective, and the double-belt shelterbelt with belt spacing of 4 H was the most effective pattern. Multiple-belt shelterbelts had a lower downwind wind speed and a longer sheltering length than the other patterns, and so it is recommended windbreaks designed to reduce wind speed and control aeolian erosion in arid and semi-arid areas.
Key words: vegetation; windbreak efficiency; wind speed; Caragana korshinskii
DANISH Bhutto , LI Wanying , XIAO Huijie . A Wind Tunnel Study of the Shelter Effect of Different Vegetation Patterns of Caragana korshinskii[J]. Journal of Resources and Ecology, 2023 , 14(6) : 1260 -1271 . DOI: 10.5814/j.issn.1674-764x.2023.06.014
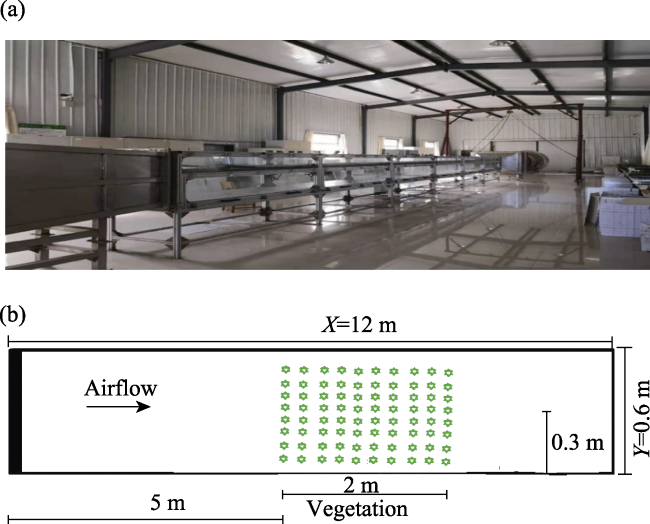
Fig. 1 (a) Photo of the tunnel; (b) Schematic test section with locations of the plants |
Table 1 Comparison of the field and wind tunnel model of Caragana korshinskii |
| Category | Height (cm) | Crown dimensions | Porosity (%) | Morphology |
|---|---|---|---|---|
| Field plant | 60 | 45 cm×45 cm | 18 | 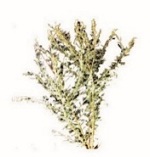 |
| Wind tunnel model | 3 | 2.5 cm×2.5 cm | 18 | 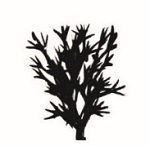 |
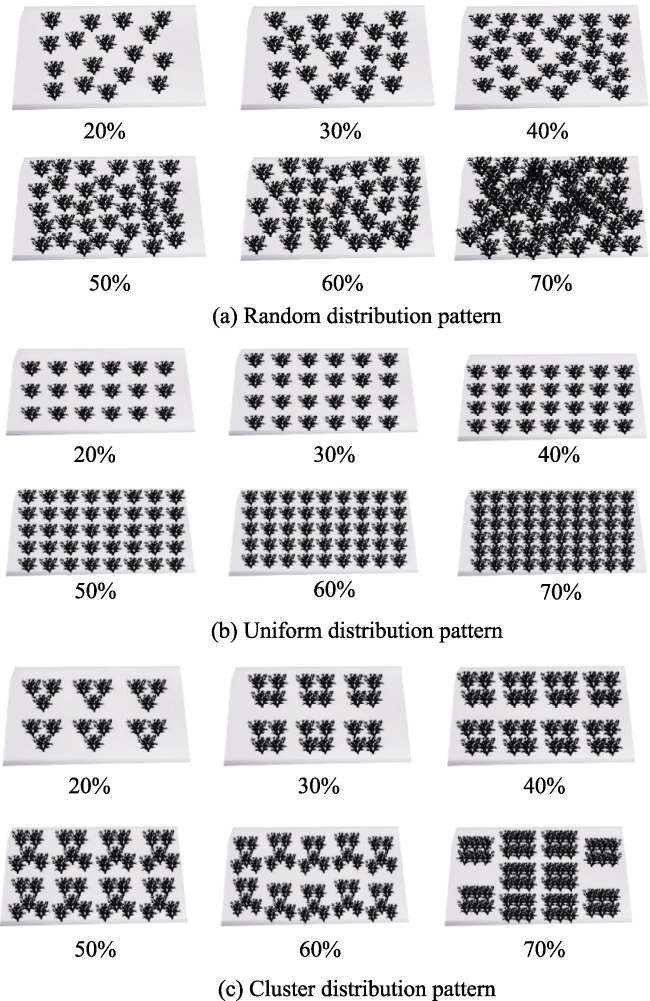
Fig. 2 Schematic diagrams of the different distribution patterns of C. korshinskii at different vegetation densities of 20%, 30%, 40%, 50%, 60% and 70% |
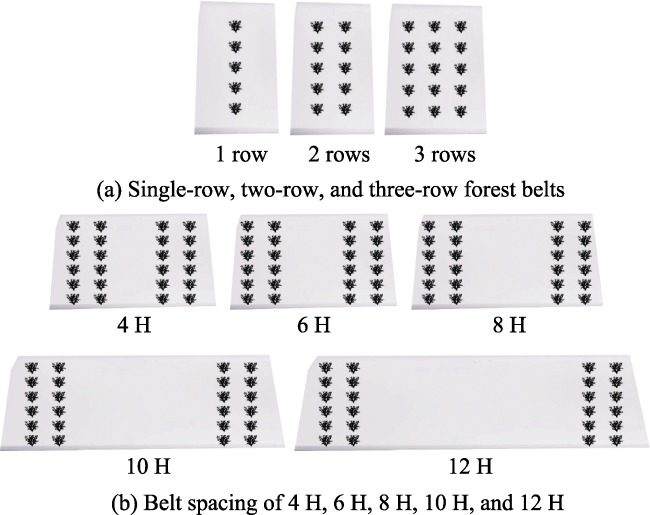
Fig. 3 Schematic diagrams of forest belts with different numbers of rows (a) and spacing (b) |
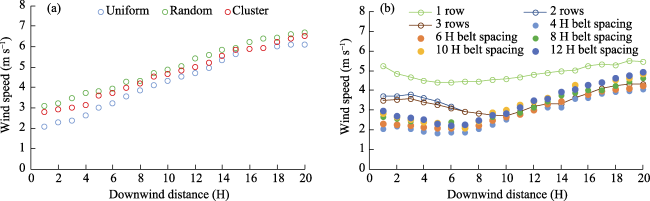
Fig. 4 Horizontal distribution of wind speed downwind of (a) uniform, random, and cluster canopies, (b) single-row, two-row and three-row forest belts, and multiple-belt shelterbelts with spacings of 4 H, 6 H, 8 H, 10 H and 12 H under a wind speed of 10 m s-1Note: The wind speed of 10 m s-1 is the control wind speed under experimental condition; the wind speed of vertical axis changes because the wind speed at each sample point is different. The same below. |
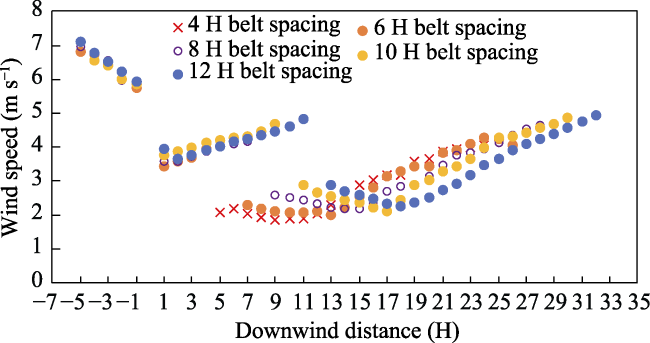
Fig. 5 Horizontal distribution of wind speed upwind, within and downwind of multiple-belt shelterbelts with the spacing of 4-12 H under a wind speed of 10 m s-1 |
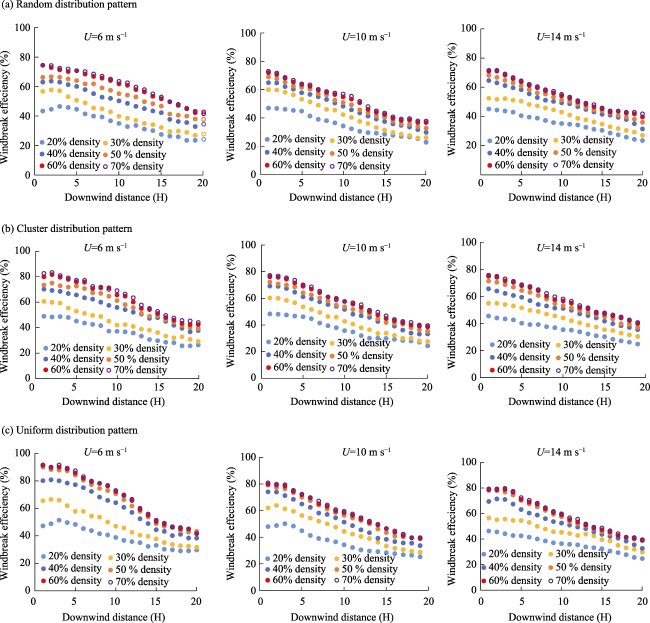
Fig. 6 Horizontal variation of the sheltering effects of plants in different vegetation densities and distribution patterns under wind speeds of 6, 10, and 14 m s-1 |
Fig. 7 Comparing the windbreak efficiency of C. korshinskii in different distribution patterns under different densities (20%, 50%, and 70%) and wind speeds (6, 10, and 14 m s-1) |
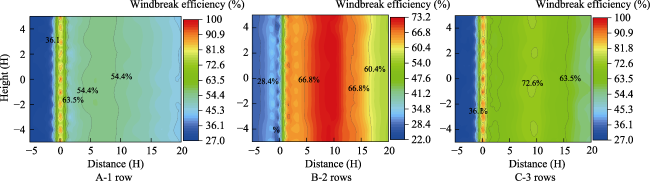
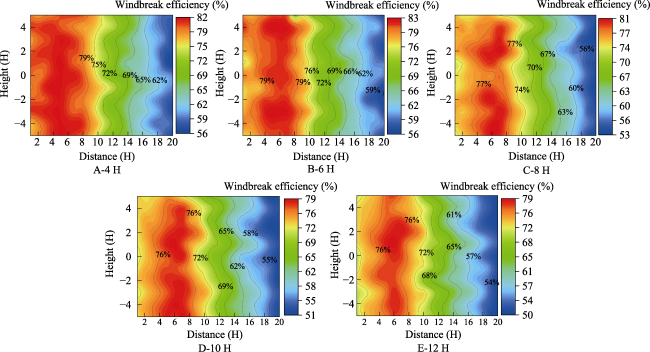
Fig. 8 Windbreak efficiencies of (a) single-row and multiple-row shelterbelts and (b) multiple-belt shelterbelts |
Fig. 9 Comparison of windbreak efficiency upwind and downwind of the three forest belts with different numbers of rows at a 10 m s-1 wind speedNote: In the longitudinal coordinate, the central axis of the wind tunnel is the origin point, above the central axis is positive values and below the central axis is negative values. In the horizontal ordinate, negative values are in front of the forest belt and positive values are behind the forest belt. The same below. |
Fig. 10 Comparison of windbreak efficiency for the different belt spacing configurations at a 10 m s-1 wind speedNote: 4 H, 6 H, 8 H, 10 H, and 12 H represent different belt spacing, which are the study objects; The number in horizontal axis represent the measuring points at different positions of the measuring zone. The same below. |
Fig. 11 Comparing the efficiency of different vegetation patterns at downwind distances of 1 H, 5 H, 10 H, and 20 H under a wind speed of 10 m s-1Note: bs means spacing belt. 4 H bs, 6 H bs, 8 H bs, 10 H bs, and 12 H bs in horizontal axis represent different belt spacing, which are the study objects; The legend 1 H, 5 H, 10 H, and 20 H represent four measuring points, indicating the windbreak effciency of the four measuring points under five different belt spacing pattern. |
| [1] |
|
| [2] |
|
| [3] |
|
| [4] |
|
| [5] |
|
| [6] |
|
| [7] |
|
| [8] |
|
| [9] |
|
| [10] |
|
| [11] |
|
| [12] |
|
| [13] |
|
| [14] |
|
| [15] |
|
| [16] |
|
| [17] |
|
| [18] |
|
| [19] |
|
| [20] |
|
| [21] |
|
| [22] |
|
| [23] |
|
| [24] |
|
| [25] |
|
| [26] |
|
| [27] |
|
| [28] |
|
| [29] |
|
| [30] |
|
| [31] |
|
| [32] |
|
| [33] |
|
| [34] |
|
| [35] |
|
| [36] |
|
| [37] |
|
| [38] |
|
| [39] |
|
| [40] |
|
| [41] |
|
| [42] |
|
| [43] |
|
| [44] |
|
| [45] |
|
| [46] |
|
| [47] |
|
| [48] |
|
| [49] |
|
| [50] |
|
| [51] |
|
| [52] |
|
/
| 〈 |
|
〉 |


