Ecosystem and Ecological Security

Optimization of the Ecological Security Pattern in Xi’an City based on a Minimum Cumulative Resistance Model

  • ZHOU Luhong , 1, * ,
  • WANG Panting 2 ,
  • BAI Yuxia 1
Expand
  • 1. School of Land Engineering, Chang’an University, Xi’an 710054, China
  • 2. Shaanxi Land Engineering Construction Group Co., Ltd., Xi’an 710075, China
* ZHOU Luhong, E-mail:

Received date: 2022-07-01

  Accepted date: 2022-12-30

  Online published: 2023-10-23

Supported by

The Fund Project of Shaanxi Key Laboratory of Land Consolidation(2019-JC02)

The Fundamental Research Funds for the Central Universities(300102278113)

Abstract

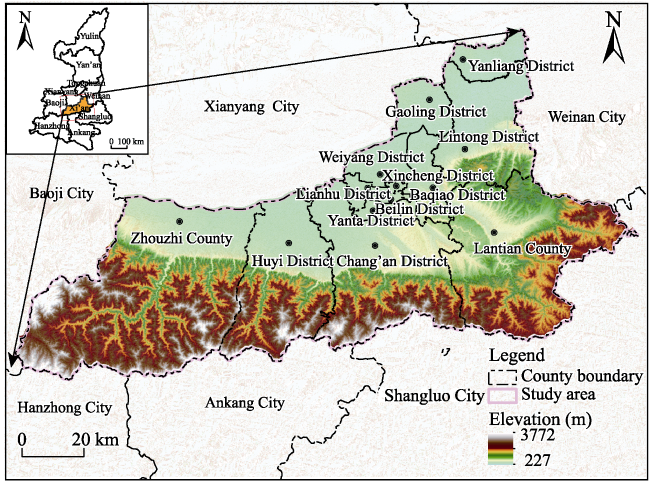
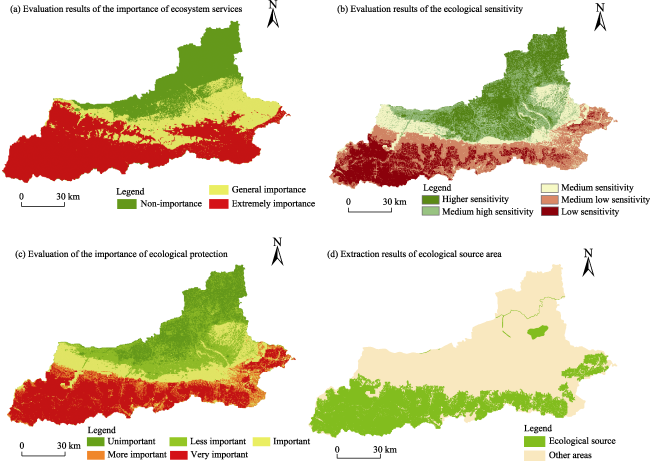
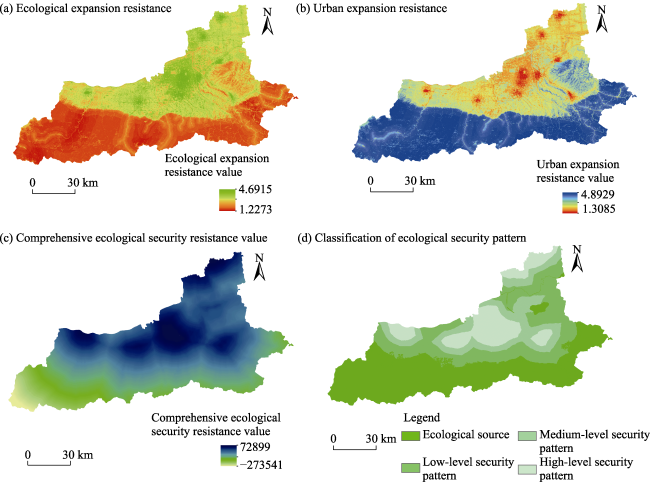
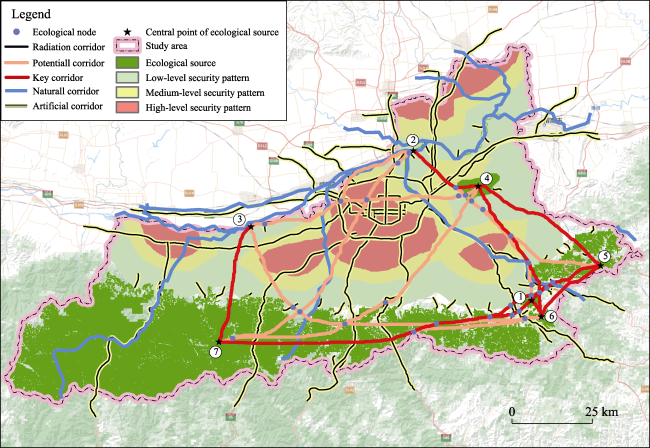
The ecological security pattern is conducive to promoting the harmonious integration of regional development and ecological protection. Taking Xi’an, a core city in the west of China, as an example, the ecological source area was identified based on an assessment of the importance of ecological services and the sensitivity of the ecological environment. Then the minimum cumulative resistance model and gravity model were used to construct the regional ecological security pattern and optimize the ecological spatial structure layout. The results show four key aspects of this system. (1) The source area of ecological protection identified in this study was 3352.5 km2, accounting for 33.2% of the city, and it is mainly distributed in the Qinling Mountains, Lishan Hills, Weihe River, Heihe River, and Jinghe River. (2) Excluding the ecological source area, the low, medium and high-level security pattern areas accounted for 27.21%, 15.95% and 14.31% of the whole area, respectively. (3) The models generated 21 potential corridors with a total length of about 105.24 km, including 9 key corridors. (4) In order to optimize the ecological spatial structure of Xi’an, one proposal is to build an ecological security network layout system with “one barrier, one belt, several corridors, multiple areas and multiple points” as the core.

Cite this article

ZHOU Luhong , WANG Panting , BAI Yuxia . Optimization of the Ecological Security Pattern in Xi’an City based on a Minimum Cumulative Resistance Model[J]. Journal of Resources and Ecology, 2023 , 14(6) : 1127 -1137 . DOI: 10.5814/j.issn.1674-764x.2023.06.002

1 Introduction

With the acceleration of urbanization in China, the rapid development of economic construction has changed the system of land use and management (Naveh, 1994; Peng et al., 2017a). The depletion of natural resources seriously affects the landscape pattern and the sustainable development of ecosystems (Gao et al., 2020), and poses a threat to regional ecological security. Maintaining the integrity and health of the ecosystem and ensuring the ecological security of the country have become two of the urgent scientific issues in the construction of China’s ecological civilization (Wen, 2008; Li, 2013). The ecological security pattern refers to the ecological environmental conditions and ecosystem services that can effectively protect human life and health from damage, as well as ensuring that economic development and social stability will not be hindered and threatened by the composite ecological system security situation (Ma et al., 2004). Therefore, the reasonable construction of the ecological security pattern is of great significance for coordinating the relationship between land use and the ecological environment, promoting the rational allocation of resources and realizing the sustainable development of regional ecological protection.
Since land health was proposed in the 1940s, the International Institute of Applied Systems Analysis first proposed the concept of ecological security (Rapport et al., 1999). With the increasing global attention to ecological security, international scholars have accumulated a great deal of research results related to ecosystem services value and ecological security management methods (Brand and Alice, 2013; Pickard et al., 2015). Yu and other scholars in China first studied the “ecological security pattern” with the help of landscape ecology theory (Yu et al., 2005, 2009), and then Ma et al. (2004) further proposed the concept of the regional ecological security pattern on this basis. At present, the focus of research on ecological security patterns has changed from the basic theory to comprehensive practical application (Meng et al., 2016). The three steps of determining the ecological source, establishing the resistance surface and constructing the security pattern have gradually become the basic paradigm for constructing the ecological security pattern (Yu, 1999). The research contents of the ecological security pattern are quite diverse as well, for example, progressing from the early research on major projects (Chen et al., 2007) to the later attempt to build urban ecological security (Teng, 2011; Hu et al., 2013; Wu et al., 2013), and then to ecological security assessments including those in Guanzhong, Changsha-Zhuzhou-Xiangtan and the Pearl River Delta urban agglomerations and mining areas (Yang et al., 2017; Li and Gan, 2019; Wu et al., 2020; Zhao et al., 2020). However, the research on urban ecological security patterns in Northwest China has been somewhat ignored. In terms of research methods, Peng et al. (2017b) modified the resistance surface through the sensitivity of geological disasters in order to delineate the ecological security pattern of Yuxi City, Yunnan Province. The minimum cumulative resistance model and GAP method were used to construct the wetland ecological security in the northeast of the Sanjiang Plain (Liu et al., 2009). Yang et al. (2016) determined the ecological source by delimiting the ecological protection red line in order to construct the ecological security pattern in Jiangxi Province. At present, the main research methods of ecological security pattern include graph theory method, ant colony algorithm, circuit theory, minimum cumulative resistance model (MCR), etc., and the most widely used model is the MCR model (Wang et al., 2022). The MCR model is derived from the research results of Knaapen et al. and the modification of the cost distance model in the geographic information model (Yu, 1999). This model is often used in establishing the resistance surface, mainly by generating the best path through the weight of the resistance surface. Considering the terrain, environment and other factors, it has the advantages of simple data requirements, high operational efficiency and a high visualization degree of the analysis results, so it is the most commonly used method to extract ecological corridors (Meng et al., 2016). In summary, the MCR model is well suited for application to the study of ecological security patterns because it can better simulate the obstacle effect of the landscape on horizontal spatial movement. Nevertheless, the method based on the ecological red line has the advantages of fully incorporating ecological processes, ecosystem services and ecological patches sensitive to external disturbances in the region (Xu et al., 2015), so this method provides a new idea for the selection of ecological sources and ensures and maintains the bottom line of national and regional ecological security (Gao, 2014).
Xi’an is the core of economic development in China’s northwestern region. With the implementation of the Chinese Western Development Drive and the Belt and Road Initiative, Xi’an has achieved rapid social and economic development by virtue of its geographical advantages. Therefore, this study used Xi’an, the core city of northwest China, as an example. Based on the ecological protection importance assessment method, the ecological red line area was identified as the source of ecological security pattern construction. The minimum cumulative resistance model and gravity model were then used to identify the ecological corridors and ecological strategic nodes in the region, and then the complete ecological security pattern system of Xi’an was constructed, in order to provide a reference for optimizing the spatial layout of regional land and ecological security management.

2 Materials and methods

2.1 Study area

Xi’an City is located in the hinterland of Guanzhong Plain in the Yellow River Basin (107°40′E-109°49′E, 33°39′N- 34°45′N). It is bordered by Weihe River and Loess Plateau in the north, connected with Xianyang City and Tongchuan City, bordered by Shangluo City, Ankang City and Hanzhong City in the south, bounded by Taibai Mountain in the west, adjacent to Baoji City and Weinan City in the east. The total land area of Xi’an City is 10096.81 km2. The overall terrain is high in the south and low in the north, and high in the west and low in the east. To the south is the Qinling Mountains which cross the east and west, and to the north is the Weihe River alluvial plain and loess tableland. Many rivers occur within the city, so it has a superior ecological environment and abundant natural resources (Fig. 1).
Fig. 1 Location of the study area

2.2 Data sources

This study included data on the land use, NDVI, NPP, soil, DEM, meteorology, and the road and water systems in Xi’an City. The land use type data was obtained from the Resource and Environmental Science Data Center of Chinese Academy of Sciences (http://www.resdc.cn). Digital Elevation Model (DEM) data were derived from SRTM terrain data (http://www.gscloud.cn) with a resolution of 30 m×30 m and provided by the Geospatial Data Cloud of Chinese Academy of Sciences. The NDVI data were calculated by downloading Landsat8 data and using preprocessing methods such as atmospheric correction and radiation calibration in the ENVI5.3 software. The NPP data came from the National Earth System Science Data Center (http://www.geodata.cn) of the National Science and Technology Infrastructure Platform. Soil data from the second national soil survey of Nanjing were provided as 1:1000000 soil data, with a data resolution of 1 km×1 km. Meteorological data were derived from the annual data set of China surface climate data from the China Meteorological Science Data Sharing Service Network, and the annual average temperature and precipitation data were obtained by Kriging interpolation. The road and water data came from the national geographic information public service platform of 1:1000000 basic geographic data.

2.3 Research methods

2.3.1 Ecological red line delineation method

According to the main ecosystem services and regional ecological sensitivity characteristics of the different types of important ecological function areas in Xi’an, the ecological red line area of Xi’an was divided through the importance evaluation of ecosystem services and the ecological sensitivity evaluation method. Of the two evaluations, the Xi’an ecosystem services evaluation mainly includes biodiversity maintenance evaluation, water conservation evaluation, and soil and water conservation evaluation, while the ecological sensitivity evaluation mainly includes soil erosion sensitivity evaluation. Each evaluation process was calculated by the relevant algorithms. The water conservation evaluation was calculated by the water balance method, soil and water conservation was calculated by the general soil erosion equation, biodiversity was evaluated by the NPP quantitative index, and soil erosion sensitivity was calculated by the root mean square method (Ministry of Environmental Protection of People’s Republic of China, 2017). The evaluation results of ecosystem service importance were divided into three levels by using the natural breakpoint method, i.e., non-importance, general importance and extreme importance. Similarly, the ecological sensitivity evaluation results were divided into the five levels of high sensitivity, medium high sensitivity, medium sensitivity, medium low sensitivity and low sensitivity. Finally, the extremely important level of ecosystem services function and the extremely sensitive level of the sensitivity evaluation results were superimposed in order to take the maximum value as the initial judgment result of the importance level of ecological protection. Combined with the nature reserves, the initial judgment results were locally adjusted to obtain the ecological red line area using the following formula:
$WR=NP{{P}_{mean}}\times {{F}_{sic}}\times {{F}_{pre}}\times (1-{{F}_{slo}})$
where WR is an ecosystem water source conservation service capability index; NPPmean is the average productive for many years of vegetation and primary productive forces; Fsic is soil infiltration factor; Fpre is the annual average precipitation factor; Fslo is the slope factor.
$S S_{i}=\sqrt[5]{R \times K \times L \times S \times C}$
where A is the amount of soil erosion in the i-th year (t ha-1 yr); R is the rainfall erosivity factor; K is the soil erodibility factor; L is the slope length factor; S is the slope factor; C is the surface vegetation cover factor; P is the soil conservation measures factor; and C and P are dimensionless (i.e., they have no units).
${{S}_{bio}}=NP{{P}_{mean}}\times {{F}_{pre}}\times {{F}_{tem}}\times \left( 1-{{F}_{alt}} \right)$
where Sbio is the biodiversity maintenance service capability index; NPPmean is the average productive for many years of vegetation and primary productive forces; Ftem is the multi-year average temperature; Falt is the altitude factor; and Fpre is the annual average precipitation factor.
$S{{S}_{i}}=\sqrt[5]{R\times K\times L\times S\times C}$
where SSi is the soil erosion sensitivity index of the spatial unit; and R, K, L, S and C are the sensitivity classification values of the rainfall erosivity factor, soil erodibility factor, slope length factor, slope factor and vegetation coverage factor, respectively.

2.3.2 Ecological security pattern construction method

Through the combined spatial distributions of the ecological sources, buffer zones, ecological corridors, radiation channels, and ecological strategic nodes, an ecological security pattern can be comprehensively constructed. Due to the spatial heterogeneity of the land landscape unit, the resistances experienced by different land units are also different. The land with a large resistance to the ecological “source” is suitable for construction, and the land with a large resistance is suitable for ecological protection. These two are mutually expanding. Therefore, the minimum cumulative resistance model can be used to establish the minimum cumulative resistance difference between the ecological source and urban expansion, and the result can be used as the basic data for constructing the ecological security pattern of Xi’an according to the following formula:
$MC{{R}_{\text{Differential value}}}=MC{{R}_{\text{Ecology}}}-MC{{R}_{\text{Urban}}}$
In the formula, MCREcology (for ecological resource land) and MCRUrban (for urban land) are the minimum cumulative resistance values for the spatial expansion of the source area and the city, respectively. When the difference given by the MCRDifferential value is less than 0, the ecological source area is easier to expand than the urban source area and is suitable for ecological land; on the contrary, when the MCR difference is greater than 0, the urban source area is easier to expand than the ecological source area; and the larger the value, the more suitable for the town expansion land. The application of this method for constructing the ecological security pattern involves three steps.
(1) Determine the source areas
The most important step in the construction of the ecological security pattern is to determine the source areas, and the integrity of ecological processes and the sustainability of ecological service functions must be reflected when selecting the specific ecological protection source areas. Therefore, based on the evaluation results of the importance of ecological protection as the background landscape, the patch connectivity of ecological land was analyzed using the Conefor 2.6 software, and the patch with a patch connectivity index > 0.1 was then selected as the ecological source for the construction of the ecological security pattern. At the same time, the urban construction land was selected as the source of urban land expansion, and the plots with an urban construction land area of less than 1 km2 were excluded.
(2) Establish the resistance surface
In the ecosystem, the flow and transfer of matter and energy, and the migration and circulation of species will all be affected by land cover types and ecological environmental factors, thus generating a certain amount of resistance to the ecological connectivity process. Referring to relevant research (Li, 2019) and considering the actual situation of the study area and the comprehensiveness and availability of data, the influencing factors that have high correlations with the expansion process of ecological sources and urban land were selected to construct the resistance surface (Table 1).
Table 1 Determination and classification of ecological expansion resistance factors and urban expansion factors
Resistance factor Resistance grade Ecological resistance score Ecological resistance weight Construction resistance score Construction
resistance weight
Slope (°) 0-2 5 0.0528 1 0.1451
2-6 4 2
6-15 3 3
15-25 2 4
≥25 1 5
Landuse type Woodland, water 1 0.3264 5 0.3085
Shrub, grassland 2 3
Cultivated land,
unused land
3 2
Building land 5 1
Vegetation coverage 0-0.2 5 0.3085 1 0.0601
0.2-0.4 4 2
0.4-0.6 3 3
0.6-0.8 2 4
0.8-1.0 1 5
Distance from river (km) <1 1 0.0601 5 0.0528
1-3 2 4
3-5 3 3
5-10 4 2
>10 5 1
Distance from road (km) <0.5 1 0.1071 5 0.1071
0.5-1.0 2 4
1.0-2.0 3 3
2.0-5.0 4 2
>5.0 5 1
Distance from town (km) <2 1 0.1451 5 0.3264
2-3 2 4
3-4 3 3
4-5 4 2
>5 5 1
(3) Identify the elements of the ecological security pattern
① Buffer discrimination. With increasing distance from the determined ecological source area, the minimum cumulative resistance value gradually increases, forming a buffer zone around the source area. The buffer zone here can be understood as a potential area for the restoration or expansion of natural habitats. Its range and boundary are determined by the cost contour at the sudden change of the cost value in the cost surface.
② Ecological corridor. The presence of an ecological corridor plays a key role in providing a bridge for species migration and energy circulation between the source areas. As a low cumulative resistance zone between ecological sources, the corridor is the easiest low-resistance ecological channel between two adjacent sources. The MCR model was determined by Yu (1999) with reference to the model of Knaapen at al. (1992). and the cost distance principle commonly used in ArcGIS. It refers to the cost of the species from a certain “source” point to the target location, and its calculation formula is as follows:
$MCR={{f}_{\min }}\underset{i=1}{\overset{m}{\mathop{\mathop{\sum }^{}}}}\,\text{ }\underset{j=1}{\overset{n}{\mathop{\mathop{\sum }^{}}}}\,\left( {{D}_{ij}}\times {{R}_{i}} \right)$
In the formula, MCR represents the minimum cumulative resistance; fmin is a positive correlation function, and the resistance value of the evaluation unit to different landscape sources takes the minimum value; Dij is the distance from j to sink i; and Ri is the resistance coefficient.
The gravity model originated from Newton’s law of universal gravitation, which simulates the interactions between nodes that are connected by corridors. A higher interaction means that the corridor provides more important connectivity, so this model can identify the space of the potential ecological corridor of the urban green space, and its calculation formula is as follows:
${{G}_{ab}}=\frac{{{N}_{a}}{{N}_{b}}}{D_{ab}^{2}}=\frac{\left( \frac{1}{{{P}_{a}}}\ln \left( {{S}_{a}} \right) \right)\left( \frac{1}{{{P}_{b}}}\ln \left( {{S}_{b}} \right) \right)}{{{\left( \frac{{{L}_{ab}}}{{{L}_{\max }}} \right)}^{2}}}=\frac{L_{\max }^{2}\ln \left( {{S}_{a}} \right)\ln \left( {{S}_{b}} \right)}{L_{ab}^{2}{{P}_{a}}{{P}_{b}}}$
In the formula, Gab is the interaction force between core patches a and b, Na and Nb are the weight values of the two patches, Dab is the normalized value of the potential corridor resistance between the two patches a and b, Pa and Pb is the resistance value of patch a and patch b, Sa and Sb is the area of patch a and patch b, Lab is the cumulative resistance value of the corridor between patches a and b, and Lmax is the maximum cumulative resistance of all the corridors in the study area.
③ Radiation channel. This is the low resistance valley line where the ecological flow of the source spreads outward, and it is the lowest resistance route aside from the ecological corridor. Using slope variability and hydrological analysis methods to extract the valley line area of the minimum cumulative resistance surface, it is used as a radiation channel area, which can provide a supplement to the ecological corridor.
④ Ecological strategy node. The strategic node is the corridor or the junction area between corridor and patch, and it is the source or sink of energy, material and species flows. It is a node of great significance for the interconnections between the source areas, mainly the intersection between ecological corridors, and the intersection between ecological corridors and the path of maximum cumulative resistance. It has the function of maintaining the sustainable development of regional ecological functions.

3 Results and analysis

3.1 Source identification based on the importance of ecological protection

A comprehensive evaluation of ecosystem services was obtained by superimposing the results of the biodiversity evaluation, water conservation evaluation and water and soil conservation evaluation. The higher grades of the evaluation results of ecosystem services function importance and ecological sensitivity were superimposed as the results for the preliminary judgment of ecological protection importance grade. Based on this evaluation, the extremely important area of ecosystem services function in Xi’an covers an area of 2586.1875 km2, accounting for 25.61% of the total land area of the city, and it is mainly distributed in the northern foothill area of the Qinling Mountains. Among these areas, Zhouzhi County belongs to the biodiversity functional area of Qinba Mountain in a national key ecological function area, so it has a strong function in maintaining biodiversity and water conservation. The general importance area covers an area of 4690.5625 km2, accounting for 46.46% of the total land area of the city. It is distributed in the plain area in the north of Xi’an and is the core area of urban agglomeration development (Fig. 2a). Xi’an has an ecologically sensitive area of 1864.63 km2 and an insensitive area of 2286.31 km2, accounting for 18.57% and 22.78% of the total land area of the city, respectively. As influenced by topography, soil vegetation, rainfall and other factors, the sensitivity of soil and water loss in the low mountains and hills of Lishan Mountain, Loess Plateau and Qinling Mountains is relatively high (Fig. 2b). On the whole, this reflects the basic situation of the resources and environment in Xi’an, i.e., the functions of biodiversity conservation, water conservation and soil and water conservation in the Qinling Mountains are significant, yet the soil erosion issues in Lishan hills, tableland slopes and the shallow Qinling Mountains are still obvious and critical (Fig. 2c).
Fig. 2 Evaluation of ecological importance and ecological source areas
The extremely important ecological protection area in Xi’an covers an area of 3432.18 km2, accounting for 34% of the total area of the city. Under this background, based on the ecological nature reserve, Heihe River, Laoyu River and other ecological corridors where wildlife migration is very important, the ecological source was obtained after patch concentration correction by using aggregation tools. The ecological source area identified in this study is 3352.50 km2, accounting for 33.2% of the city area, and it is mainly distributed in the Qinling Mountains, Lishan Hills and along the Weihe River, Heihe River and Jinghe River. Based on the areas of ecological source areas in each district and county, it mainly involves Huyi District, Chang’an District, Zhouzhi County, Lantian County and Lintong District (Fig. 2d).

3.2 Ecological security pattern analysis of ‘Source-Buffer-Corridor-Node’

3.2.1 Evaluation of the buffer zone

In Xi’an, the ecological source area is 3352.50 km2, and the urban source area is 635.98 km2, which mainly includes more than 1 km2 of urban construction land in each district and county. Through the weighted index method, the ecological and urban expansion resistance surfaces were generated (Fig. 3a, 3b). Taking the ecological source and the urban source as the "sources" of the cost path, the cost distance was used to analyze the minimum cumulative resistance surface, and the minimum cumulative resistance difference was calculated to obtain the comprehensive ecological security pattern (Fig. 3c). Based on the relationship curve between the minimum cumulative resistance difference and the grid area, the catastrophe point was obtained, which can be regarded as the potential demarcation point of the buffer boundary aside from the ecological source, and the ecological security buffer zone in Xi’an was demarcated according to three categories: high, medium and low (Fig. 3d).
Fig. 3 Construction of the ecological security pattern in Xi’an City
Among the three levels, the low-level security pattern covers an area of 2748.08 km2, accounting for 27.21% of the total study area. It is distributed in the Great Qinling Ecological Reserve in the south, where forest land and grassland predominate, and represents the bottom-line pattern of ecological security in Xi’an. Therefore, all kinds of development and construction activities should be strictly prohibited, and ecological restoration and governance should be strengthened to maintain the stability of ecosystem functions and services. The middle-level ecological security pattern covers an area of 1611.30 km2, accounting for 15.95% of the study area. It can be used as a buffer zone for the low-level and high-level ecological security patterns, and represents a restricted development area for ecological balance construction and ecological boundary control. In the future, attention should be paid to ecological conservation and ecological environmental restoration, and appropriate development and utilization should be implemented to effectively control the ecological interference and destruction of the Qinling Mountains caused by urban spillovers. The high-level safety pattern covers an area of 1445.23 km2, accounting for 14.31% of the study area, and it is located in he core urban development area in the middle and northeast of Xi’an.

3.2.2 Corridors

In this study, the geometric center of each patch of the ecological source areas is taken as the source/sink point, and the potential ecological corridors between the patches of each ecological source area and other ecological sources in the study area are determined according to the principle of minimum cost (Fig. 4). A total of 21 potential corridors were generated, with a total length of about 105.24 km. Based on the gravity model, the interaction matrix between ecological sources (Table 2) was constructed to quantitatively evaluate the interaction forces between sources and targets. Among them, nine ecological corridors with interaction intensity exceeding 340 were regarded as the key corridors, which play a role in connecting the patches in the Qinling Mountains and also in connecting isolated small patches to reduce the resistance between ecological sources. Effectively connecting the three ecological sources in the east, west and south, and coordinating the energy and material communication function of the whole region, these corridors together constitute the ecological corridor spatial distribution of the material and energy flow and transmission of the ecosystem, which increases the close spatial and functional connections among each of the ecological sources and improves the stability of the regional land ecosystem.
Fig. 4 Network optimization of the ecological security pattern in Xi’an City

Note: The marks such as ①, ②, ③ on the figure are the number of ecological source code.

Table 2 Ecological source interaction matrix based on the gravity model
Ecological source code Source1 Source 2 Source 3 Source 4 Source 5 Source 6 Source 7
Source 1 0 236.43 85.00 857.40 4585.80 65412.24 348.00
Source 2 0 84.61 817.84 192.73 189.13 109.92
Source 3 0 59.94 61.50 75.58 624.46
Source 4 0 620.25 432.04 150.82
Source 5 0 3878.56 228.97
Source 6 0 308.92
Source 7 0
The key corridors are distributed in ecological red lines, such as national forest parks and nature reserves in the south, and the trend extends from west to east, indicating that the patches of ecological source areas are concentrated and connected smoothly in this area. There are also a few key corridors extending from south to north in Lintong District, Baqiao District and Zhouzhi County, indicating that the transmission cost of corridors between other areas is relatively high, except for the ecological source areas in the south. The potential corridors in Xi’an are located in the outer layer circle around the core area of the city, and they are in a circular net shape. Generally speaking, the key corridors do not connect all of the ecological sources in the east and west of the study area, but they mainly rely on potential ecological corridors for their connections. Thus, large ecological faults have been formed in the northern and southern regions of Xi’an, and stepping stone patches should be built in the middle to improve the overall material and energy exchange capacity of the region.
The intensity of interactions between sources can be used to characterize the effectiveness of potential ecological corridors and the significance of connecting patches. The greater the intensity of interaction, the more important the corridor. According to Table 2, there are 21 potential corridors between ecological sources, and the key corridors with the strongest interactions between patches are mainly distributed in Qinling Reserve. The green patches are large in area, low in patch fragmentation and high in connectivity, so the green corridors in the southern region are densely distributed and can connect the energy flows between the east and the west. There are significant differences in the intensity of interactions between patches from different sources. For example, Table 2 shows that the interaction between ecological sources 1 and 6 and 5 is the largest, and it is distributed in the southeast of Lantian County, indicating that the material exchange and energy flow among these three ecological sources in this region are smooth, and the resistance to species migration and diffusion is the smallest. In order to further promote species protection in this region, the corridor construction and protection of ecological sources 1 and 5 should be strengthened. Some ecological sources are spaced far apart, which indicates that the correlations between these ecological sources are weak, and the migration and diffusion of biological species are subject to great artificial resistance. For example, the ecological sources 3 and 4 are surrounded by urban construction and distributed on the east and west sides of the study area. In order to find the smallest path to connect them with the surrounding areas, only the maximum value can be provided by the construction land, so the possibility of species diffusion between them is small.
In this study, neighborhood analysis and hydrological analysis in the GIS spatial analysis were used to extract the path of the maximum cumulative cost distance between the patches of different sources, which was then superimposed with the path of minimum cost, and the intersections were selected as the locations of ecological strategic points. Ultimately, 29 ecological strategic points and 39 radiation channels were obtained. Meanwhile, although the ecological strategic point also reduces the lack of corridor connectivity to a certain extent and plays a stepping-stone role in the ecological network, it is also the most vulnerable area of the ecological corridor, so the ecological protection and construction in this area should be strengthened.

3.2.3 Optimization of the ecological security pattern in Xi’an

Currently, there is insufficient ecological protection of the urban and rural construction-intensive areas in the central region, inadequate ecological service functions in the northern Weihe Plain, and more prominent problems of water ecology and air pollution. Consequently, the ecological network system planning needs to switch from a mode of total expansion to one of layout optimization and functional enhancement.
The natural ecological corridor of the Xi’an river system and the artificial ecological corridor with the Baohan, Fuyin, Baokun and Baomao expressways as its axes were superimposed and analyzed, and the ecological source, buffer zone, ecological corridor, radiation channel and ecological strategic nodes were integrated to form a distribution map of the high, medium and low level ecological security pattern in Xi’an (Fig. 4). As a result, an ecological network structure system of “one barrier, one zone, several corridors, multiple areas and multiple points” is put forward. The “one barrier” of the Great Qinling Ecological Barrier is composed of several key ecological protection areas, such as Zhouzhi- Heihe Ecological Conservation Area, Suzaku-Taiping Ecological Conservation Area, Zhongnan-Niubeiliang Ecological Conservation Area, Qinling-Tangyu Ecological Conservation Area, Wangchuan-Wang Shunshan Ecological Conservation Area, and Lishan Regional Ecological Conservation Area, which can enhance the regional ecological service function, in order to protect and restore forest and grass vegetation, maintain biodiversity and enhance the ability of soil fixation and water conservation. The “One Belt” of the Weihe River ecological landscape belt takes the Weihe River as the main development vein, combining the rich cultural and historical remains and river wetlands on both sides of the Weihe River and forming the Weihe River ecological protection belt, which endows it with complex functions such as ecological conservation, landscape recreation and ventilation corridors. The “Digital Corridor” consists of natural ecological corridors with Fenghe River, Heihe River, Weihe River and Bahe River as the axes, artificial ecological corridors with Baohan, Fuyin, Baokun and Baomao Expressway as the axes, as well as potential corridors, key corridors and radiation channels to form dozens of radiation corridors. The “Multi-districts” are the core areas of urban construction in Xi’an and urban development areas with surrounding cities as the core, including key urban development areas such as Yanliang-Gaoling Area, Lintong-Lantian Area and Huyi-Zhouzhi Area. The “public points” include strategic points between the potential corridors, intersections between the corridors and radiation paths, break points where rivers and roads form hubs, and natural protection nodes. Taking Xi’an and nature reserves as the main carriers, strengthening the protection and restoration of rare wild animal habitats and vigorously cultivating typical forest landscapes can effectively connect and facilitate communication between the various ecological safety network components, and realize the urban safety system with points, lines and areas interlaced with each other. This system plays a great pivotal role in the promotion of the ecological environment, the guarantee of circulation, the improvement of air quality and the establishment of recreation space for the citizens in the central city of Xi’an.

4 Discussion

The main ecosystem services and ecological sensitivity characteristics of the study area were evaluated using relevant models, and the extremely significant ecological protection area combining the two was determined as the ecological red line area of Xi’an. Then the ecological source and urban land were selected in the ecological red line, the resistance surface was established by using the minimum cumulative resistance model, and the minimum cumulative resistance difference between the ecological source and urban land was calculated by using the cost distance. Finally, the spatial distribution of the buffer zone, ecological corridors, radiation channels and ecological strategic nodes was determined, and the comprehensive ecological security pattern was constructed.
The “minimum cost distance” model based on GIS technology is a commonly used method in horizontal process analysis, which considers both landscape features and biological behavior features, and can be used as the basis for corridor construction. In the research process, there is currently no objective standard for the selection and assignment of resistance factors, so it is necessary to further explore the methods for identifying key ecological nodes, and the next step is to focus on setting the widths of the ecological corridors.

5 Conclusions

(1) This study identified the ecological source area in Xi’an with an area of 3352.50 km2 by combining the ecological protection importance evaluation method with the nature reserves. The ecologically critical areas are mainly located in Qinling Mountains, Lishan Hills Scenic Area, and along the Weihe River, Heihe River and Jinghe River, as well as in the nature reserves such as national parks, forest parks, drinking water sources and important reservoirs. The ecological protection red line of the whole city maintains the overall pattern of “one barrier and one area” (i.e., the ecological barrier of Qinling Mountains and the ecological belt of Weihe River Basin).
(2) Based on the minimum cumulative resistance model, the ecological security pattern of the study area was constructed, and ultimately 7 ecological sources, 21 potential corridors (including 9 key corridors), 39 radiation channels and 29 ecological nodes were connected with each other, forming the three levels of the ecological security pattern, with areas of 2748.08 km2, 1611.30 km2 and 1445.23 km2, respectively, accounting for 27.21%, 15.95%, and 14.31% of the total study area.
(3) The ecological corridors in Xi’an are concentrated in the Qinling Mountains in the south. According to the interaction force of the gravity model, the source patches of Qinling Reserve are relatively more important than the other ecological sources. Nevertheless, the key ecological corridors do not connect all of the ecological sources in the east and west. Instead, these connections mainly rely on potential ecological corridors to maintain the connectivity among all of the ecological sources. As a result, stepping stone patches should be constructed in the middle of the study area to promote the ecological security and stability of the study area.
(4) A network system of “one barrier, one zone, several corridors, multiple zones and multiple points” was identified, and various optimization suggestions can be put forward. Firstly, protect the existing natural ecological corridors such as green roads and river systems, and repair the corridor connecting areas by combining natural and artificial options, so as to strengthen the connectivity between patches in the source areas. Secondly, in areas which lack connectivity between the relatively important core areas, small green patches (stepping stones) should be added according to site conditions in order to promote material exchange and energy flow between the core areas and enhance species diversity. Finally, according to the connotation and function of ecological land and the concept of ecological protection, the corresponding measures for implementing the ecological security of land use are put forward, and governments at all levels should coordinate their various departments to enhance the administrative management of ecological protection. They should work to strengthen the construction of the ecological security barrier system, and adopt mandatory administrative orders and punitive measures to prohibit production and construction activities from occupying the ecological red line protection areas. Such efforts would contribute to the stability of the ecological network and provide a reference for the ecological planning of Xi’an in building a “natural, colorful and connected” ecological corridor and a healthy and stable ecosystem that integrates landscapes, forests, lakes and grasses.
[1]
Brand U, Alice B M V. 2013. Epistemic selectivities and the valorisation of nature: The cases of the Nagoya protocol and the intergovernmental science-policy platform for biodiversity and ecosystem services (IPBES). Law, Environment and Development Journal, 9(2): 202-220.

[2]
Chen L D, Lu Y H, Tian H Y, et al. 2007. Ecological security pattern in the construction of major projects to build the basic principles and methods. Chinese Journal of Applied Ecology, 19(3): 674-680. (in Chinese)

[3]
Gao J X. 2014. National ecological protection line system construction idea. Journal of Environmental Protection, 42(Z1): 18-21. (in Chinese)

[4]
Gao J X, Xu D L, Qiao Q, et al. 2020. Pattern construction of natural ecological space and planning theory exploration. Acta Ecologica Sinica, 40(3): 749-755. (in Chinese)

[5]
Hu H D, Li X Y, Du Y F. 2013. Construction of urban ecological security pattern for Dalian. Journal of Northeast Normal University (Natural Science Edition), 45(1): 138-143. (in Chinese)

[6]
Knaapen J P, Scheffer M, Harms B. 1992. Estimating habitat isolation in landscape planning. Landscape & Urban Planning, 23(1): 1-16.

[7]
Li B, Gan T J. 2019. Construction of water security pattern in Changsha-Zhuzhou-Xiangtan urban agglomeration based on ArcGIS and GAP analysis. Water Resources Protection, 35(4): 80-88. (in Chinese)

[8]
Li P C. 2013. Discussion on harmonious co-existence between man and nature, as well as ecological civilization construction. Natural Resource Economics of China, 26(8): 5-9. (in Chinese)

[9]
Li Y Y. 2019. Urban spatial expansion based on ecological security pattern. Diss., Xi’an, China: Northwest University. (in Chinese)

[10]
Liu J P, Lu X G, Yang Q, et al. 2009. Wetland landscape ecological security patterns analysis and plan in Northeast of Sanjiang Plain. Acta Ecologica sinica, 29(3): 1083-1090. (in Chinese)

[11]
Ma K M, Fu B J, Li X Y, et al. 2004. The regional pattern for ecological security (RPES): The concept and theoretical basis. Acta Ecologica Sinica, 24(4): 761-768. (in Chinese)

[12]
Meng J J, Wang Y, Wang X D, et al. 2016. Construction of landscape ecological security pattern in Guiyang based on MCR model. Resources and Environment in the Yangtze Basin, 25(7): 1052-1061. (in Chinese)

[13]
Ministry of Environmental Protection of China. 2017. Guidelines for setting red lines for ecological protection. Beijing, China: Ministry of Environmental Protection, National Development and Reform Commission. (in Chinese)

[14]
Naveh Z. 1994. From biodiversity to ecodiversity: A landscape-ecology approach to conservation and restoration. Restoration Ecology, 2(3): 180-189.

DOI

[15]
Peng J, Guo X N, Hu Y N, et al. 2017a. Constructing ecological security patterns in mountain areas based on geological disaster sensitivity: A case study in Yuxi City, Yunnan Province, China. Chinese Journal of Applied Ecology, 28(2): 627-635. (in Chinese)

[16]
Peng J, Zhao H J, Liu Y X, et al. 2017b. Research progress and prospect of regional ecological security pattern construction. Geographical Research, 36(3): 407-419. (in Chinese)

[17]
Pickard B R, Daniel J, Mehaffey M, et al. 2015. EnviroAtlas: A new geospatial tool to foster ecosystem services science and resource management. Ecosystem Services, 14: 45-55.

DOI

[18]
Rapport D J, Böhm G, Buckingham D, et al. 1999. Ecosystem health: The concept, the ISEH, and the important tasks ahead. Ecosystem Health, 5(2): 82-90.

DOI

[19]
Teng M J. 2011. Planning ecological security patterns in a rapidly urbanizing context. Diss., Wuhan, China: Huazhong Agricultural University. (in Chinese)

[20]
Wang X R, Wan R R, Pan P P. 2022. Construction and adjustment of ecological security pattern based on MSPA-MCR model in Taihu Lake Basin. Acta Ecologica Sinica, 42(5): 1968-1980. (in Chinese)

[21]
Wen Y L. 2008. On the construction of ecological civilization and national security. Proceedings of the 7th China National Security Forum. Beijing, China: Chinese Society of Policy Sciences. (in Chinese)

[22]
Wu J S, Luo K Y, Ma H K, et al. 2020. Ecological security and restoration pattern of Pearl River Delta, based on ecosystem service and gravity model. Acta Ecologica Sinica, 40(23): 8417-8429. (in Chinese)

[23]
Wu J S, Zhang L Q, Peng J, et al. 2013. The integrated recognition of the source area of the urban ecological security pattern in Shenzhen. Acta Ecologica Sinica, 33(13): 4105-4133. (in Chinese)

[24]
Xu D L, Zou C X, Xu M J, et al. 2015. Ecological security pattern construction based on ecological protection redlines. Biodiversity Science, 23(6): 740-746.

DOI

[25]
Yang S S, Zou C X, Shen W S, et al. 2016. Construction of ecological security patterns based on ecological red line: A case study of Jiangxi Province. Chinese Journal of Ecology, 35(1): 250-258. (in Chinese)

[26]
Yang T R, Kuang W H, Liu W D, et al. 2017. Optimizing the layout of eco-spatial structure in Guanzhong urban agglomeration based on the ecological security pattern. Geographical Research, 36(3): 441-452. (in Chinese)

DOI

[27]
Yu K J. 1999. Landscape ecological security patterns in biological conservation. Acta Ecologica Sinica, 19(1): 8-15. (in Chinese)

[28]
Yu K J, Li D H, Han X L. 2005. On the “Negative planning”. Urban Planning Review, (9): 64-69. (in Chinese)

[29]
Yu K J, Wang S S, Li D H, et al. 2009. The function of ecological security patterns as an urban growth framework in Beijing. Acta ecologica sinica, 29(3): 1189-1204. (in Chinese)

[30]
Zhao L F, Wang X, Wang Y G, et al. 2020. Construction of landscape ecological security pattern of Shendong Mineral Area based on the mini-mum cumulative resistance model. Energy and Environmental Protection, 34(6): 81-88. (in Chinese)

Outlines

/