
Journal of Resources and Ecology >
The Influencing Factors of Tourist Satisfaction in Mountain Outdoor Tourism Destinations—A Case Study of Siguniang Mountain
|
GONG Jian, E-mail: 916762854@qq.com |
Received date: 2022-08-18
Accepted date: 2023-01-30
Online published: 2023-09-27
Supported by
The Key Research Base of Sichuan Provincial Department of Education Humanities and Social Sciences Project(XXTYCY2023C10)
The Key Research Base of Philosophy and Social Sciences in Sichuan Province Project(LY23-23)
The Zigong Philosophy and Social Science Research Base(GT-02202303)
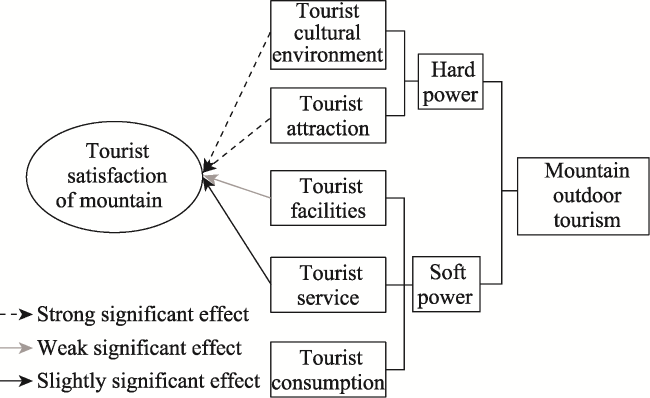
This study mainly examines the factors influencing mountain outdoor tourism development in light of the regional economy, human environment, infrastructure, talent services, and other aspects. It analyzes the advantages and disadvantages of mountain outdoor tourism development in the process of regional development by combining qualitative research with quantitative research, and puts forward corresponding sustainable development measures in combination with an actual investigation. These measures can provide certain guidance and practical information for the ultimate realization of mountain outdoor tourism in harmony with the residents, which is a win-win situation. Taking Siguniang Mountain as the research area, we adopted the methods of literature review, questionnaire survey and field interview, and used SPSS26 and Smartpls to construct a structural variance model for the related dimensional impact analysis. The results show that the attractants of a mountain outdoor tourism destination and the humanistic environment of the destination have a highly significant relationship with tourist satisfaction. Mountain outdoor tourism destination services and facilities have a low degree of significant relationships with tourist satisfaction. Among them, the path coefficient of outdoor tourism destination consumption in mountainous areas is close to 0, and the significance level is greater than 0.05, so the relationship between destination consumption and tourist satisfaction has not been affected. The correlation analysis of Smartpls showed that the tourist satisfaction of mountain outdoor tourism destinations in Siguniang Mountain is mainly affected by the cultural environment, tourism attractions and tourism facilities of the mountain outdoor tourism destinations. The analysis of the final results of the structural equation model indicated that the cultural environment and tourist attractions of the tourist destination have high positive significant relationships with the satisfaction of tourists, while the significance of the relationship between the facilities of the tourist destination and the satisfaction of tourists is weak, and the positive relationship between the service factors of the tourist destination and the satisfaction of tourists is also weak. Therefore, the functional relationship is “two strong, one weak and one weak”. Finally, suggestions are put forward for optimizing and improving tourist satisfaction from the aspects of human environment, infrastructure, talent services, and the comprehensive development of tourist destinations, which have a certain reference value for improving tourist satisfaction and the sustainable development of tourist destinations.
GONG Jian , YANG Yuanyao , LING Xiaopan , LIU Yong . The Influencing Factors of Tourist Satisfaction in Mountain Outdoor Tourism Destinations—A Case Study of Siguniang Mountain[J]. Journal of Resources and Ecology, 2023 , 14(6) : 1282 -1291 . DOI: 10.5814/j.issn.1674-764x.2023.06.016
Table 1 Classification of mountain outdoor sports on Siguniang Mountain |
| Classification of mountain outdoor sports | Specific outdoor activities |
|---|---|
| Mountain sports | Hiking, mountain climbing, rock climbing, ice climbing, glacier hiking, mountain biking, orienteering, cross-country running, skiing, snow hiking, horse riding, etc. |
| Water sports | Cold water tracing and drifting |
| Low altitude sports | Paragliding, helicopter sightseeing, etc. |
| Camping activities | Tent camping, RV camping, field survival, etc. |
| Other categories (outdoor leisure activities) | Walking flat belt, rope Park, animal observation, outdoor photography, children’s outdoor activities, mud wrestling, flat scooters, electronic flying saucers, snow circles, dog sleds, observation of the stars, etc. |
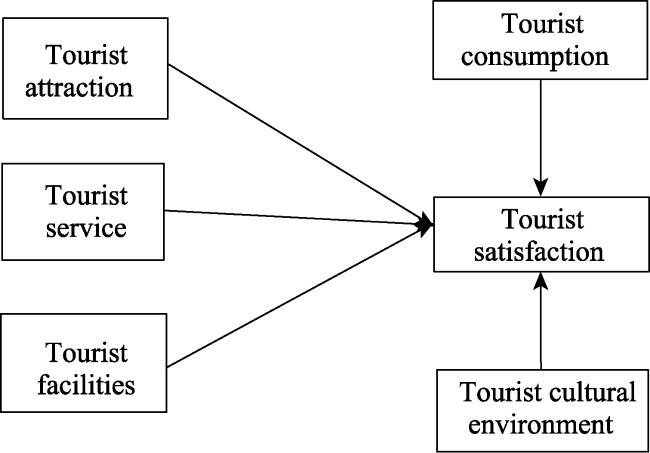
Fig. 1 Theoretical model diagram |
Table 2 Potential and observed variables |
| Potential variable | Observed variable |
|---|---|
| Tourist attraction | The natural environment of the outdoor tourist destination is very beautiful (W1) |
| Mountain outdoor tourist attractions are very attractive (W2) | |
| Mountain outdoor tourist destination has rich ethnic customs (W3) | |
| The local traditional architecture is very distinctive (W4) | |
| Tourist facilities | The local traffic is convenient and parking is convenient (Y1) |
| I’m very satisfied with the accommodation price in the outdoor tourist destination (Y2) | |
| I’m very satisfied with the transportation expenses of the outdoor tourist destination (Y3) | |
| I’m very satisfied with the price of tourist commodities in outdoor tourist destinations (Y4) | |
| Tourist service | The attitude of the service staff at the tourist destination is very good (T1) |
| The service personnel of the tourist destination are very efficient (T2) | |
| Tourist guide or related services (T3) | |
| Tourism consumption | The accommodation conditions in the tourist destination are very good (E1) |
| The dining conditions in the tourist destination are very good (E2) | |
| The recreational conditions in the tourist destination are very good (E3) | |
| The Tourist Tunnel and parking conditions are very good (E4) | |
| Tourist cultural environment | The sanitary environment of the tourist destination is very good (A1) |
| The public security situation in the tourist destination is very good (A2) | |
| The residents of the tourist destination are very friendly (A3) | |
| Tourism Satisfaction | I think this tourist destination is very good (S1) |
| I think this tour is very good (S2) | |
| If I have a chance, I’d like to visit this place again (S3) | |
| I would like to recommend this tourist destination to others (S4) |
Table 3 Analysis of sample population characteristics |
| Name | Content | Frequency | Percentage (%) | Skewness | Kurtosis |
|---|---|---|---|---|---|
| Gender | Male | 229 | 67.6 | 0.753 | -1.441 |
| Female | 110 | 32.4 | |||
| Under 18 years old | 25 | 7.4 | 1.300 | 3.113 | |
| 18-26 years old | 22 | 6.5 | |||
| Age | 27-35 years old | 282 | 83.2 | ||
| 36-45 years old | 4 | 1.2 | |||
| 46-55 years old | 2 | 0.6 | |||
| Over 55 years old | 4 | 1.2 | |||
| Junior high school and below | 8 | 2.4 | -1.517 | 4.112 | |
| Secondary specialized school | 7 | 2.1 | |||
| Education | Junior college | 63 | 18.6 | ||
| Undergraduate | 233 | 68.7 | |||
| Postgraduate and above | 28 | 8.3 | |||
| 3000 yuan and below | 30 | 8.8 | 2.422 | 4.915 | |
| 3001-5000 | 243 | 71.7 | |||
| Monthly income (yuan) | 5001-8000 | 25 | 7.4 | ||
| 8001-12000 | 18 | 5.3 | |||
| Over 12000 | 23 | 6.8 | |||
| Student | 12 | 3.5 | 1.720 | 1.616 | |
| Employees of public institutions | 153 | 65.2 | |||
| Profession | Enterprise/company staff | 82 | 18.2 | ||
| Liberal professions | 57 | 12.9 | |||
| Retired personnel | 1 | 0.3 | |||
| Other | 13 | 3.8 | |||
| Self-driving travelling | 97 | 28.6 | -0.082 | -1.375 | |
| Tourist group | 27 | 8.0 | |||
| Transport mode | Unit/school organization | 78 | 23.0 | ||
| Take your own bus (bus, train, etc.) | 75 | 22.1 | |||
| Other | 62 | 18.3 |
Table 4 Reliability analysis results |
| Variable | Cronbach’s Alpha | Item |
|---|---|---|
| Human environment of outdoor tourism destination | 0.924 | 3 |
| Primer for outdoor tourism destination | 0.946 | 4 |
| Outdoor tourism destination service | 0.937 | 3 |
| Outdoor tourism destination consumption | 0.940 | 4 |
| Outdoor tourism destination facilities | 0.942 | 4 |
| Tourist satisfaction | 0.957 | 4 |
Note: Item=Questions of the dimension. |
Table 5 Validity analysis table |
| Method | Value |
|---|---|
| Kmo and Barrett’s test coefficients | 0.973 |
| Approximate chi square | 10864.374 |
| Freedom | 231 |
| Significance | P<0.001 |
Table 6 Load of external model |
| Variable | Human environment of outdoor tourism destination | Primer for outdoor tourism destination | Outdoor tourism destination service | Outdoor tourism destination consumption | Outdoor tourism destination facilities | Tourist satisfaction |
|---|---|---|---|---|---|---|
| A1 | 0.905 | |||||
| A2 | 0.949 | |||||
| A3 | 0.940 | |||||
| E1 | 0.892 | |||||
| E2 | 0.922 | |||||
| E3 | 0.944 | |||||
| E4 | 0.925 | |||||
| S1 | 0.935 | |||||
| S2 | 0.943 | |||||
| S3 | 0.950 | |||||
| S4 | 0.938 | |||||
| T1 | 0.945 | |||||
| T2 | 0.942 | |||||
| T3 | 0.941 | |||||
| W1 | 0.925 | |||||
| W2 | 0.951 | |||||
| W3 | 0.937 | |||||
| W4 | 0.900 | |||||
| Y1 | 0.906 | |||||
| Y2 | 0.927 | |||||
| Y3 | 0.929 | |||||
| Y4 | 0.929 |
Table 7 Confirmatory factor analysis |
| Dimension | Rho_A | Combined reliability | Average extracted variation (AVE) |
|---|---|---|---|
| Human environment of outdoor tourism destination | 0.926 | 0.952 | 0.868 |
| Primer for outdoor tourism destination | 0.947 | 0.961 | 0.862 |
| Outdoor tourism destination service | 0.937 | 0.960 | 0.888 |
| Outdoor tourism destination consumption | 0.943 | 0.957 | 0.848 |
| Outdoor tourism destination facilities | 0.942 | 0.958 | 0.852 |
| Tourist satisfaction | 0.958 | 0.969 | 0.886 |
Table 8 Overall fitting coefficients |
| Fitting index | CMIN/DF | RMSEA | NFI | RFI | IFI | TLI | CFI |
|---|---|---|---|---|---|---|---|
| Fitting index | 1.332 | 0.013 | 0.912 | 0.909 | 0.9218 | 0.917 | 0.905 |
| Fitting standard | <3 | <0.05 | >0.9 | >0.9 | >0.9 | >0.9 | >0.9 |
Table 9 Differential validity |
| Dimension | Human environment of outdoor tourism destination | Primer for outdoor tourism destination | Outdoor tourism destination service | Outdoor tourism destination consumption | Outdoor tourism destination facilities | Tourist satisfaction |
|---|---|---|---|---|---|---|
| Human environment of outdoor tourism destination | 0.932 | |||||
| Primer for outdoor tourism destination | 0.839 | 0.928 | ||||
| Outdoor tourism destination service | 0.880 | 0.861 | 0.942 | |||
| Outdoor tourism destination consumption | 0.848 | 0.857 | 0.925 | 0.921 | ||
| Outdoor tourism destination facilities | 0.944 | 0.849 | 0.903 | 0.865 | 0.923 | |
| Tourist satisfaction | 0.941 | 0.830 | 0.850 | 0.820 | 0.906 | 0.942 |
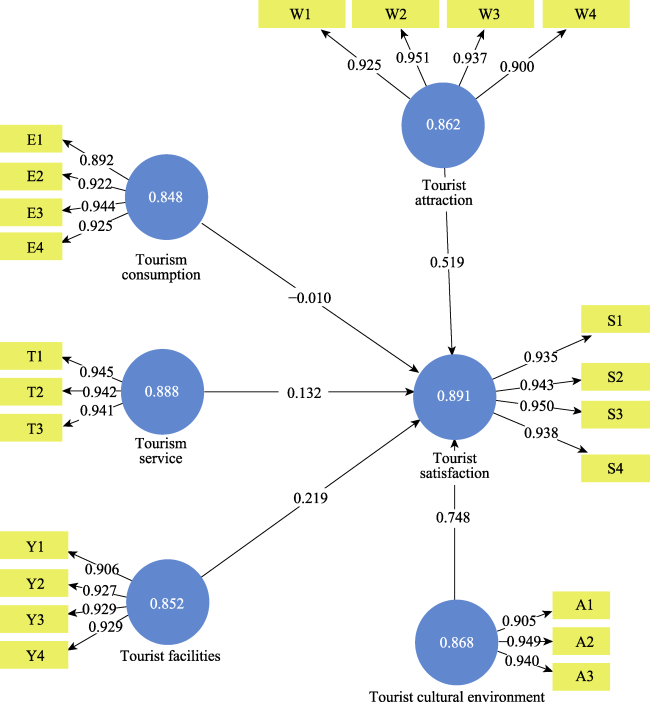
Fig. 2 Model inspection result chart |
Table 10 Model test and analysis results |
| Hypothetical relationship | Initial sample | Sample mean | Standard deviation | T statistic | P value |
|---|---|---|---|---|---|
| Tourist attraction->tourist satisfaction (C1) | 0.519 | 0.903 | 0.014 | 64.111 | P<0.001 |
| Tourism service->tourist satisfaction (C2) | 0.132 | 0.123 | 0.046 | 2.603 | P<0.010 |
| Tourism facilities->tourist satisfaction (C3) | 0.219 | 0.745 | 0.102 | 17.334 | P<0.001 |
| Tourism consumption->tourist satisfaction (C4) | -0.011 | -0.010 | 0.061 | 0.173 | P<0.163 |
| Tourist cultural environment->tourist satisfaction (C5) | 0.748 | 0.945 | 0.010 | 93.114 | P<0.001 |
Fig. 3 Impact mechanism of the factors affecting the tourist satisfaction of mountain outdoor tourism destinations |
| [1] |
|
| [2] |
|
| [3] |
|
| [4] |
|
| [5] |
|
| [6] |
|
| [7] |
|
| [8] |
|
| [9] |
|
| [10] |
|
/
| 〈 |
|
〉 |