Impact of Human Activities on Ecosystem

Impact of Ship Emissions on PM2.5 in the Yangtze River Delta, China, with an Emphasis on the Onshore Airflow

  • ZHAO Ying , 1 ,
  • LI Yue , 2, * ,
  • MA Yizhe 1 ,
  • CHENG Qinyu 1 ,
  • HAO Jianghong 1 ,
  • ZHAO Xiuyong 3 ,
  • CHEN Dongsheng 1
Expand
  • 1. Key Laboratory of Beijing on Regional Air Pollution Control, Faculty of Environment and Life, Beijing University of Technology, Beijing 100124, China
  • 2. Laboratory of Transport Pollution Control and Monitoring Technology, Transport Planning and Research Institute, Ministry of Transport, Beijing 100028, China
  • 3. State Key Laboratory for Clean and Efficient Coal-fired Power Generation and Pollution Control, National Environmental Protection Research Institute for Electric Power Co., Ltd. Nanjing 210031, China
*LI Yue, E-mail:

ZHAO Ying, E-mail:

Received date: 2023-04-03

  Accepted date: 2023-06-15

  Online published: 2023-08-02

Supported by

The National Natural Science Foundation of China(51978011)

The Opening Project of State Key Laboratory for Clean and Efficient Coal-fired Power Generation and Pollution Control(D2022FK082)

Abstract

Ship emissions are an important factor affecting air quality in coastal areas. The adverse effects of ship emissions on coastal air pollutants are more pronounced in the presence of onshore wind. However, existing studies are based on the summer half of the year and specific stations, so the frequency of onshore winds and their effect on the transport of ship emissions are not fully understood for the whole year or for different seasons. Therefore, in this study, the Yangtze River Delta (YRD) region was selected as the target study area, and the WRF/Chem (The Weather Research and Forecast model coupled with Chemistry) model was used to investigate the impact of ship emissions on PM2.5 in coastal areas under the influence of onshore wind in 2018. There are three main findings. (1) The contribution of ship emissions to PM2.5 under the influence of onshore wind was more significant than either the annual average contribution or the contribution under the influence of non-onshore wind, especially in coastal areas. The contributions of ship emissions to PM2.5 during onshore wind hours reached 9.3 μg m-3 and 7.4 μg m-3 in Shanghai and Ningbo, respectively, which were 1.8 and 1.3 times the annual average, respectively. (2) During onshore wind periods, the contribution of ship emissions to PM2.5 increases significantly not only in coastal areas, but also inland. In the central region 200 km from the coast, ship emissions contributed 4.5 μg m-3 to PM2.5 during onshore wind hours, while the annual average was only 2.5 μg m-3. (3) Under the influence of onshore wind, the effect of ship emissions on PM2.5 showed obvious seasonal differences. Under the influence of onshore wind, the contribution of ship emissions to PM2.5 was larger in winter than in other seasons. In summer, the contribution of ship emissions to PM2.5 differed the most between onshore and non-onshore wind periods. In spring, the contribution of ship emissions to PM2.5 was greater even though the frequency of onshore wind was the lowest. The contribution of ship emissions to PM2.5 can often be underestimated when only annual or monthly averages are considered. This is detrimental to the accurate prevention and control of ship emissions by relevant authorities during periods of high pollution. The results of this study will help those authorities to understand the transport characteristics of ship emissions in the presence of onshore airflow and provide insights for coastal air pollution control and management.

Cite this article

ZHAO Ying , LI Yue , MA Yizhe , CHENG Qinyu , HAO Jianghong , ZHAO Xiuyong , CHEN Dongsheng . Impact of Ship Emissions on PM2.5 in the Yangtze River Delta, China, with an Emphasis on the Onshore Airflow[J]. Journal of Resources and Ecology, 2023 , 14(5) : 991 -1000 . DOI: 10.5814/j.issn.1674-764x.2023.05.010

1 Introduction

Ships are a major source of air pollutants (Liu et al., 2018; Cao et al., 2023; Shi et al., 2023), especially in China, which has numerous large ports and harbours. According to the Ministry of Ecology and Environment of the People’s Republic of China, in 2021, the country had 1.3×10⁴ water transport vessels with a net carrying capacity of 2.8×10⁸ t, and they emitted 9.7×10⁴ t of hydrocarbons (HC), 1.5×10⁶ t of nitrogen oxides (NOX) and 6.0×10⁴ t of particulate matter (PM), accounting for 22.6%, 30.9% and 25.6% of total non-road mobile source emissions, respectively. These proportions will continue to increase in the future as ship ownership expands and other anthropogenic emissions are controlled.
Ship emissions are an important factor that influences the air quality in coastal areas (Ma et al., 2022; Zheng et al., 2023). The impact of ship emissions on air pollutants is not only concentrated in coastal areas, but it is also significant in inland areas. Many researchers have investigated the impact of ship emissions on air pollutants in coastal areas, focusing mainly on two aspects. On the one hand, they concentrated on the primary pollutants emitted directly by ships, such as SO2 and NO2. For example, a study by Liu et al. (2018) showed that the average contribution of ship emissions to SO2 in the land area of the PRD region was 0.33 µg m-3. The monthly average contributions of ship emissions to SO2 and NO2 in the port of Ningbo reached 80.72% (2.15 ppbv) and 81.79% (8.79 ppbv), respectively, according to Mao et al. (2020). On the other hand, some have considered the contributions of ship emissions to secondary pollutants, such as PM2.5 and O3. For instance, Feng et al. (2019) noted that the overall contribution of ship emissions to PM2.5 concentrations in the YRD in summer may reach 4.62 µg m-3 and that in Shanghai, inland river vessels are the main contributors (40%-80%) to the urban air quality impact of shipping. Song et al. (2010) found that ship emissions contribute up to 15 ppb to the O3 in coastal areas. A study by Wang et al. (2019) found that ship emissions have significant impacts on both marine and inland O3, with the largest increase of 30-50 µg m-3 mainly in the ship track area, and there was a complex impact on land-based O3. A study by Chen et al. (2018) found a 3.5% contribution of ship emissions to PM2.5 at 100 km from the coastline.
The impact of ship emissions on air pollutants in coastal areas is more pronounced in the presence of onshore air currents. Previous studies have shown that onshore air currents can exacerbate the negative effects of ship emissions on coastal air quality (Liang et al., 2016; Liu et al., 2017; Lv et al., 2018; Ma et al., 2022). For example, a study by Liu et al. (2017) found that onshore air currents significantly affected Shanghai’s coastal and riverine areas within tens of kilometres of the shore, with the contributions of ship emissions to PM2.5 ranging from 2 μg m-3 to 7 μg m-3 (20%- 30%). Based on a study of four sites, Lv et al. (2018) found that during the onshore flow, ship emissions caused an average increase in PM2.5 over land of 4.7%-17.1%, which was 1.8-2.7 times higher than during the remainder of the day. Our previous studies in the Bohai Rim showed that ship emissions contributed 3.17 µg m-3 to the PM2.5 concentrations over the entire land area during onshore winds, while PM2.5 concentrations were only 1.87 µg m-3 during non-onshore winds (Ma et al., 2022). However, these studies were only based on specific time scales and at specific stations. Therefore, the frequency of onshore winds and their effect on the transport of ship emissions are not yet fully understood for a long time series throughout the year or for different seasons.
In order to gain a comprehensive understanding of the impact of ship emissions on air pollutants under onshore airflow conditions, this study used the Yangtze River Delta (YRD) region as the study area. As one of China’s most dynamic economic zones and one of the busiest ports in the world, the YRD region is located on the east coast of China and includes Shanghai (a central coastal city), Jiangsu (north) and Zhejiang (south), covering an area of approximately 2.20×10⁵ km2 and with a population of over 150 million. This region is home to many major ports, with Shanghai Port and Ningbo-Zhoushan Port ranking first and fourth respectively in the world’s top ten container ports.
In this study, the Weather Research and Forecast model coupled with the Chemistry modelling system (WRF/Chem) was used to simulate the contributions of ship emissions to the concentration of PM2.5 in the atmosphere in the YRD. In addition, to investigate the differences in the impact of ship emissions on PM2.5 during the onshore wind period, we distinguished between the onshore and non-onshore wind periods. The results are discussed in terms of seasonal variation and annual average variation. The results of this study may contribute to our understanding of the transport characteristics of ship emissions in the presence of onshore airflow, and provide insights for the control and management of coastal air pollution.

2 Methods

2.1 Study area

The Yangtze River Delta (YRD) is located in the lower reaches of the Yangtze River in China, including the municipality of Shanghai and the provinces of Jiangsu, Zhejiang and Anhui, and covers part of the coastal area of the Yellow Sea and the East China Sea. It has a population of more than 220 million, and is one of the most active regions in China’s economic development and one of the busiest port groups in the world. The coastal port group in the YRD includes more than 15 ports, including Shanghai Port, Ningbo-Zhoushan Port, Zhenjiang Port, Nantong Port, Lianyungang Port, Taizhou Port and Wenzhou Port, among which Shanghai Port and Ningbo-Zhoushan Port are two of the top ten ports in the world. Figure 1 shows the three-level nested map of the simulation area, covering all ports in the YRD.
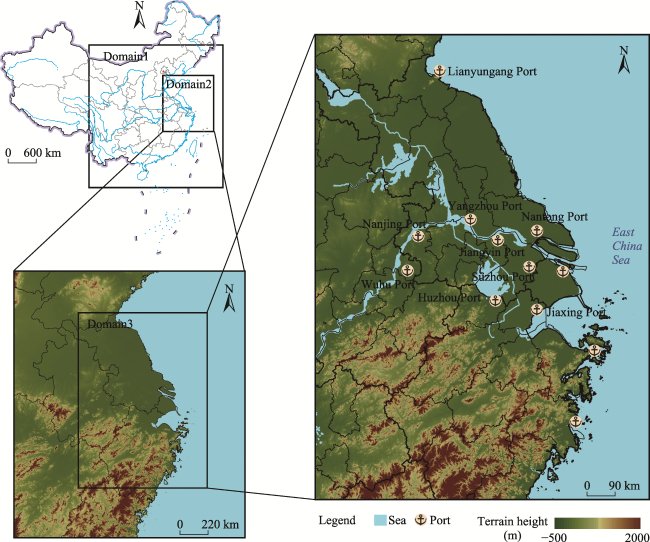
Fig. 1 The map of simulation area and major ports in the Yangtze River Delta region

2.2 Input data and model configuration

2.2.1 Input data

In this study, the WRF/Chem modelling system was used to assess the spatial and temporal variability and seasonal effects of ship emissions on coastal PM2.5 during onshore wind periods. To represent the four seasons, four representative months (January, April, July and October) were chosen for the year 2018. The input data of the modelling system are described below.
1) Meteorological data. The WRF/Chem model used National Centre for Environmental Prediction (NCEP) Final Analysis (FNL) data as the meteorological input.
2) Emissions from shipping. The emission inventory compiled by Chen et al. (2017) was used for the ship emission inventory. Figure 2 shows the spatial distribution of the typical pollutants emitted from ships in the YRD in 2018, of which the annual emissions of SO2, NOx, PM2.5, PM10, HC and CO were 9.1×10⁵, 11.85×10⁵, 1.2×10⁵, 1.3×10⁵, 8.0×10⁴ and 1.8×10⁵ t, respectively.
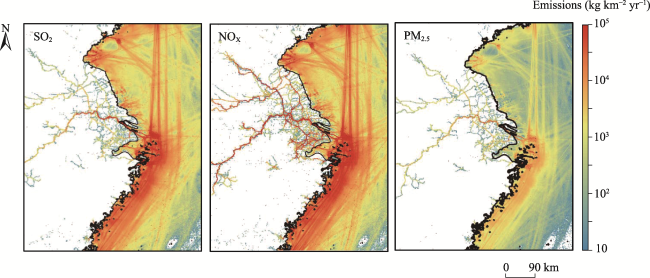
Fig. 2 Spatial distributions of total annual SO2, NOX and PM2.5 emissions (kg km-2 yr-1) from ships in the Yangtze River Delta region in 2018
3) Emissions from other anthropogenic and natural sources. Other inventories of anthropogenic emissions were based on the Multi-resolution Emission Inventory of China (MEIC, www.meicmodel.org) in 2017. The biomass burning emissions were developed using data from Zhou et al. (2017). The biogenic emissions were calculated using the online version of the Model for Emissions of Gases and Aerosols from Nature (MEGAN).

2.2.2 Model configuration

The WRF/Chem model has been extensively applied to simulations of atmospheric compositions. The methods used in this study were similar to those in Ma et al. (2022). Two scenarios (with and without ship emissions) were simulated to assess the impact of ship emissions on PM2.5 in coastal cities under onshore wind conditions. The without-ship emission scenario only included land-based emissions (MEIC, biomass burning and biogenic emissions), while the ship emission scenario considered both land-based emissions and ship emissions. The contribution from the ships was expressed as the difference in simulated pollutant concentrations between the two scenarios.
As shown in Fig. 1, Domain 1 covers eastern China and its coastal areas with a grid resolution of 27 km×27 km (108 rows and 96 columns). Domain 2 covers YRD and parts of the provinces of Shandong, Henan, Hubei, Jiangxi and Fujian with a grid resolution of 9 km×9 km (138 rows and 120 columns). Domain 3 covers YRD with a grid resolution of 3 km×3 km (288 rows and 207 columns). The model consists of 30 vertical layers from the surface to the 100 hPa level, with 18 layers in the first 4 km above the ground and a thickness of about 40 m for the lowest layer. The simulation focused on the full months of January, April, July, and October in 2018 to represent the four seasons. Table 1 shows the physical and chemical schemes used in the model.
Table 1 WRF/Chem settings for the physical and chemical schemes
Chemical and physical options Schemes
Chemical schemes Gas-phase The Regional Acid Deposition Model version 2 (RAMD2)
Aerosol The Modal Aerosol Dynamics Model for Europe (MADE/SORGAM)
Physical schemes Planetary boundary layer Yonsei University (YSU)
Long wave radiation Eta Geophysical Fluid Dynamics Laboratory (GFDL)
Short wave radiation Goddard
Microphysics Purdue Lin
Land surface model Noah

2.3 Model evaluation

To assess the accuracy of the model, meteorological and air pollutant station observations were collected for verification. We compared the WRF/Chem simulation results with the observational data using several statistical metrics, including correlation coefficient (R), mean absolute error (MAE), normalized mean bias (NMB), normalized mean error (NME), mean fractional bias (MFB), mean fractional error (MFE), mean bias (MB), and mean absolute error (MAE). The formulas for these metrics were provided in our previous publication (Ma et al., 2022).
Table 2 provides a summary of the model’s meteorological performance statistics. The results showed that the model performance was generally acceptable, with high correlation coefficients (R), i.e., 0.64-0.89 (statistically significant at a 95% confidence level), and relatively low mean absolute error (MAE) values for temperature (1.21-2.29 ℃), relative humidity (7.98%-13.53%), wind speed (0.69-1.03 m s-1), and wind direction (11.17°-23.25°). These results suggest that the performance of the meteorological model is basically acceptable.
Table 2 Performance indicators at 72 sites in the study region for T2, RH2, WS10 and WD10
Variables Month MBa MAEb NMBc NMEd Re
T2 (℃) January 0.11 1.21 3.38 28.21 0.86
April 2.10 2.94 12.65 17.50 0.88
July 1.82 2.45 6.33 8.40 0.74
October -1.22 2.29 -6.89 11.1 0.85
RH2 (%) January 1.04 10.55 1.42 14.25 0.77
April -3.73 7.98 -4.79 10.73 0.89
July -4.336 9.80 -5.42 12.11 0.71
October -5.74 13.53 -9.75 24.13 0.68
WS10 (m s-1) January 0.48 0.87 18.04 28.02 0.64
April 0.25 0.89 14.10 28.02 0.64
July 0.51 1.03 22.74 29.40 0.68
October 0.32 0.69 15.41 27.84 0.78
WD10 (°) January -13.13 23.25 -4.14 23.39 0.88
April 1.14 11.17 7.90 21.99 0.76
July -2.79 20.08 -15.86 20.41 0.81
October -4.13 14.42 -4.97 24.20 0.87

Note: T2 indicates temperature at 2 m; RH2 indicates relative humidity at 2 m, WS10 indicates wind speed at 10 m and WD10 wind direction at 10 m. a MB indicates the mean bias. b MAE indicates the mean absolute error. c NMB indicates the normalized mean bias. d NME indicates the normalized mean error. e R indicates the correlative coefficient.

The hourly model concentrations were compared with the mean surface observation concentrations from 89 stations to assess the performance of the PM2.5 simulation (Table 3). The results showed strong correlation coefficients (ranging from 0.64 to 0.87) between the modelled and observed values of PM2.5, indicating that the modelled results are closely related to the observed results. The NMB and NME of PM2.5 ranged from -18.24% to 2.38% and from 18.46% to 28.54%, respectively. These results also indicate that the model performance of air pollutants is within the recommended acceptable range.
Table 3 Performance of model simulations for the concentrations of PM2.5 at 89 monitoring sites
Variables Month NMB (%) NME (%) MFB (%) MFE (%) R
PM2.5
(µg m-3)
January -3.05 28.54 -0.26 6.04 0.84
April -1.68 18.46 -0.45 5.26 0.87
July -18.24 27.22 -6.10 8.26 0.79
October 2.38 26.53 0.75 8.98 0.64

Note: NMB indicates the normalized mean bias. NME indicates the normalized mean error. MFB indicates the mean fractional bias. MFE indicates the mean fractional error.

Overall, the WRF/Chem model was able to capture the main features of the meteorological parameters and air pollutants.

2.4 Identification of the onshore wind

Identifying the onshore wind direction is the first step in investigating the effect of ship emissions on PM2.5 under the influence of onshore wind. The wind direction was divided into three categories. The first is the coastal wind, which means that the angle between the wind direction and the coastline is less than 22.5°. The second is the offshore wind, which refers to the wind direction that is blowing from the land to the sea outside of the coastal wind range. The third is the onshore wind, which refers to the wind direction that is blowing from the sea to the land outside of the coastal wind range. This study is concerned with the impact of ship emissions on coastal areas under the influence of onshore wind, and therefore offshore and coastal wind are both considered to be non-onshore wind. Based on the above criteria for identifying onshore and non-onshore wind, and combined with the simulation results for the YRD, the moments of onshore and non-onshore wind were evaluated in different seasons (Fig. 3). In this study, the 20.2% of moments when the wind direction was more chaotic in October were excluded. Figure 3 shows that the average annual frequency of onshore winds in 2018 was 65.2%, with the highest frequency occurring in July (86.8%), followed by October (65.9%) and January (58.5%), and finally April (49.2%). The annual average frequency of non-onshore winds was 29.6%, and the frequency of occurrence between months was the opposite of that of onshore winds, with the highest occurrence in April (50.7%), followed by January (41.1%) and October (13.7%), and finally July (13.1%).
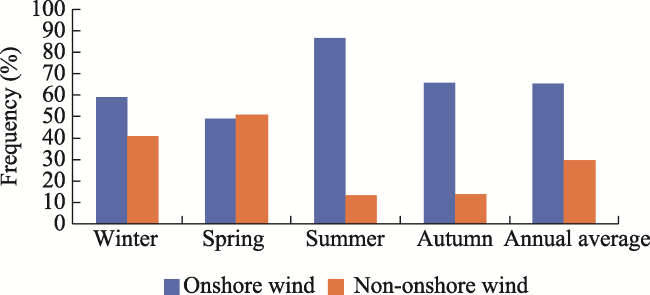
Fig. 3 Frequency of onshore versus non-onshore wind in different seasons and the annual average frequency

3 Results and discussion

3.1 Annual average impact on PM2.5

Figure 4 shows the annual average contribution (extrapolated from the average values for January, April, July and October in 2018) of ship emissions to atmospheric PM2.5 concentrations, as well as their contributions and their difference between onshore and non-onshore wind conditions in the YRD.
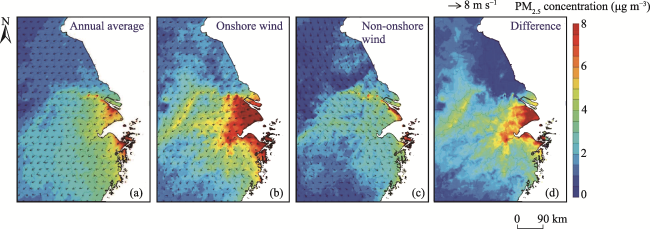
Fig. 4 Distributions of the annual contribution of ship emissions to the atmospheric PM2.5 concentration, as well as their contributions and their difference under onshore and non-onshore wind conditions throughout the YRD region

3.1.1 Contribution of ship emissions to PM2.5

Overall, ship emissions contribute significantly to the PM2.5 in the study area. Figure 4a shows three main characteristics in terms of spatial distribution. 1) The spatial distribution of the contribution of ship emissions to PM2.5 in the atmosphere shows a higher contribution in the southern part of the YRD than in the northern part. 2) The highest impacts of ship emissions on PM2.5 are concentrated in the southern coastal areas, with contributions of 7-8 μg m-3 in the coastal areas of Shanghai and Ningbo. This distribution is partly due to the fact that these areas contain several large world-class ports with a high intensity of ship emissions (e.g., Shanghai Port, Ningbo-Zhoushan Port, etc.), and partly due to the proximity of the coastline to the main shipping channel (Fig. 2), which makes it vulnerable to the transport of emissions from passing ships. 3) Ship emissions not only contribute significantly to PM2.5 concentrations in the coastal areas, but they also have a non-negligible and extensive impact in the inland areas, especially in the southern region where the contributions are high. The average contribution of ship emissions to PM2.5 exceeded 2.5 μg m-3, even at 200 km from the coast.

3.1.2 Impact of ship emissions on atmospheric PM2.5 under onshore wind conditions

As shown in Fig. 4b, during the onshore wind hours, the magnitude and extent of the impact of ship emissions on PM2.5 is much higher than the annual average contribution, which reflects three aspects. 1) The contribution of ship emissions to PM2.5 during the onshore wind hours has a larger value than the annual average contribution. During the onshore wind period, the contribution of ship emissions to PM2.5 in the land area was 2.7 μg m-3, which was 1.3 times the annual average contribution. 2) The most significant increases in the contribution of ship emissions to PM2.5 during the onshore wind period compared to the annual average are concentrated in both Shanghai and Ningbo. The contributions of ship emissions to PM2.5 were 9.3 μg m-3 and 7.4 μg m-3 in Shanghai and Ningbo, respectively, or 1.8 and 1.3 times the annual average. 3) Compared to the annual average, the impact of ship emissions on PM2.5 during onshore wind hours is greater not only in the coastal areas, but also inland, especially in the central inland areas. At 200 km from the coast, ship emissions contributed 4.5 μg m-3 to PM2.5 during the onshore wind periods compared to an annual average of only 2.5 μg m-3. This difference suggests that the contribution of ship emissions to PM2.5 during onshore winds is much higher than the annual average. As a result, since most studies on the impact of ship emissions on air quality only consider the annual average impact, they may often underestimate the contributions of ship emissions to PM2.5. This limitation is not conducive to the accurate prevention and control of ship emissions by authorities during periods of high pollution levels.
Figure 4d shows the difference in the contributions of ship emissions to PM2.5 between the onshore and non-onshore wind periods. In terms of spatial distribution, the greatest differences are in the coastal areas of Shanghai and Ningbo, with contribution difference values of more than 6.5 μg m-3. The spatial distribution of the difference shows a decreasing trend inland, but there is still a large contribution difference at distances of more than 200 km from the coast, especially in the central inland areas, where the average contribution difference value is around 3.5 μg m-3. In terms of concentrations, the contribution of ship emissions to PM2.5 in the inland areas during the onshore wind period is twice as high as during the non-onshore wind periods. Figure 4c shows that although the contribution of ship emissions to PM2.5 is small in the whole land area during the non-onshore wind hours, it is still larger in the Yangtze River estuary, Shanghai port and Ningbo-Zhoushan port, reaching 6.5 μg m-3. The high values in these areas may be due to their proximity to large ports, where ship emissions are more intensive and the contribution of ship emissions to PM2.5 is greater.

3.2 Seasonal average contribution to PM2.5

Figure 5 shows the seasonal average contribution of ship emissions to atmospheric PM2.5 concentrations, as well as their contributions and their differences under onshore and non-onshore wind conditions in the YRD. Overall, the contribution of ship emissions to PM2.5 and the contributions under the influences of onshore and non-onshore winds show significant seasonal differences compared to the average contribution for the whole year.

3.2.1 Contribution of ship emissions to PM2.5

As shown in Fig. 5a, the seasonal variation of the impact of ship emissions on PM2.5 is mainly reflected in two aspects. 1) In terms of spatial distribution, the impacts of ship emissions on PM2.5 are mainly concentrated in the southern part of the YRD in autumn and winter. This seasonality may be due to the influence of northerly and northeasterly winds in autumn and winter; while in summer, it is more obvious in the central coastal areas of the YRD than in other areas; and in spring it is mainly concentrated in most coastal urban areas and in the central inland areas. 2) In terms of the areas with the highest contributions, the areas where ship emissions have the greatest impacts on PM2.5 are concentrated in the southern coastal areas of the YRD in winter, with contributions of 7 μg m-3 to 8 μg m-3. In autumn, this area is concentrated near the ports of Shanghai and Ningbo-Zhoushan, with contributions of more than 7 μg m-3. In summer, this area is distributed in Shanghai and Ningbo, with contributions of more than 7 μg m-3. In spring, this area is distributed in Shanghai and the coastal urban areas of Zhejiang, with contributions of 6.5 μg m-3 to 8 μg m-3.
Note that when comparing meteorological conditions in spring and summer, a more pronounced and consistent onshore flow is observed in summer, and the total wind speed is higher compared to spring. However, for coastal cities, the impacts of ship emissions on PM2.5 are not as significant in summer as in spring. There are several possible reasons for this phenomenon. 1) It may be due to differences in ship emissions between the seasons of the year. The lower emissions from ships in summer compared to spring may be one of the reasons for their lower contributions to PM2.5 concentrations. 2) It may be due to the effect of precipitation on PM2.5 removal. As the YRD is in the East Asian monsoon climate, the amount of precipitation is higher in summer than in spring, which has a stronger effect on PM2.5 removal, resulting in a lower contribution of ship emissions to the PM2.5 concentrations.

3.2.2 Impact of ship emissions on atmospheric PM2.5 under onshore wind conditions

The spatial characteristics of the impact of ship emissions on PM2.5 under the influence of onshore winds demonstrate significant seasonal differences, as shown in Fig. 5b.
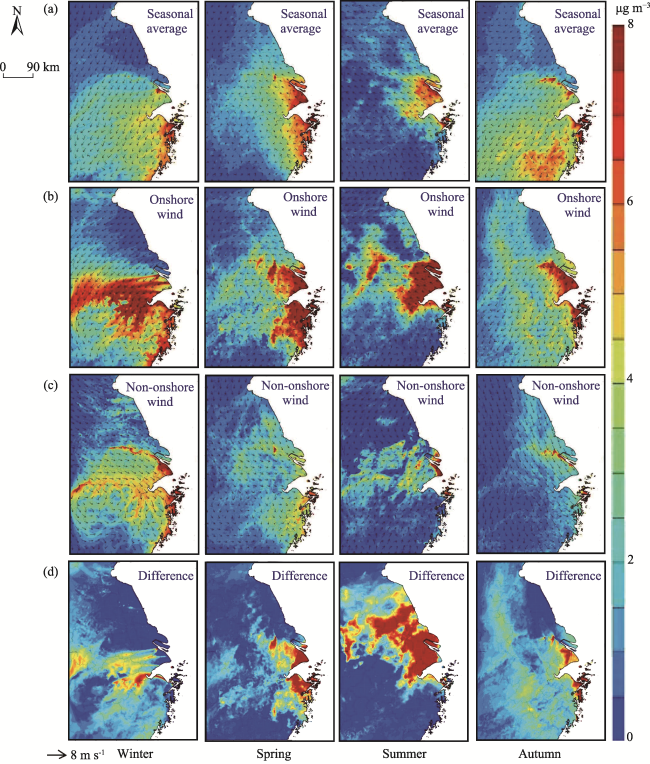
Fig. 5 Seasonal contributions of ship emissions to atmospheric PM2.5 concentration, as well as their contributions and their differences under onshore and non-onshore wind conditions throughout the YRD region
In winter, the impact of ship emissions on PM2.5 is greater during onshore winds than in other seasons, which is indicated by the fact that the area where ship emissions contribute more than 6.5 μg m-3 to PM2.5 is the largest in winter among the four seasons. These areas are concentrated not only in the central and southern coastal areas, but also inland, especially in the central inland areas, where the contributions exceed 6 μg m-3. This seasonality may be due to the lower atmospheric boundary layer height in winter compared to the other seasons, resulting in pollutants that are less able to disperse, leading to higher contributions of PM2.5 in winter.
In summer, the contribution of ship emissions to PM2.5 differs the most between the onshore and non-onshore wind periods. During the onshore wind period, the areas where the contribution of ship emissions to PM2.5 exceeded 7 μg m-3 were mainly located in the central coastal area, while during the non-onshore wind period, this area was only located along the northern coast of Shanghai. This difference may be related to the frequency of onshore and non-onshore winds. In summer, the frequency of onshore winds is highest but the frequency of non-onshore winds is lowest, so that the onshore wind periods carry more pollutant emissions from ships inland.
In spring, the contribution of ship emissions to PM2.5 differs more between the onshore and non-onshore wind periods than in autumn and winter, with a maximum difference of more than 7 μg m-3. During the onshore wind period, the largest impacts of ship emissions on PM2.5 are concentrated in the central coastal and southern coastal areas, with a maximum contribution of more than 7 μg m-3. In contrast, during the non-onshore wind period, the impact of ship emissions on PM2.5 is concentrated only in the vicinity of the Ningbo-Zhoushan port, with a maximum contribution of 5.5 μg m-3. Figure 3 shows that the frequency of onshore winds is lowest in spring, and the frequency of onshore winds is lower than that of non-onshore winds only in spring. However, the results presented here do not indicate that onshore winds have less impact on inland areas in spring than in other seasons, which may be related to the differential emissions from ships in different seasons. The higher emissions from ships in spring would allow more pollutants to be transported inland even though the frequency of onshore winds is lower.
In autumn, during periods of onshore winds, ship emissions have the smallest effect on PM2.5, and the only areas contributing more than 6.5 μg m-3 are concentrated along the coasts of Shanghai, Suzhou, Wuxi and Ningbo.
The variations in seasonal differences in the impact of ship emissions on PM2.5 under the influence of onshore winds suggest that the impact of onshore winds should be considered on a seasonal basis when developing policies related to ship emissions.

4 Conclusions

In this study, the WRF/Chem modelling system was used to investigate the contributions of ship emissions to PM2.5 under the influence of onshore winds in the YRD region in 2018.
The modelling results show that the annual average contribution of ship emissions to PM2.5 in the study area is greater in the southern region and highest in the southern coastal region, with contributions of 7-8 μg m-3. The contribution of ship emissions to PM2.5 during the onshore wind period is greater than both the annual average contribution and the average contribution during the non-onshore wind period. Under the influence of onshore winds, the contribution of ship emissions to PM2.5 in land areas is 2.7 μg m-3, which is 1.3 times the annual average contribution and twice the contribution during non-onshore wind hours. The differences in the contributions of ship emissions to PM2.5 between onshore and non-onshore wind periods are up to more than 6.5 μg m-3.
The impacts of ship emissions on PM2.5 in each season show significant differences compared to the average contribution over the whole year. The impacts of ship emissions on PM2.5 are mainly concentrated in the southern part of the YRD in both autumn and winter, in the central coastal area of the YRD in summer, and in most coastal urban areas and the central inland area in spring. The spatial characteristics of the impact of ship emissions on PM2.5 under the influence of onshore winds also show significant seasonal differences. In winter, the contribution of ship emissions to PM2.5 is greater during onshore wind periods than in the other seasons; in summer, the difference between the contribution of ship emissions to PM2.5 is greatest during onshore and non-onshore wind periods; in spring, the difference between the contribution of ship emissions to PM2.5 is greater during onshore and non-onshore wind periods than in autumn and winter; and in autumn, the contribution of ship emissions to PM2.5 is the lowest during onshore wind periods.
The contribution of ship emissions to PM2.5 is much higher in the case of onshore winds than it is when only annual or monthly averages are taken into account. Therefore, the contribution of ship emissions to PM2.5 is often underestimated when only the annual or monthly averages are considered, which is not conducive to the accurate prevention and control of ship emissions during periods of heavy pollution. Thus, the impact of onshore winds on the transfer of pollutants from ships should be considered when formulating policies related to ship emissions.
In addition, there is some uncertainty in the simulation results, particularly with regard to wind direction variations. As local wind directions are constantly changing, pollutants transported ashore by onshore winds may only remain on land during a shift to a non-onshore wind, resulting in a negligible reduction in ship contributions. Distinguishing these wind shifting moments is difficult with current statistics, so more thorough and comprehensive follow-up studies are required to address this issue.
[1]
Cao Y Y, Lai L, Zhang J X. 2023. Research on the situation and path of green and low-carbon development in Jiangsu Province. Electric Power Technology and Environmental Protection, 39(1): 603-610. (in Chinese)

[2]
Chen D S, Wang X T, Li Y, et al. 2017. High-spatiotemporal-resolution ship emission inventory of China based on AIS data in 2014. Science of the Total Environment, 609: 776-787.

[3]
Chen D S, Zhao N, Lang J L, et al. 2018. Contribution of ship emissions to the concentration of PM2.5: A comprehensive study using AIS data and WRF/Chem model in Bohai Rim Region, China. Science of the Total Environment, 610: 1476-1486.

[4]
Feng J L, Zhang Y, Li S S, et al. 2019. The influence of spatiality on shipping emissions, air quality and potential human exposure in the Yangtze River Delta/Shanghai, China. Atmospheric Chemistry and Physics, 19(9): 6167-6183.

[5]
Liang C J, Xue Y S, Liang J J. 2016. The phenomena of spreading ambient ozone at the west coast air basin of Taiwan. Atmospheric Pollution Research, 7(4): 698-705.

[6]
Liao J B, Wang T J, Jiang Z Q, et al. 2015. WRF/Chem modeling of the impacts of urban expansion on regional climate and air pollutants in Yangtze River Delta, China. Atmospheric Environment, 106: 204-214.

[7]
Liu H, Jin X X, Wu L L, et al. 2018. The impact of marine shipping and its DECA control on air quality in the Pearl River Delta, China. Science of the Total Environment, 625: 1476-1485.

[8]
Liu Z M, Lu X H, Feng J L, et al. 2017. Influence of ship emissions on urban air quality: A comprehensive study using highly time-resolved online measurements and numerical simulation in Shanghai. Environmental Science & Technology, 51(1): 202-211.

[9]
Lv Z F, Liu H, Ying Q, et al. 2018. Impacts of shipping emissions on PM2.5 pollution in China. Atmospheric Chemistry and Physics, 18(21): 15811-15824.

[10]
Ma Y Z, Chen D S, Fu X Y, et al. 2022. Impact of sea breeze on the transport of ship emissions: A comprehensive study in the Bohai Rim Region, China. Atmosphere, 13(7): 1094. DOI: 10.3390/atmos13071094.

[11]
Mao J B, Zhang Y, Yu F Q, et al. 2020. Simulating the impacts of ship emissions on coastal air quality: Importance of a high-resolution emission inventory relative to cruise- and land-based observations. Science of the Total Environment, 728: 138454. DOI: 10.1016/j.scitotenv.2020.138454.

[12]
Shi J, Tian Y J, Ren L L. 2023. Frequency and causes of oil spill accidents from ships and storage tanks in Quanzhou, China. Journal of Resources and Ecology, 14(2): 391-398.

[13]
Song S K, Shon Z H, Kim Y K, et al. 2010. Influence of ship emissions on ozone concentrations around coastal areas during summer season. Atmospheric Environment, 44(5): 713-723.

[14]
Tie X X, Madronich S, Li G H, et al. 2007. Characterizations of chemical oxidants in Mexico City: A regional chemical dynamical model (WRF-Chem) study. Atmospheric Environment, 41(9): 1989-2008.

[15]
Wang R, Tie X, Li G, et al. 2019. Effect of ship emissions on O3 in the Yangtze River Delta region of China: Analysis of WRF-Chem modeling. Science of the Total Environment, 683: 360-370.

[16]
Zheng Z Z, Sshi C B, Yin G, et al. 2023. Numerical study on dynamic characteristics of high parameter industrial steam heat exchanger. Electric Power Technology and Environmental Protection, 39(1): 548-557. (in Chinese)

[17]
Zhou Y, Xing X F, Lang J L, et al. 2017. A comprehensive biomass burning emission inventory with high spatial and temporal resolution in China. Atmospheric Chemistry and Physics, 17(4): 2839-2864.

Outlines

/