Ecosystem and Ecological Function

Analysis of the Changes in Water Conservation in Jiangxi Province from 2000 to 2020, and the Determinant Factors

  • ZOU Yuyang , 1 ,
  • DONG Xianbin 2 ,
  • LIU Yafei 1 ,
  • WANG Yingli 2 ,
  • GAO Yue 1 ,
  • FAN Jian 1 ,
  • DING Binbin 1 ,
  • ZHUANG Dachun , 1, * ,
  • ZHANG Wen , 3, *
Expand
  • 1. Civil Engineering and Architecture, Jishou University, Zhangjiajie, Hunan 427000, China
  • 2. Jishou University Zhangjiajie College, Zhangjiajie, Hunan 427000, China
  • 3. Institute of Atmospheric Physics, Chinese Academy of Sciences, Beijing 100029, China
*ZHUANG Dachun, E-mail: ;
ZHANG Wen, E-mail:

ZOU Yuyang, E-mail:

Received date: 2022-12-28

  Accepted date: 2023-02-26

  Online published: 2023-08-02

Supported by

The China High-resolution Earth Observation System(30-Y30F06-9003-20/22)

Jishou University Postgraduate Research Innovation Project(JGY202150)

Abstract

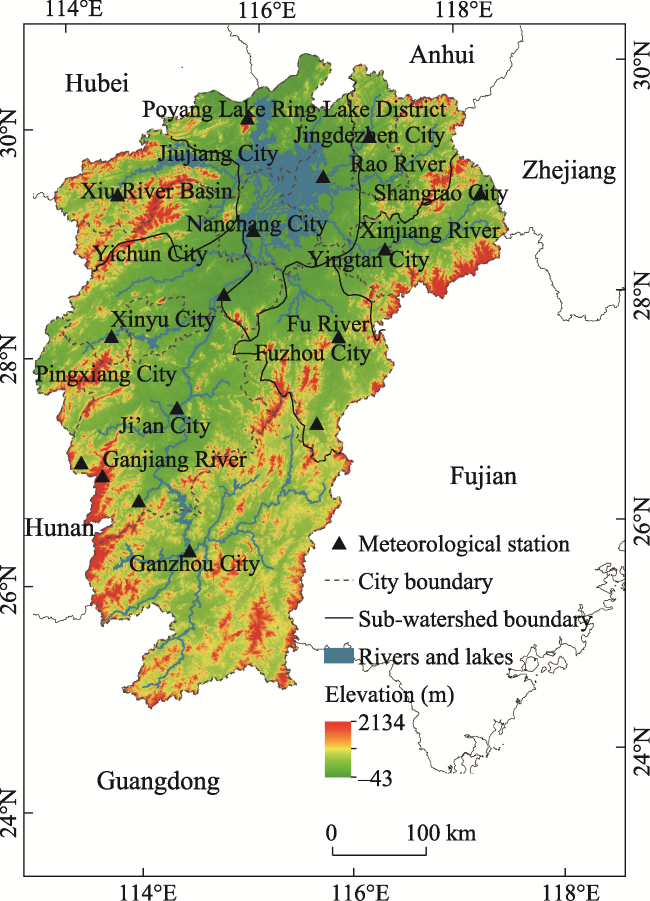
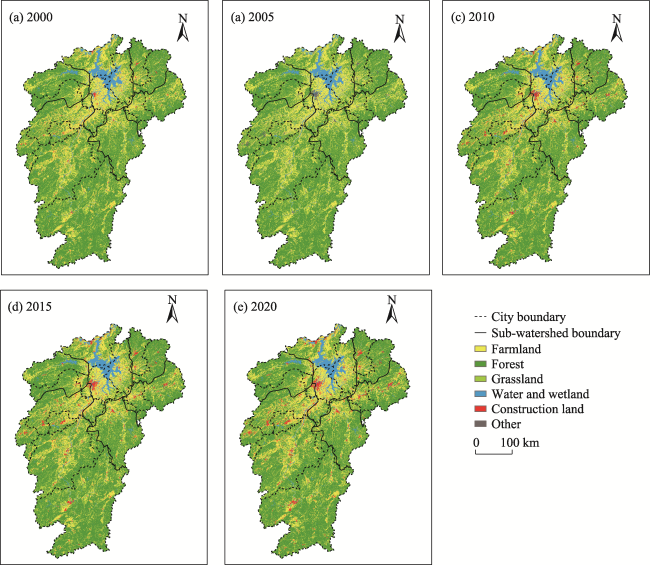
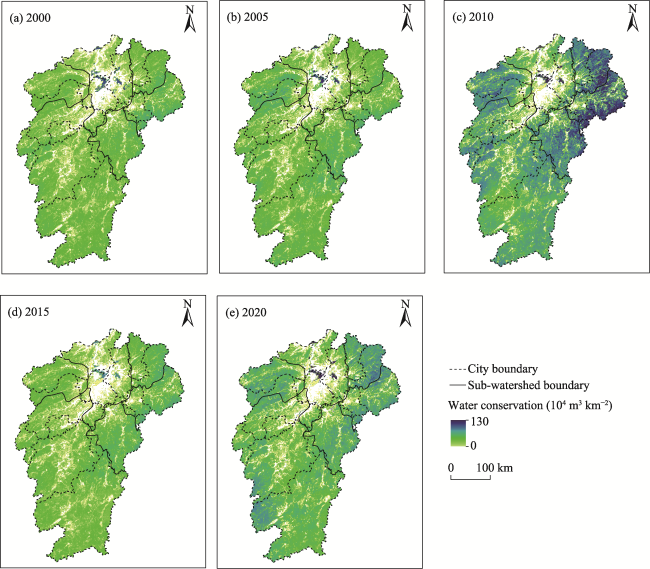
Water conservation is a crucial functional aspect of ecosystem service. Revealing the temporal and spatial changes in water conservation and exploring the factors influencing those changes are of great significance for the utilization of water resources and the construction of ecological civilization. In this study, we estimated the water conservation changes in Jiangxi over the 20 years from 2000 to 2020 by the rainfall storage method. Thereafter, the GeoDetector was applied to analyze the contributions from various factors, including climatic variations and ecosystem transformations, to the changes in the water conservation. The results showed three important trends. (1) From 2000 to 2020, farmland, grassland, water and wetland dominated the northern part of the Poyang Lake Basin except for the forests. The transformations of ecosystem types in the study area mainly occurred between forests, farmland and towns in the 20 years. During this period, the urban area showed a significant increase of 92.63%, while the other ecosystem types showed decreasing trends. (2) The province’s water conservation function declined from 2000 to 2020, with a total loss of 97.11×10⁴ m3 km-2, and in the study area it is characterized as high in the east and west and low in the middle. (3) Factorial analysis showed that the changes in the water conservation were not caused by any one factor alone. The q values of ecosystem type change interactions with the changes in annual precipitation, annual temperature and sunshine hours calculated by the GeoDetector were 0.555, 0.541 and 0.501, respectively. Therefore, the interactions between factors contributed 50% more than the single factors in affecting the changes of water conservation.

Cite this article

ZOU Yuyang , DONG Xianbin , LIU Yafei , WANG Yingli , GAO Yue , FAN Jian , DING Binbin , ZHUANG Dachun , ZHANG Wen . Analysis of the Changes in Water Conservation in Jiangxi Province from 2000 to 2020, and the Determinant Factors[J]. Journal of Resources and Ecology, 2023 , 14(5) : 940 -950 . DOI: 10.5814/j.issn.1674-764x.2023.05.005

1 Introduction

In the 6th assessment report, the Intergovernmental Panel on Climate Change (IPCC) stated that global warming is already a fact that cannot be denied (Jeff, 2022). The problems of accelerated water cycles, droughts, and floods are intensifying due to global warming (Zhang et al., 2008; Silvio et al., 2013). Water conservation is a key role of ecosystems in the fight against droughts and floods, and it reflects the capacity of an ecosystem to keep its water balance within certain temporal, geographical, and environmental regions. However, this functional capacity is sensitive to shifts in ecosystem types, precipitation, temperature, and evapotranspiration (Gong et al., 2017). Many primary studies concerning water conservation focused primarily on river water systems (i.e., runoff regulation, Pian and Wang, 1990). As the links between ecosystems and water in river systems were recognized, studies on the water conservation functions of ecosystems (including storing precipitation, purifying water quality and soil water content, etc.) gradually proliferated (Liu et al., 2020). While some studies continued to investigate water and sand loads and their meteorological and hydrological factors (Mansoor et al., 2013; Natalia et al., 2015), more studies began looking at the temporal and spatial variations in the water conservation of watersheds, administrative units, and ecosystem types (Xu et al., 2019; Feng et al., 2021; Guanet et al., 2022). In China, the water conservation capacities of the ecosystems are high in the east and low in the west, and the area of intermediate water conservation capacity has decreased significantly in recent years (Zhang et al., 2022a).
Jiangxi plays a crucial role in the ecological security barrier of southern China. In June 2016, it joined Fujian and Guizhou provinces to form China’s first ecological civilization pilot zone. Despite the long-held belief that Jiangxi has abundant water and does not need to worry about lacking water resources, Jiangxi’s per capital water resources are only one-third of the global average (Cao et al., 2016). Moreover, the bulk of the rainfall is in April and May, while the peak of water use is in July and August. This temporal mismatch of the water supply and water demand emphasizes the importance of water conservation in this province.
Jiangxi’s forest cover is roughly 63.1%, with acidic soils that are prone to erosion. According to the China Soil and Water Conservation Bulletin 2020, Jiangxi’s soil erosion is twice as severe as in Fujian, which impedes its economic and social development. The assessment of water retention in Jiangxi was mostly carried within individual towns, counties or watersheds (Pan et al., 2017; Zhang et al., 2022b; Zhao et al., 2022) using different approaches by considering mainly forest types and soil quality (Ai et al., 2021; Wen et al., 2022a; Wen et al., 2022b). Most of those studies involve a small scope. Two separate studies (Cao et al., 2016; Cha et al., 2020) assessed the water conservation in Jiangxi over the period of 2010-2015 and the multi-year averages, respectively, but the driving forces behind the changes in water conservation have not been investigated by factorial analysis. While water conservation capacity is determinately defined by factors of land cover, soil properties terrain topology, etc., the contributions from the interactions among these factors are rarely investigated.
In this study, the spatial and temporal variations of water conservation in Jiangxi Province were analyzed over the period from 2000 to 2020 by the rainfall storage method. The GeoDetector model (Abdullah et al., 2022; Cui et al., 2022) was then applied to identify the factors that shaped the spatiotemporal changes in water conservation and their interactions.

2 Study area and data sources

2.1 Study area

Jiangxi is a province in the southeast of China (24°29′- 30′04′N, 113°34′-118°28′E). The climate is subtropical monsoon, with a mean annual temperature ranging from 16.2 ℃ to 19.7 ℃, annual precipitation between 1341.4 mm and 1934.4 mm, and sunshine time from 1259 h to 1905 h. The monsoon climate causes significant seasonal and inter-annual rainfall variations, and there are often droughts and floods in a same year and between years. The southern half of the province is mountainous with hollies, whereas the northern half is flat where Poyang Lake is located (Fig. 1). Poyang Lake Basin is comprised of six parts: Ganjiang River Basin, Fei River Basin, Xinjiang River Basin, Rao River Basin, Xiushui Basin, and Poyang Lake Ring Lake District. The total annual water resources are about 1.68556×10¹¹ m3, and the per capital water resource amount is 3730 m3. The main sources of the water resources in Jiangxi are precipitation and surface runoff from the Yangtze River. Soil water storage, surface runoff, and rainfall water storage are the main forms of water conservation.
Fig. 1 Overview of the study area

2.2 Data sources

This study acquired the land use data of the years 2000, 2005, 2010, 2015, and 2020 from the Resource and Environment Data Center, Chinese Academy of Sciences (http://www.resdc.cn). These datasets were compiled via visual interpretation of Landsat TM/ETM and Landsat8 images. We reclassified the land use types in the datasets into six categories: construction area including both urban and rural residences, farmlands, forests, grasslands, water and wetlands, and unused lands. The observational data from 18 meteorological stations in Jiangxi province and the surrounding area were obtained from the National Meteorological Information Center. Using spatial interpolation, we rasterized the daily observations of the precipitation, temperature and sunshine hours (Lu et al., 2019). The vegetation coverage data from 2000 to 2020 were calculated from the MODIS 1 km 16-day maximum synthetic NDVI data.

2.3 Method

We first calculated the water conservation amounts and the inter-changes between the five ecosystem types in Jiangxi between 2000 and 2020, and then a factorial analysis was performed to determine the influences of the factors and their interactions on the changes in water conservation.

2.3.1 Changes in ecosystem types

Farmlands, forest, grasslands, water and wetlands, and construction lands are the five main categories of ecosystems in Jiangxi. The variables of the areal percentage, the quantity and rate of areal changes, the Dynamic Index for each ecosystem type, and the quantitative and qualitative changes in ecosystem distribution and composition were evaluated. The formulas are as follows:
$\Delta A={{A}_{e}}-{{A}_{s}}$
$F=\frac{\Delta A}{{{A}_{s}}}\times 100%$
${{R}_{i}}=\frac{{{A}_{i}}}{{{A}_{\text{total}}}}\times 100%$
$D=\frac{{{A}_{2020}}-{{A}_{2000}}}{{{A}_{2000}}}\times \frac{1}{T}\times 100%$
where ΔA is the areal change; As and Ae are the areas at the beginning and the end of an evaluation period; F is the rate of areal change; Ri is the areal proportion that ecosystem type i occupied in a certain year; Ai denotes the area of an ecosystem in a certain year; Atotal represents the total area occupied by all the ecosystems of the study area; D is the Ecosystem Types Dynamic Index for 2000-2020; A2020 and A2000 represent the areas of the different ecosystem types of the years 2000 and 2020, respectively; and T denotes the time duration.
The transfer matrix (Li et al., 2020) was used to demonstrate the inter-ecosystem changes, where Sij represents the changes in the area from ecosystem i to ecosystem j during a time period of concern (Formula 5):
$S=\left[ \begin{matrix} {{S}_{11}} & {{S}_{12}} & \ldots & {{S}_{1n}} \\ {{S}_{21}} & {{S}_{22}} & \ldots & {{S}_{2n}} \\ \ldots & \ldots & \ldots & \ldots \\ {{S}_{m1}} & {{S}_{m2}} & \ldots & {{S}_{mn}} \\\end{matrix} \right]$

2.3.2 Calculation of water conservation capacity

In this study, we used the rainfall storage method (Ouyang et al., 2004) to calculate the water conservation capacity (Q, m3 km-2) by formulas (6), (7) and (8).
$Q=A\times J\times R$
$J={{J}_{0}}\times K$
$R={{R}_{0}}-{{R}_{g}}$
In the formulas, a larger value of Q indicates a greater ecosystem water conservation capacity, measured in m3 km-2; A denotes the ecosystem’s area (km2); J indicates the water resource yield (mm); J0 indicates the mean annual precipitation (mm); and K is the coefficient for the fraction of water resource production to the total rainfall. K takes effect in Formula 7 only when the precipitation level is higher than a threshold. The precipitation thresholds for Formula 7 were collected from the published literature (Li et al., 2006). R represents the benefit of ecosystems to runoff reduction, while Rg is the runoff of an ecosystem, and the runoff of bare land is denoted by R0.
Among these parameters, the measured daily precipitation data from the nearby meteorological stations were used to sum up the amount of rainfall greater than the water resource production criterion, and then the ratio of water resource production of the total rainfall (K value) was calculated. The spatial distribution of the proportion of water resource production to total rainfall in Jiangxi Province was estimated by the spatial interpolation of the calculated K value at each station. The benefit coefficient of runoff reduction R was obtained from previously published research (Meng, 1999; Zhu et al., 2003; Yin and He, 2011).

2.3.3 GeoDetector

Wang et al. (2017) developed the GeoDetector, a tool for spatial statistical analysis. The fundamental rationale underlying this model is that if two features of concern are correlated in nature, then their geographic distributions should spatially match. In this study, a factorial detection as well as the interactions of the candidate factors were analyzed in order to explore how the changes in climate and ecosystem types influenced the water conservation.
Factor detector: Determines how significantly the dependent variable Y will change if the independent variable X changes and its statistic q is calculated by the formulas (9) and (10).
$q=1-\frac{\sum\limits_{h=1}^{L}{\sum\limits_{i=1}^{_{{{N}_{h}}}}{{{\left( {{Y}_{hi}}-{{{\bar{Y}}}_{h}} \right)}^{2}}}}}{\sum\limits_{i=1}^{N}{{{\left( {{Y}_{i}}-\bar{Y} \right)}^{2}}}}=1-\frac{\sum\limits_{h=1}^{L}{{{N}_{h}}\sigma _{h}^{2}}}{N{{\sigma }^{2}}}=1-\frac{SSW}{SST}$
$SSW=\underset{h=1}{\overset{L}{\mathop \sum }}\,\underset{i=1}{\overset{{{N}_{h}}}{\mathop \sum }}\,{{\left( {{Y}_{hi}}-{{{\bar{Y}}}_{h}} \right)}^{2}}=\underset{h=1}{\overset{L}{\mathop \sum }}\,{{N}_{h}}\sigma _{h}^{2}$
In Formulas (9) and (10), L is the number of partitions of the study area by the factorial variable X; Nh denotes the number of pixels in a certain partition h, while the total number of pixels of the whole study area is denoted by N. Values of the statistic q close to 1 suggest a stronger explanation of X to Y, with SSW representing intra-partition variation and SST representing the total variance of Y.
Interaction detector: When a composition of more than two factorial (independent) variables is used to enforce the partitioning of the study area, a comparison of the q value of the composition against that deduced separately by the factors can be used to determine whether the explanatory power of the independent variable increases or decreases after the factors interact.

3 Results and analysis

3.1 Changes in ecosystem types from 2000 to 2020

The maps in Fig. 2 show that Jiangxi is dominated by forests, which are mainly distributed in the southern Ganjiang River Basin and account for more than 60% of the overall area in each year (2000, 2005, 2010, 2015, and 2020). Among the cities, Ganzhou and Ji’an have the largest forest areas. Secondly, farmlands account for about 20% of the total area. Northern Poyang Lake is home to Nanchang, Jiujiang, and Shangrao, which together make up the majority of the farming ecosystem. The percentages of land covered by grassland and by water and wetland were relatively small and accounted for only 4%. Grasslands are predominantly distributed around farmlands and the water and wetlands are mainly found around the outskirts of Poyang Lake and the rivers. Less than 3% of the territory is occupied by towns and villages for residence, and they are all clustered in the centers of the cities. Nanchang, Yichun and Ganjiang account for more than 40% of the construction area in Jiangxi in 2020.
Fig. 2 Spatial distribution of ecosystem types in Jiangxi from 2000-2020
During the period of 2000-2020, the inter-changes among the ecosystem types were fragmentary, with reversions in space and time. Tables 1 and 2 show that the study area’s inter-transformations of ecosystem types were primarily between forests, farmlands, and construction areas. The areas converted from forests to farmlands and construction were 4198.26 km2 and 981.71 km2, respectively. The most significant change is the transformation of farmlands into forests, which accounts for 3890.14 km2. The water and wetlands and grasslands showed slightly decreasing trends with trivial fluctuations. During the period from 2000 to 2020, the size of land occupied by towns grew significantly, which was compensated by reductions in other ecosystems. The net increase in the area of construction between 2000 and 2020 was about 2589.04 km2, an increase of 92.63%.
Table 1 The changes in area as well as the rates of change of the different ecosystems in the Jiangxi Province from 2000 to 2020
Type Farmland Forest Grassland Water and wetland Construction land Other
2000-2005 Transfer out area (km2) 5588.22 5015.28 1113.87 784.34 611.73 4.11
Transfer in area (km2) 5421.95 4920.58 947.18 698.36 1125.85 3.63
Net change (km2) -166.27 -94.7 -166.69 -85.98 514.12 -0.48
Rate of change (%) -0.37 -0.09 -2.29 -1.11 18.22 -2.38
2005-2010 Transfer out area (km2) 1224.61 1089.68 464.66 241.53 214.65 2.46
Transfer in area (km2) 1087.78 892.58 149.11 266.19 841.00 0.94
Net change (km2) -136.82 -197.11 -315.55 24.66 626.35 -1.52
Rate of change (%) -0.30 -0.19 -4.43 0.32 18.78 -7.73
2010-2015 Transfer out area (km2) 1146.09 977.48 175.27 103.99 116.53 0.92
Transfer in area (km2) 778.59 759.88 134.49 94.76 752.19 0.39
Net change (km2) -367.50 -217.61 -40.78 -9.24 635.66 -0.53
Rate of change (%) -0.82 -0.21 -0.60 -0.12 16.05 -2.92
2015-2020 Transfer out area (km2) 1708.28 1908.62 255.63 142.41 203.55 0.85
Transfer in area (km2) 1281.27 1114.78 621.02 184.73 1016.82 0.72
Net change (km2) -427.01 -793.84 365.39 42.32 813.27 -0.13
Rate of change (%) -0.96 -0.77 5.41 0.55 17.69 -0.74
2000-2020 Transfer in area (km2) 6752.42 6384.62 1491.88 911.91 628.34 6.26
Transfer out area (km2) 5656.12 5081.20 1333.50 883.64 3217.37 3.59
Net change (km2) -1096.30 1303.42 -158.37 -28.27 2589.04 -2.67
Rate of change (%) -2.42 -1.26 -2.17 -0.37 91.77 -13.25
Table 2 Changes in Poyang Lake Basin ecosystems from 2000 to 2020 (Unit: km2)
2000 2020
Farmland Forest Grassland Water and wetland Construction land Other
Farmland 38547.28 3890.14 336.08 538.81 1985.95 1.44
Forest 4198.26 97259.40 951.85 251.28 981.71 1.53
Grassland 395.16 899.14 5754.97 53.27 143.78 0.52
Water and wetland 575.60 199.86 32.88 6786.25 103.57 0.01
Construction land 485.75 90.17 12.27 40.05 2166.57 0.10
Other 1.35 1.88 0.42 0.23 2.37 13.66
The cities in the Xinjiang River Basin and the Poyang Lake Ring District have experienced the largest amounts of urban growth. The Xinjiang River Basin and the cities of Yingtan and Nanchang, which are in the central Poyang Lake Ring District, respectively, have shown 154.33% and 132.77% increases, respectively. The majority of the expanded construction land came from farmlands, followed by forests, grasslands and water and wetlands. The area of farmland transformed to constructions was 1985.95 km2; and the areas of forests, grasslands and water and wetlands transformed to construction were 981.71 km2, 143.78 km2, and 103.57 km2, respectively. From the perspective of areal loss, forests experienced the largest decline from 2000 to 2020, by a total of 1303.42 km2, followed by farmlands at 1096.3 km2. Grasslands lost only 158.37 km2. All non-construction lands, like the forests, farmlands, grasslands, and water and wetlands in Jiangxi Province, have been reduced and degraded over the past 20 years because of the accelerated urbanization in Jiangxi.

3.2 Analysis of 2000-2020 water conversation changes

Figure 3 shows that the level water conservation is high in the south but relatively poor in the north. High water conservation is predominantly found in the eastern parts of the Rao, Xinjiang, and Fu River basins; while the western and southern areas of Xiushui and the Ganjiang River basin have moderate water conservation; and the central Poyang Lake Ring Districts are low in water conservation. Combined with the distributions of ecosystems, forest and water and wetland ecosystems have higher levels of water conservation than the others.
Fig. 3 The water conservation capacity in Jiangxi Province from 2000 to 2020
Figure 4 shows that the temporal trend of the total water conservation in Jiangxi from 2000 to 2020 experienced a total decrease of 97.11×10⁴ m3 km‒2. Tables 3 and 4 show the analysis results of the 5-year intervals. The total water conservation decreased slightly from 2000 to 2005, by 81.9×10⁴ m3 km‒2. From 2005 to 2010, it increased with fluctuations. The water conservation peaked in 2010 at 510.59×10⁴ m3 km‒2, an increase of 27.96%. The total water conservation of the two periods from 2010-2015 and 2015-2020 exhibited decreasing trends, and the total water conservation lost 26.65×10⁴ m3 km-2 and 173.88×10⁴ m3 km-2 in these two periods, respectively.
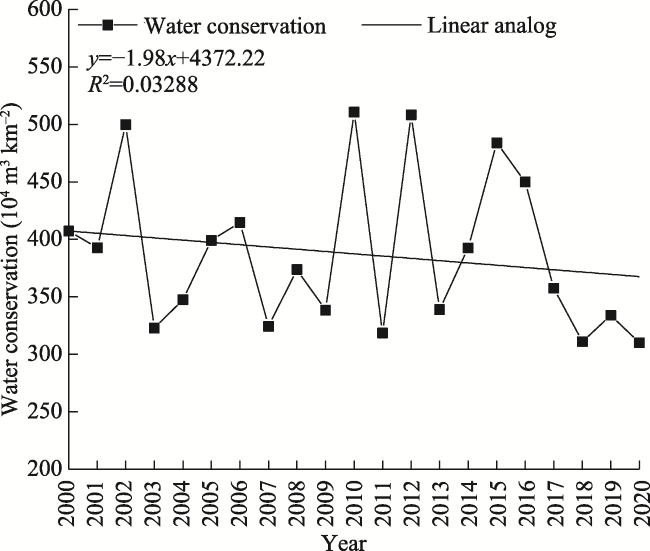
Fig. 4 Total water conservation changes in Jiangxi from 2000 to 2020
Table 3 Water conservation in Jiangxi Province from 2000 to 2020 (Unit: 104 m3 km-2)
Period 2000 2005 2010 2015 2020
Water conservation 407.17 399.01 510.59 483.94 310.05
Table 4 Changes in water conservation of Jiangxi from 2000 to 2020 (Unit: 104 m3 km-2)
Period 2000-2005 2005-2010 2010-2015 2015-2020 2000-2020
Amount of change -8.15 111.58 -26.65 -173.88 -97.11
Rate of change -2.00% 27.96% -5.22% -35.93% -23.85%
Ganzhou, Shangrao, Ji’an, Fuzhou, and Yichun rank as the top 5 in terms of water conservation (Fig. 5), with water conservation amounts in 2020 of 81.03×10⁴ m3 km-2, 47.59×10⁴ m3 km-2, 44.29×10⁴ m3 km-2, 39.47×10⁴ m3 km-2, and 31.87×10⁴ m3 km-2, respectively. The total water conservation of these five cities accounts for 78.79% of the whole Jiangxi Province. Jingdezhen, Pingxiang, Yingtan, Nanchang, and Xinyu are in the last five positions.
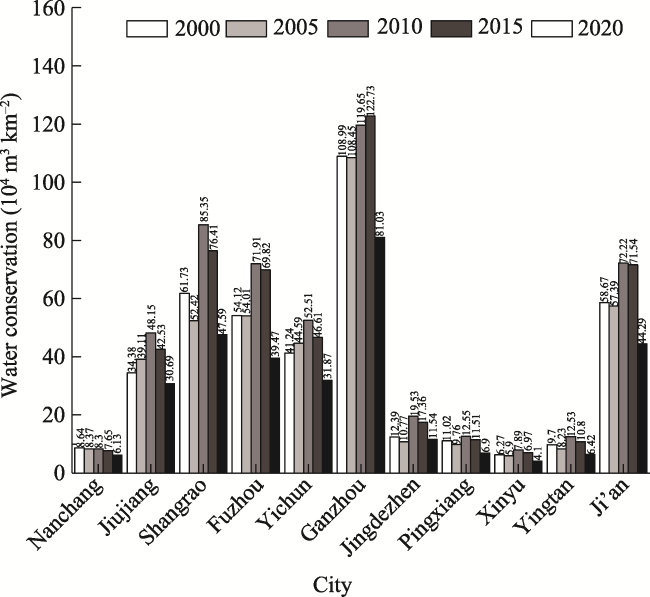
Fig. 5 Water conservation of the individual cities in Jiangxi from 2000 to 2020
The data in Table 5 show that between 2000 and 2020, the water conservation in each city followed mostly the same pace, as they showed fluctuations but were dominated by decreasing trends. With losses of more than 30%, Pingxiang, Xinyu, and Yingtan in the northern Ganjiang River Basin and Yingtan City in the Xinjiang River Basin were the cities with the most significantly decreasing trends. Among them, Pingxiang City in the west of the Ganjiang River Basin had the largest reduction by 37.36%, and 46.1×10⁴ m3 km-2 in volume. The reductions in the Poyang Lake Ring District, Rao River Basin, Fu River Basin, and the north of the Ganjiang River Basin were 20%-30%. Jingdezhen City, in the northern part of the Rao River Basin, had the smallest decrease of only 6.82%.
Table 5 Changes of water conservation of the cities in Jiangxi from 2000 to 2020 (Unit: 104 m3 km-2)
Period Variable Nc Jj Sr Fz Yc Gz Jdz Px Xy Yt Ja
2000-2005 Amount of change -0.28 4.73 -9.30 -0.11 3.35 -0.55 -1.62 -1.26 -0.37 -1.47 -1.28
Change (%) -3.18 13.77 -15.07 -0.21 8.13 -0.50 -13.05 -11.47 -5.87 -15.20 -2.18
2005-2010 Amount of change -0.07 9.04 32.92 17.90 7.91 11.21 8.76 2.79 1.99 4.30 14.83
Change (%) -0.79 23.11 62.80 33.14 17.75 10.33 81.28 28.57 33.74 52.21 25.84
2010-2015 Amount of change -0.65 -5.62 -8.94 -2.09 -5.90 3.08 -2.17 -1.04 -0.92 -1.72 -0.68
Change (%) -7.85 -11.68 -10.48 -2.91 -11.23 2.57 -11.11 -8.27 -11.62 -13.76 -0.94
2015-2020 Amount of change -1.52 -11.84 -28.82 -30.35 -14.74 -41.69 -5.81 -4.60 -2.87 -4.38 -27.24
Change (%) -19.92 -27.84 -37.72 -43.47 -31.62 -33.97 -33.49 -40.01 -41.16 -40.56 -38.08
2000-2020 Amount of change -2.52 -3.69 -14.14 -14.65 -9.37 -27.96 -0.84 -4.12 -2.16 -3.28 -14.37
Change (%) -29.12 -10.73 -22.90 -27.07 -22.72 -25.65 -6.82 -37.36 -34.53 -33.83 -24.50

Note: Nc: Nanchang; Jj: Jiujiang; Sr: Shangrao; Fz: Fuzhou; Yc: Yichang; Gz: Ganzhou; Jdz: Jingdezhen; Px: Pingxiang; Xy: Xinyu; Yt: Yingtan; and Ja: Ji’an.

3.3 Detection analysis of the factors influencing changes in water conservation

Following the suggestion of Robert et al. (2014) that climate change and ecosystem type changes are the two major factors causing changes in water conservation, we prepared four candidate factors for the Geodetector analysis: mean temperature, annual precipitation, annual sunshine hours and ecosystem types. The dependent variable is the changes in water conservation in Jiangxi over the 20 years from 2000 to 2020. The q-values of each factor and their interactions are presented in Table 6.
Table 6 q statistics of the factors for changes in water conservation
Impact factor Annual
precipitation
Mean
temperature
Annual sunshine Ecosystem type
Annual precipitation 0.084
Mean temperature 0.286 0.068
Annual sunshine 0.239 0.295 0.053
Ecosystem types 0.555 0.541 0.501 0.094
The data in Table 6 show that the combined effects of two factors are always much larger than the effects of the individual factors. The interactions of shifts in ecosystem type with other factors improved the explanatory power most notably, to more than 0.5 from less than 0.1 for the factors alone. The explanatory power of the ‘annual precipitation ∩ mean temperature’ (q value = 0.286), ‘annual precipitation ∩ annual sunshine’ (q value = 0.239) and ‘mean temperature ∩ annual sunshine’ (q value = 0.295) are all below 0.5, but significantly stronger than the individual factors alone. This suggests that the ability of any single factor to explain the changes in water conservation in Jiangxi is limited. Therefore, the changes in the water conservation were a consequence of the interplay and reinforcement of the various influencing factors, rather than being dominated by a single factor.
Fig. 6 Changes in annual precipitation and mean temperature in Jiangxi from 2000 to 2020

4 Discussion

Although there are various theories and methods for water conservation assessment, a commonly accepted definition of water conservation has not yet been formed due to ongoing disputes. Therefore, there are various accounting methods and the assessment results vary greatly, so it is difficult to conduct a consistent analysis of the results in different studies, although they are usually at a comparable magnitude (Wu and Shao, 2014). In China and other countries, the most applicable methods for estimating water conservation are the water balance method (Yu et al., 2017; Du et al., 2022) and the integrated water storage capacity method (Yu et al., 2021). In the water balance method, the focus is on water inputs and outputs (Ouyang, 1999), and this method is applicable for studies of the water conservation mechanism. In this method, the surface runoff is not considered, and the regional evapotranspiration is required instead, although accurately measuring the evapotranspiration over an entire region remains challenging (Li et al., 2009). The interaction of the vegetation canopy, the deadfall layer, and the soil layer on precipitation interception is factored into the water storage capacity estimation, but a large amount of field measurements is required for the calculation (Yin et al., 2016). In this study, we employed the rainfall storage method to estimate the regional water conservation. This method has the advantage of being simple for calculations and it requires less data which can be acquired by remote sensing and the routine observations of meteorological stations.
The results of applying the rainfall storage method show that the forest and water and wetland ecosystems have high water conservation levels, with fluctuating and decreasing trends in Jiangxi from 2000 to 2020. This result matches the estimation of Tu et al. (2015) for Poyang Lake’s ecosystem service. The changes in the area of each ecosystem between 2000 and 2005 were significantly larger than in other periods (Table 1). Large amounts of farmland were moved in and out, 5421.95 km2 was moved in and 5588.22 km2 was moved out respectively. This phenomenon coincides with the fact that since 2002, Jiangxi has formally pursued a program of converting agricultural land to forest, which was initially more aggressive. However, ecological protection measures lagged behind the conversion of farmlands, forests, and water and wetlands. This reduced the water conservation by 2% (Table 4). During 2005-2010, there was a small increase in the water and wetland area, the effect of implementing the afforestation and returning farmland to forest programs gradually appeared during this period, and the water conservation showed an increase. However, as the rate of urbanization sped up, the level of water conservation went down from 2010 to 2015. This decline agrees with the results found by Cao et al. (2016). Since Jiangxi joined China’s National Ecological Civilization Pilot Zone in 2016, it has implemented some key initiatives such as national greening and water and wetland restoration. However, the decreasing trend of the water conservation between 2015 and 2020 increased significantly, rising from 5.22% to 35.93% between 2010 and 2015. A study of China’s Chengde Wulie River Basin, Gansu Bailong River Basin, and Yellow River source area found the same tendency (Yin et al., 2016; Liu et al., 2011; Wang et al., 2021). Decreases in water conservation pose risks to the regional water supply as well as the water safety.
Using the GeoDetector, we found that the changes in the water conservation were not caused by a single factor such as ecosystem changes, but by the interactions of the factors. The individual factors such as changes in annual precipitation, mean temperature, annual sunshine, or ecosystem type have lesser impacts on changes in water conservation than the interactions of the factors in Jiangxi. This may be because the study area is generally mountainous and hilly, where lower elevation and higher temperature result in greater evaporation, and therefore lower water conservation. In the northern part of the province, the flat terrain benefits the accumulation of water in farmland, water and wetlands, and other ecosystems. Eventually, the disparity between climate change and changes in ecosystem type diminishes, and the explanatory power q of the influencing factors was damped. Further detection analysis revealed that the interaction of the ecosystem type change and climate change significantly improves the explanation of changes in water conservation. The value of q for the explanatory power increases when ecosystem type change and climate change are combined. Therefore, the level of water conservation in Jiangxi has changed due to the interactions of the changes in ecosystem types and climate.
The data in Fig. 6 show that both temperature and precipitation in Jiangxi Province exhibit consistent upward trends from 2000 to 2020. When the temperature and precipitation rise, however, the process of water conservation is weakened. According to the statistical yearbook, Jiangxi’s total GDP (Gross Domestic Product) rose from US$28.16 thousand million in 2000 to US$361.04 thousand million in 2020. Underlying the GDP increase are the changes in ecosystem type, primarily the increase in construction land. During the 20 years from 2000 to 2020, 2589.04 km2 of the urban area was converted from other ecosystems, representing an increase of 91.77%. The town areas are composed of impermeable substrates with little vegetation cover, which is not conducive to the efficient absorption of precipitation. As a result of the interplay of climatic warming, humidification, and changes in ecosystem types, the temporal trend of water conservation is decreasing, and this trend has accelerated significantly since 2015. With the continuous promotion of urbanization and ongoing climate change, there is a risk that the water conservation in Jiangxi will continue to decrease in the future. Water loss can be reduced by planning ecosystem conservation measures according to the specific climatic and geographic conditions, e.g., converting farmland to forest or grassland as guided by factors such as topographic elevations, aspects, and slopes. Additionally, the locally varying climates of different regions, especially in mountainous areas, should be taken into account during the implementation of major projects such as national greening and water and wetland restoration, in order to obtain the greatest increases in the water conservation in the region.

5 Conclusions

This study calculated the water conservation in Jiangxi province using the rainfall storage method, analyzed the changes in ecosystem types and water conservation from 2000 to 2020, and discussed the factors affecting the changes in water conservation. This analysis led to three main conclusions.
(1) Forest is the primary ecosystem in Jiangxi, followed by farmlands, grasslands, and water and wetlands. The transformations of ecosystems during 2000-2020 were mainly among forests, farmlands, and construction lands. Among them, the areas of forest that were transformed into farmlands, towns, and grasslands were 4073.26 km2, 981.71 km2, and 951.85 km2, respectively. As influenced by urbanization, the areas of towns nearly doubled with an increase of 2589.04 km2 during 2000-2020, whereas the areas of the other ecosystems decreased.
(2) The water conservation level is high in the south and relatively low in the north of the province. From 2000 to 2020, Jiangxi lost 97.11×10⁴ m3 km-2 of its water conservation capacity. The total water conservation level declined by 35.93% between 2015 and 2020, showing a considerably accelerating downward trend.
(3) The changes in water conservation are not caused by a single factor, but by the interactions of the climatic and ecosystem transformations. The interactions between ecosystem changes and changes in annual precipitation, mean temperature, and sunshine hours have a stronger influence on changes in water conservation than the individual factors alone.
The study is jointly supported by Resource and Environment Data Center, Chinese Academy of Sciences and National Meteorological Information Center. We are grateful to them for supplying the data used in this study.

Acknowledgements

The study is jointly supported by Resource and Environment Data Center, Chinese Academy of Sciences and National Meteorological Information Center. We are grateful to them for supplying the data used in this study.
[1]
Abdullah S, Adnan M S G, Barua D, et al. 2022. Urban green and blue space changes: A spatiotemporal evaluation of impacts on ecosystem service value in Bangladesh. Ecological Informatics, 70( 2022): 101730. DOI: 10.1016/j.ecoinf.2022.101730.

[2]
Ai B, Huang Y, Zhu Y H, et al. 2021. Evaluation of water conservation capacity of litter and soil layer in typical forest stands in hilly region of southern Jiangxi Province. Bulletin of Soil and Water Conservation, 41(1): 197-205. (in Chinese)

[3]
Cao F, Xiao R L, Fu Z, et al. 2016. Remote sensing monitoring and analysis of dynamic changes of water conservation in Jiangxi Province. Environment and sustainable development, 41(6): 210-212. (in Chinese)

[4]
Cha D P, Cai H S, Liao B, et al. 2020. Research on evaluation of the importance of water conservation function in Jiangxi Province. Jiangxi Science, 38(3): 335-340. (in Chinese)

[5]
Cui J, Zhu M S, Liang Y, et al. 2022. Land use/land cover change and their driving factors in the Yellow River Basin of Shandong Province based on Google Earth Engine from 2000 to 2020. ISPRS International Journal of Geo-Information, 11: 163. DOI: 10.3390/ijgi11030163.

[6]
Du S X, Liu H J, Zhang M Y, et al. 2022. Evaluation of ecosystem service functions in national key ecological function areas of water conservation. Acta Ecologica Sinica, 42(11): 4349-4361. (in Chinese)

[7]
Feng Y Y, Zhao Y L, Yang Z M, et al. 2021. Spatio-temporal differentiation of trade-offs and synergies of ecosystem services in typical mountain areas of China. Journal of Resources and Ecology, 12(2): 268-279.

[8]
Gong S H, Xiao Y, Zheng H, et al. 2017. Spatial characteristics and influencing factors of water conservation in ecosystems in China. Acta Ecologica Sinica, 37(7): 2455-2462. (in Chinese)

[9]
Guan M L, Zhang Q, Wang B L, et al. 2022. Spatio-temporal evolution and flow of water provision service balance in Jinghe River Basin. Journal of Resources and Ecology, 13(5): 797-812.

[10]
Jeff T. 2022. IPCC’s starkest message yet: Extreme steps needed to avert climate disaster. Nature, 604(7906): 413-414.

[11]
Li K, Mao D H, Li J, et al. 2020. The spatial-temporal evolution and pattern analysis of “Three Lives” in Xiangjiang River Basin. Journal of Natural Science of Hunan Normal University, 43(2): 9-19. (in Chinese)

[12]
Li W H, Zhang B, Xie G D. 2009. Review and prospect of ecosystem services research in China. Journal of Natural Resources, 24(1): 1-10. (in Chinese)

[13]
Li Y S, Wang G X, Wang Y B, et al. 2006. Study on the effect of runoff and sediment production of falling water in the source region of the Yangtze and Yellow Rivers. Advances in Water Science, 17(5): 616-623. (in Chinese)

[14]
Liu D Q, Cao E J, Zhang J Q, et al. 2020. Spatial and temporal pattern of water conservation services in the Bailongjiang River Basin in Gansu and its influencing factors. Journal of Natural Resources, 35(7): 1728-1743. (in Chinese)

[15]
Liu X D, Zhang W Q, Feng Y J, et al. 2011. Research on water conservation function of forest ecosystem: Progress and prospect. Chinese Journal of Ecology, 41(4): 784-791. (in Chinese)

[16]
Lu Q, Yan B, Zhao D S. 2019. Temporal and spatial variation characteristics of climate in Jiangxi Province from 1961 to 2016. Soil and Water Conservation Research, 26(5): 166-173. (in Chinese)

[17]
Mansoor D K L, Marty D M, Eric C C, et al. 2013. Quantifying and mapping multiple ecosystem services change in West Africa. Agriculture, Ecosystems and Environment, 165(15): 6-18.

[18]
Meng X M. 1999. Water and wetland and global environmental change. Scientia Geographica Sinica, 19(5): 385-391. (in Chinese)

[19]
Natalia P, Silvia F, Laura B, et al. 2015. Getting water right: A case study in water yield modelling based on precipitation data. Science of the Total Environment, 537: 225-234.

[20]
Ouyang Z Y, Zhao T L, Wang X K, et al. 2004. Analysis of water ecological service function and its indirect value evaluation. Acta Ecologica Sinica, 24(10): 2091-2099. (in Chinese)

[21]
Ouyang Z Y. 1999. Ecosystem service function value evaluation. Science News, 1999(15): 4-5. (in Chinese)

[22]
Pan P, Ning J K, Ouyang X Z, et al. 2017. Soil and water conservation of different stand types in Shangbeitian River Watershed. Acta Agriculturae Universitatis Jiangxiensis, 39(3): 509-515. (in Chinese)

[23]
Pian G S, Wang L. 1990. Review of water source forest research. Scientific and Technical Information of Soil and Water Conservation, 1990(04): 44-46+55. (in Chinese)

[24]
Robert H, Chang H J. 2014. Assessment of freshwater ecosystem services in the Tualatin and Yamhill basins under climate change and urbanization. Applied Geography, 53: 402-416.

[25]
Silvio F B F, Walter D E P L, Carolina B R. 2013. Managing forest plantation landscapes for water conservation. Forest Ecology and Management, 301: 58-66.

[26]
Tu X S, Long H L. 2015. Spatial patterns and dynamic evolution of ecosystem service values in Poyang Lake Region from 2000 to 2010. Resources Science, 37(12): 2451-2460. (in Chinese)

[27]
Wang H J, Zhang B, Liu Y L, et al. 2018. Multidimensional analysis of urban expansion pattern and driving force of Beijing-Tianjin-Hebei urban agglomeration based on the center of gravity-GTWR model. Acta Geographica Sinica, 73(6): 1076-1092. (in Chinese)

[28]
Wang J F, Xu C D. 2017. Geographical detectors: Principles and prospects. Acta Geographica Sinica, 72(1): 116-134. (in Chinese)

[29]
Wang Y, Xue Z C, Wang L, et al. 2021. Spatial and temporal characteristics of water conservation function in the Wulie River Basin in Chengde City. Grass Industry Science, 38(6): 1047-1059. (in Chinese)

[30]
Wen L S, Deng W P, Zhong L, et al. 2022a. Evaluation of water conservation function of litter layer and soil layer of public welfare forests in different soil texture types in Jiangxi Province. Science of Soil and Water Conservation, 20(3): 35-43. (in Chinese)

[31]
Wen L S, Peng Y, Deng W P, et al. 2022b. Research on water conservation ability and soil erosion sensitivity in Cunninghamia lanceolata and Pinus taiwanensis forest. Journal of Soil and Water Conservation, 36(2): 255-260. (in Chinese)

[32]
Wu D, Shao Q Q. 2014. Analysis on the characteristics of land cover change in the source region of the Yangtze River in the past 30 years. Journal of Earth Information Science, 16(1): 61-69. (in Chinese)

[33]
Xu J, Xiao Y, Xie G D. 2019. Analysis on the spatio-temporal patterns of water conservation services in Beijing. Journal of Resources and Ecology, 10(4): 362-372.

[34]
Yin J Z, He F Q. 2011. Researching the relationship between the change of vegetation cover and runoff based on RS and GIS. Procedia Environmental Sciences, 12: 1077-1081.

[35]
Yin Y H, Wu S H, Zhao D S, et al. 2016. Influence of climate change on water conservation in the source region of the Yellow River in the past 30 years. Geographical Research, 35(1): 49-57. (in Chinese)

[36]
Yu F Q, Lu C X, Xiao Y, et al. 2017. Ecosystem service value assessment for national key eco-function zones for water and soil conservation. Journal of Resources and Ecology, 8(4): 369-377. (in Chinese)

[37]
Yu W M, Su S P, Shen D J. 2021. The impact of Fujian collective forest tenure system reform on changes in water conservation capacity of ecological public welfare forests: An empirical study based on 723 villages. Acta Ecologica Sinica, 41(4): 1362-1372. (in Chinese)

[38]
Zhang B, Li W H, Xie G D, et al. 2008. Water conservation of forest ecosystem in Beijing and its value. Ecological Economics, 69(7): 1416-1426.

[39]
Zhang C S, Xie G D, Liu C L, et al. 2022a. Evaluation of water conservation function of Chinese ecosystem based on water conservation reference system. Acta Ecologica Sinica, 42(22): 9250-9260. (in Chinese)

[40]
Zhang Y, Liu P H, Zhu C M, et al. 2022b. Evaluation on the importance of ecosystem service function based on NPP in Fuzhou City. Guizhou Agricultural Sciences, 50(2): 133-140. (in Chinese)

[41]
Zhao Q C, Yu D, Wang J P, et al. 2022. Spatial and temporal variation and impact factors analysis of ecosystem service value in low mountain counties: Taking Dexing City in Jiangxi Province as an example. Journal of Environmental Engineering Technology, 35(3): 30-37, 44. (in Chinese)

[42]
Zhu L Q, Xu S M, Chen P Y. 2003. The effects of meadow improvement on terrestrial ecosystem’s nutrients: A case study of Jian’ou Niukenglong meadow Ecosystem Experimental Station. Acta Geographica Sinica, 58(5): 703-711. (in Chinese)

Outlines

/