
Journal of Resources and Ecology >
Spatial and Temporal Evolutionary Characteristics of Landscape Pattern of a Typical Karst Watershed based on GEE Platform
|
WEI Qingqing, E-mail: 1220236805@qq.com |
Received date: 2022-12-26
Accepted date: 2023-03-02
Online published: 2023-08-02
Supported by
The Guangxi Key Research and Development Program(AB22035060)
The National Natural Science Foundation of China(32060369)
The Guangxi Academy of Sciences Basic Scientific Research Operation Fund Project(CQZ-D-1904)
Given the high degree of fragmentation and poor resistance to disturbance in karst landscapes, it is important to clarify the spatial and temporal dynamics of landscape patterns in karst areas when designing karst ecological protection strategies. Using the Li River Basin as the study area, the spatial distribution and dynamic evolution of landscape patterns in the basin were analyzed at the levels of landscape utilization, landscape type dynamics and landscape pattern indices based on the Landsat series images for 2000 to 2020 obtained from the GEE platform as the data source. The results show three important aspects of this typical karst watershed. (1) There are large differences in landscape structure and landscape type trends between the karst and non-karst areas in the Li River Basin. (2) The comprehensive landscape type dynamic attitude of the Li River Basin is 0.22%, and the composite index of landscape type use varies from 239.49 to 244.88. The degree of landscape use is higher in karst areas than in non-karst areas, and the rate of landscape change in karst areas is more intense. The integrated index of landscape use in karst areas ranges from 262.32 to 270.50, and in non-karst areas it spans 225.28 to 227.01. The integrated landscape type motility in the karst areas is 0.31%, which is about twice as high as that in non-karst areas. (3) The overall landscape evolution of the Li River Basin shows trends of increasing fragmentation, decreasing connectivity, decreasing dominance and increasing heterogeneity, and these trends are particularly prominent in the karst areas. The results of this study can provide a scientific basis for realizing the construction goals of the National Sustainable Development Innovation Demonstration Zone in Guilin, and a technical reference for the ecological environmental management of the karst watershed.
WEI Qingqing , HE Wen , WANG Jinye , ZHOU Xinran , YAO Yuefeng . Spatial and Temporal Evolutionary Characteristics of Landscape Pattern of a Typical Karst Watershed based on GEE Platform[J]. Journal of Resources and Ecology, 2023 , 14(5) : 928 -939 . DOI: 10.5814/j.issn.1674-764x.2023.005.004
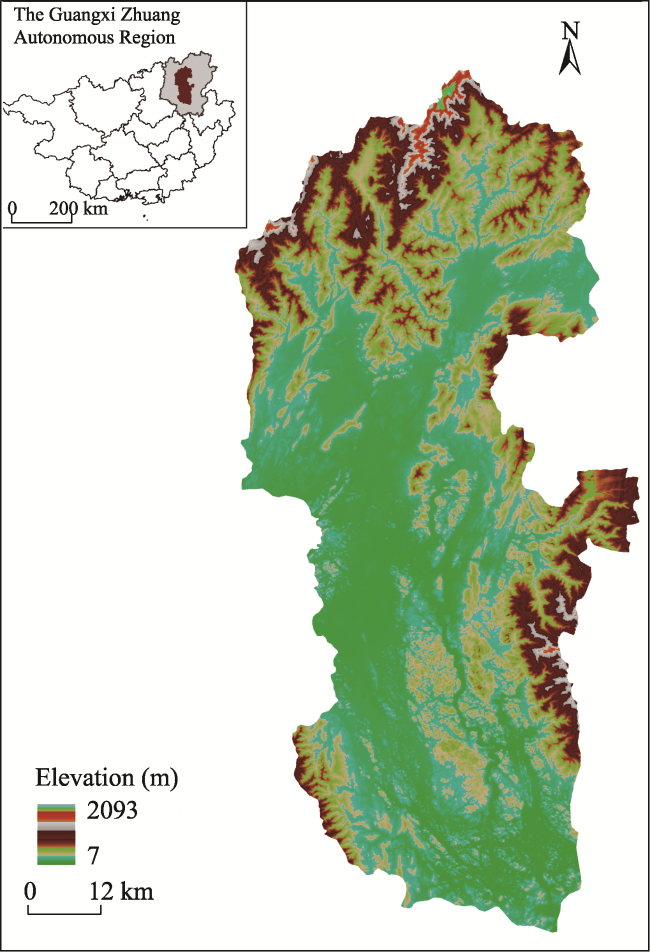
Fig. 1 Map of the Li River Basin location and topography |
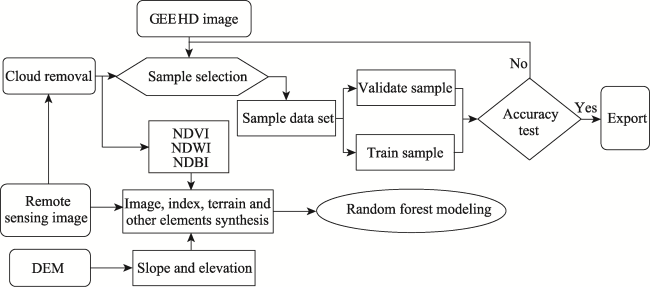
Fig. 2 Flow chart of landscape pattern extraction based on the GEE platform |
Table 1 Accuracy of landscape patch classification results |
| Indicators | 2000 | 2005 | 2010 | 2015 | 2020 |
|---|---|---|---|---|---|
| OA (%) | 96.36 | 97.81 | 94.48 | 94.07 | 96.35 |
| Kappa | 0.95 | 0.97 | 0.93 | 0.92 | 0.95 |
Fig. 3 Distribution of landscape types in the Li River Basin |
Table 2 Areas of the landscape types in the Li River Basin (Unit: km2) |
| Year or period | Arable land | Forest land | Grassland | Waters | Construction land |
|---|---|---|---|---|---|
| 2000 | 2077.50 | 3538.65 | 43.24 | 36.17 | 130.56 |
| 2005 | 2018.68 | 3548.55 | 52.09 | 65.69 | 141.10 |
| 2010 | 1940.81 | 3572.05 | 47.11 | 75.86 | 190.29 |
| 2015 | 1888.79 | 3552.75 | 45.27 | 77.24 | 262.06 |
| 2020 | 1941.13 | 3432.83 | 31.34 | 84.05 | 336.77 |
| 2000-2010 | -136.69 | 33.40 | 3.87 | 39.69 | 59.73 |
| 2010-2020 | 0.32 | -139.22 | -15.77 | 8.19 | 146.48 |
| 2000-2020 | -136.37 | -105.82 | -11.90 | 47.88 | 206.21 |
Table 3 Transfer matrix of each landscape type in the Li River Basin from 2000 to 2020 (Unit: %) |
| 2020 | 2000 | ||||||
|---|---|---|---|---|---|---|---|
| Arable land | Forest land | Waters | Construction land | Grassland | Total | Total transfers in | |
| Arable land | 25.28 | 7.00 | 0.02 | 0.78 | 0.23 | 33.31 | 8.02 |
| Forest land | 5.61 | 52.86 | 0.20 | 0.06 | 0.36 | 58.92 | 6.07 |
| Waters | 0.26 | 0.26 | 0.56 | 0.36 | 0.00 | 1.44 | 0.88 |
| Construction land | 4.49 | 0.24 | 0.01 | 1.05 | 0.00 | 5.79 | 4.74 |
| Grassland | 0.01 | 0.38 | 0.00 | 0.00 | 0.15 | 0.54 | 0.40 |
| Total | 36.65 | 60.72 | 0.62 | 2.25 | 0.78 | 100.00 | |
| Total transfers out | 10.37 | 7.88 | 0.06 | 1.20 | 0.60 | 20.11 | |
Table 4 The rates of change landscape patch types in the Li River Basin (Unit: %) |
| Time period | 2000-2005 | 2005-2010 | 2010-2015 | 2015-2020 | 2000-2020 |
|---|---|---|---|---|---|
| Arable land | -0.59 | -0.77 | -0.54 | 0.55 | -0.35 |
| Forest land | 0.06 | 0.13 | -0.11 | -0.68 | -0.15 |
| Grassland | 4.09 | -1.91 | -0.78 | -6.15 | -1.90 |
| Water area | 16.46 | 3.09 | 0.36 | 1.76 | 2.85 |
| Construction land | 1.98 | 6.97 | 7.54 | 5.70 | 3.06 |
| Integrated landscape type dynamic attitude (${{S}_{total}}$) | 0.21 | 0.28 | 0.25 | 0.46 | 0.22 |
Table 5 Landscape type utilization degree in the Li River Basin |
| Year | 2000 | 2005 | 2010 | 2015 | 2020 |
|---|---|---|---|---|---|
| Composite index of landscape type use (Lj) | 240.14 | 239.49 | 239.84 | 241.42 | 244.88 |
| Time period | 2000-2005 | 2005-2010 | 2010-2015 | 2015-2020 | 2000-2020 |
| Amount of change in landscape use (Lb-a) | -0.65 | 0.35 | 1.58 | 3.46 | 4.74 |
| Rate of change in landscape use (R) | -0.003 | 0.001 | 0.007 | 0.014 | 0.020 |
Table 6 Landscape pattern indices in the Li River Basin |
| Year | PD (pcs km-2) | FRAC_AM | CONTAG (%) | SHDI |
|---|---|---|---|---|
| 2000 | 8.77 | 1.32 | 66.23 | 0.82 |
| 2005 | 11.11 | 1.32 | 63.90 | 0.85 |
| 2010 | 10.19 | 1.32 | 63.34 | 0.87 |
| 2015 | 11.42 | 1.32 | 61.46 | 0.90 |
| 2020 | 12.63 | 1.33 | 59.85 | 0.93 |
Table 7 Quantitative characteristics of the different geographical types |
| Type of landform | Year | Arable land | Forest land | Grassland | Water area | Construction land | |||||
|---|---|---|---|---|---|---|---|---|---|---|---|
| Area (km2) | Ratio (%) | Area (km2) | Ratio (%) | Area (km2) | Ratio (%) | Area (km2) | Ratio (%) | Area (km2) | Ratio (%) | ||
| Karst landscapes | 2000 | 1361.06 | 23.36 | 945.64 | 16.23 | 14.44 | 0.25 | 7.13 | 0.12 | 65.38 | 1.12 |
| 2005 | 1368.43 | 23.49 | 930.26 | 15.97 | 7.54 | 0.13 | 18.05 | 0.31 | 69.39 | 1.19 | |
| 2010 | 1316.53 | 22.60 | 950.56 | 16.32 | 5.87 | 0.10 | 23.62 | 0.41 | 97.08 | 1.67 | |
| 2015 | 1268.59 | 21.77 | 962.65 | 16.52 | 0.42 | 0.01 | 23.66 | 0.41 | 138.34 | 2.37 | |
| 2020 | 1283.11 | 22.02 | 889.98 | 15.28 | 1.59 | 0.03 | 16.74 | 0.29 | 202.24 | 3.47 | |
| Non-karst landscapes | 2000 | 716.44 | 12.30 | 2593.00 | 44.51 | 28.80 | 0.49 | 29.04 | 0.50 | 65.17 | 1.12 |
| 2005 | 650.25 | 11.16 | 2618.29 | 44.94 | 44.56 | 0.76 | 47.65 | 0.82 | 71.71 | 1.23 | |
| 2010 | 624.27 | 10.72 | 2621.48 | 45.00 | 41.25 | 0.71 | 52.24 | 0.90 | 93.21 | 1.60 | |
| 2015 | 620.21 | 10.65 | 2590.10 | 44.46 | 44.85 | 0.77 | 53.58 | 0.92 | 123.72 | 2.12 | |
| 2020 | 658.02 | 11.29 | 2542.85 | 43.65 | 29.74 | 0.51 | 67.31 | 1.16 | 134.53 | 2.31 | |
Table 8 The degrees of landscape utilization in different geographical types |
| Type of landform | Year | Composite index of landscape type use (Lj) | Time period | Amount of change in landscape use (Lb-a) | Rate of change in landscape use (R) |
|---|---|---|---|---|---|
| Karst landscapes | 2000 | 262.32 | 2000 to 2005 | 0.65 | 0.002 |
| 2005 | 262.97 | 2005 to 2010 | 0.14 | 0.001 | |
| 2010 | 263.11 | 2010 to 2015 | 1.45 | 0.005 | |
| 2015 | 264.56 | 2015 to 2020 | 5.94 | 0.022 | |
| 2020 | 270.50 | 2000 to 2020 | 8.18 | 0.031 | |
| Non-karst landscapes | 2000 | 224.67 | 2000 to 2005 | -1.55 | -0.007 |
| 2005 | 223.12 | 2005 to 2010 | 0.50 | 0.002 | |
| 2010 | 223.62 | 2010 to 2015 | 1.66 | 0.007 | |
| 2015 | 225.28 | 2015 to 2020 | 1.73 | 0.008 | |
| 2020 | 227.01 | 2000 to 2020 | 2.34 | 0.010 |
Table 9 The rates of change of landscape patch types in different geographical types (unit: %) |
| Type of landform | Speed of change | 2000 to 2005 | 2005 to 2010 | 2010 to 2015 | 2015 to 2020 | 2000 to 2020 |
|---|---|---|---|---|---|---|
| Karst landscapes | Arable land | 0.11 | -0.76 | -0.73 | 0.23 | -0.30 |
| Forest land | -0.33 | 0.44 | 0.25 | -1.51 | -0.31 | |
| Grassland | -9.56 | -4.43 | -18.56 | 55.74 | -40.30 | |
| Water area | 30.63 | 6.17 | 0.04 | -5.85 | 2.87 | |
| Construction land | 1.22 | 7.98 | 8.50 | 9.24 | 3.38 | |
| Integrated landscape type dynamic attitude (${{S}_{total}}$) | 0.19 | 0.45 | 0.45 | 0.67 | 0.31 | |
| Non-karst landscapes | Arable land | -1.85 | -0.80 | -0.13 | 1.22 | -0.44 |
| Forest land | 0.20 | 0.02 | -0.24 | -0.36 | -0.10 | |
| Grassland | 10.94 | -1.49 | 1.74 | -6.74 | 0.16 | |
| Water area | 12.81 | 1.93 | 0.51 | 5.13 | 2.84 | |
| Construction land | 2.01 | 6.00 | 6.55 | 1.75 | 2.58 | |
| Integrated landscape type dynamic attitude (${{S}_{total}}$) | 0.39 | 0.17 | 0.21 | 0.36 | 0.16 |
Table 10 Landscape pattern index values of the different geographical types in the Li River Basin |
| Type of landform | Year | PD (pcs km-2) | FRAC_AM | CONTAG (%) | SHDI |
|---|---|---|---|---|---|
| Karst landscapes | 2000 | 12.00 | 1.29 | 63.79 | 0.84 |
| 2005 | 14.27 | 1.30 | 62.03 | 0.85 | |
| 2010 | 12.70 | 1.29 | 61.00 | 0.87 | |
| 2015 | 14.65 | 1.29 | 58.82 | 0.92 | |
| 2020 | 16.47 | 1.31 | 56.72 | 0.95 | |
| Non-karst landscapes | 2000 | 7.02 | 1.27 | 72.01 | 0.70 |
| 2005 | 9.52 | 1.28 | 70.00 | 0.72 | |
| 2010 | 9.05 | 1.28 | 69.52 | 0.73 | |
| 2015 | 9.91 | 1.29 | 67.73 | 0.76 | |
| 2020 | 10.79 | 1.29 | 66.65 | 0.79 |
| [1] |
|
| [2] |
|
| [3] |
|
| [4] |
|
| [5] |
|
| [6] |
|
| [7] |
|
| [8] |
|
| [9] |
|
| [10] |
|
| [11] |
|
| [12] |
|
| [13] |
|
| [14] |
|
| [15] |
|
| [16] |
|
| [17] |
|
| [18] |
|
| [19] |
|
| [20] |
|
| [21] |
|
| [22] |
|
| [23] |
|
| [24] |
|
| [25] |
|
| [26] |
|
| [27] |
|
| [28] |
|
| [29] |
|
| [30] |
|
| [31] |
|
| [32] |
|
/
| 〈 |
|
〉 |
